# Backtest Viewer (/docs/ai-backtesting/backtest-viewer)
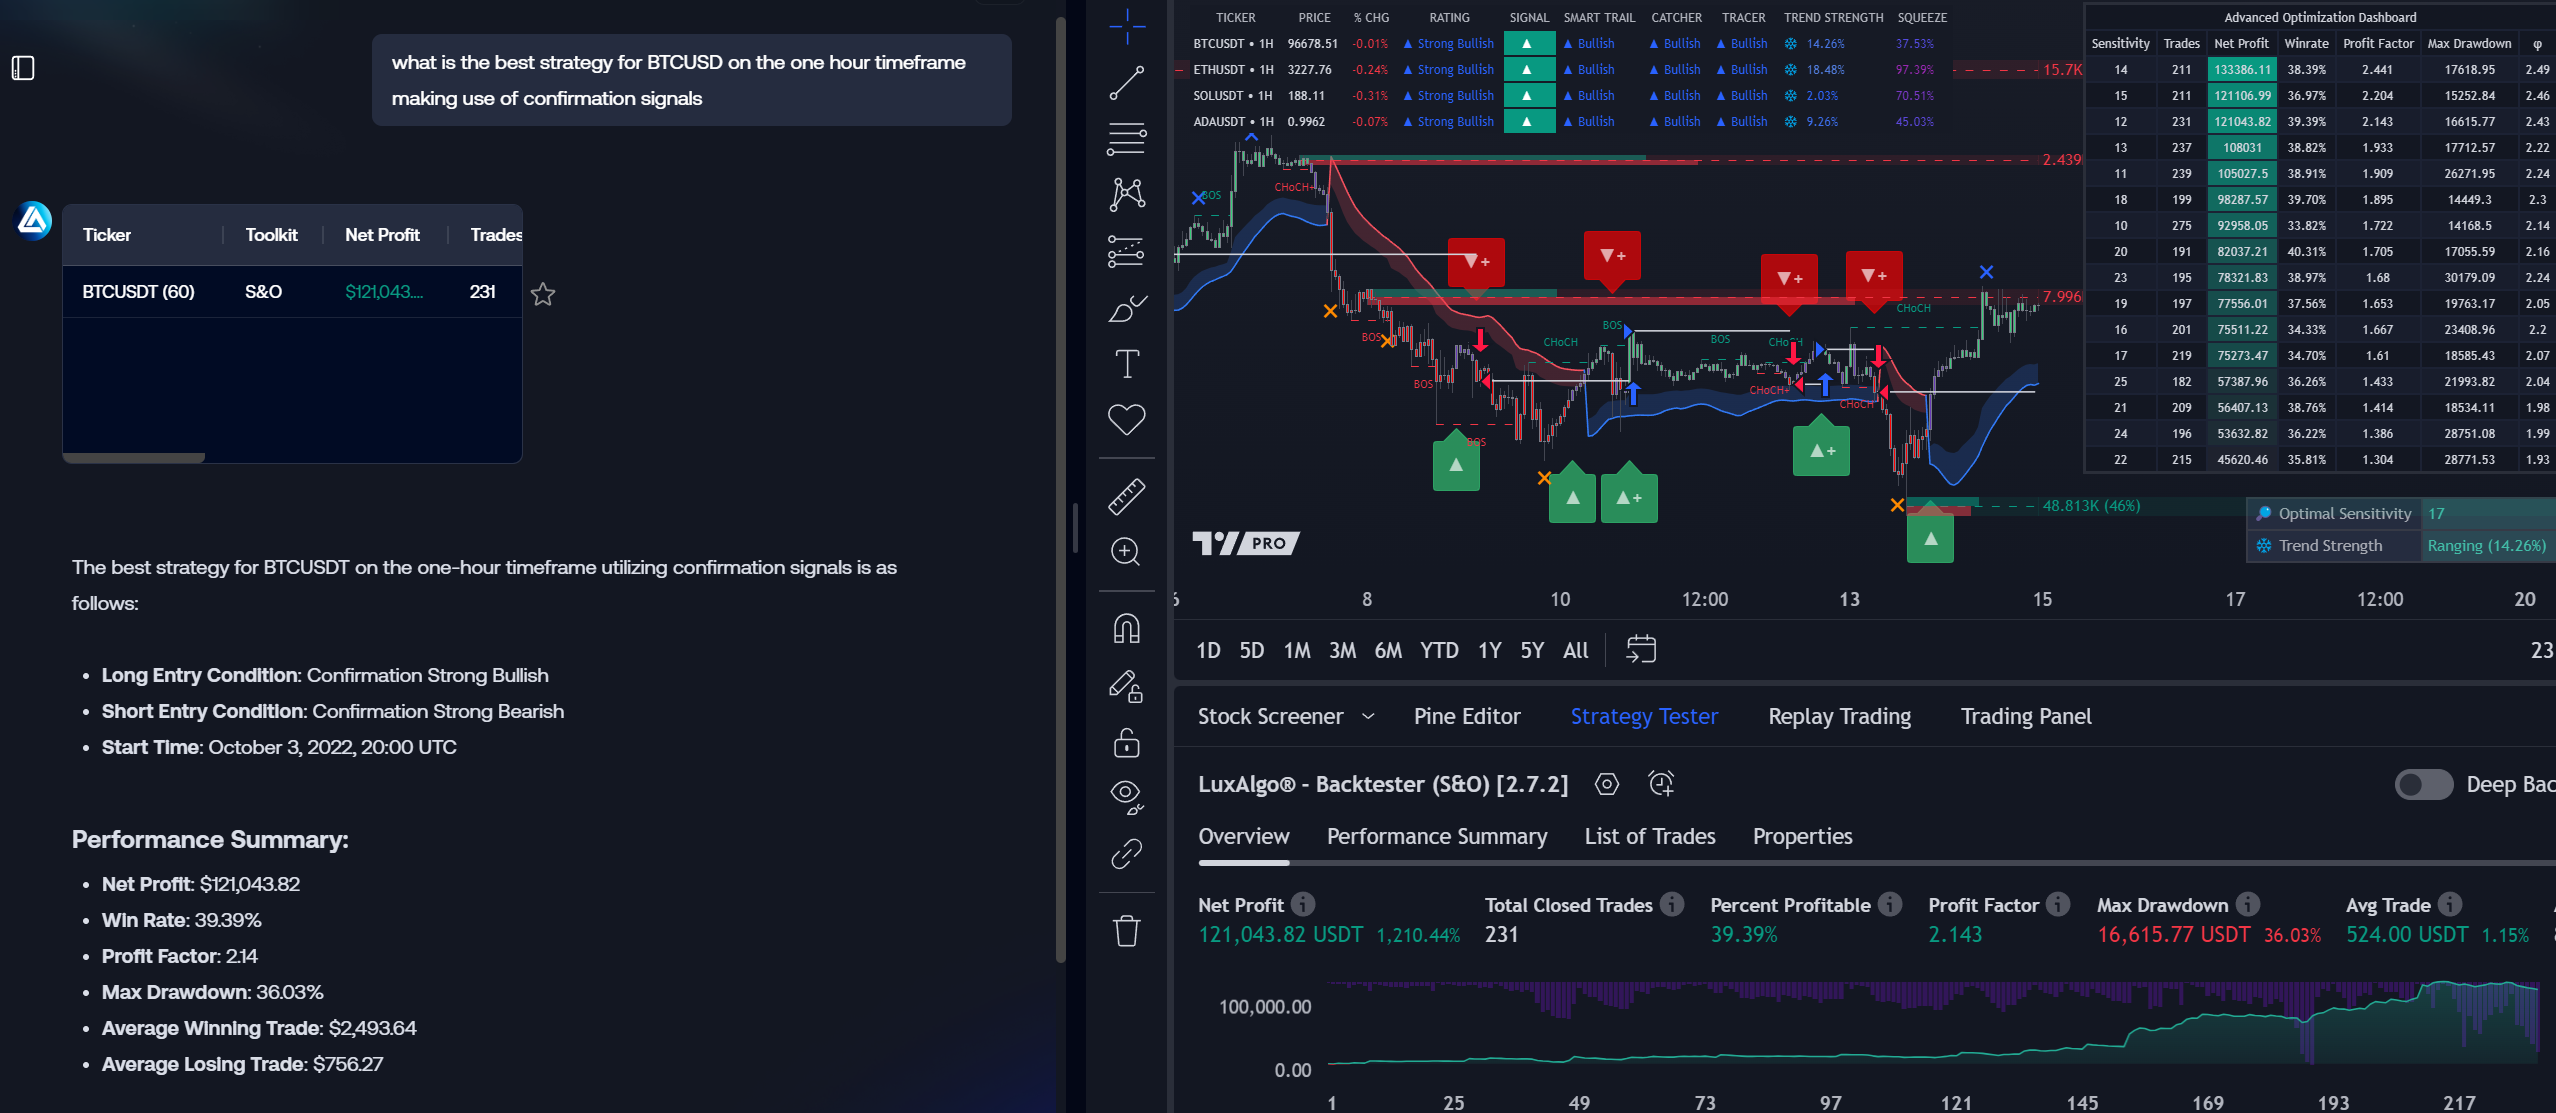
Users have access to a wide variety of useful data and visualisations to evaluate a strategy trough the backtest viewer.
By default the backtest viewer will display backtest information from the most recent fetched strategy in the conversation.
You can check backtest results from previously fetched strategies by simply clicking on the card holding the strategy
## Backtest Statistics [#backtest-statistics]
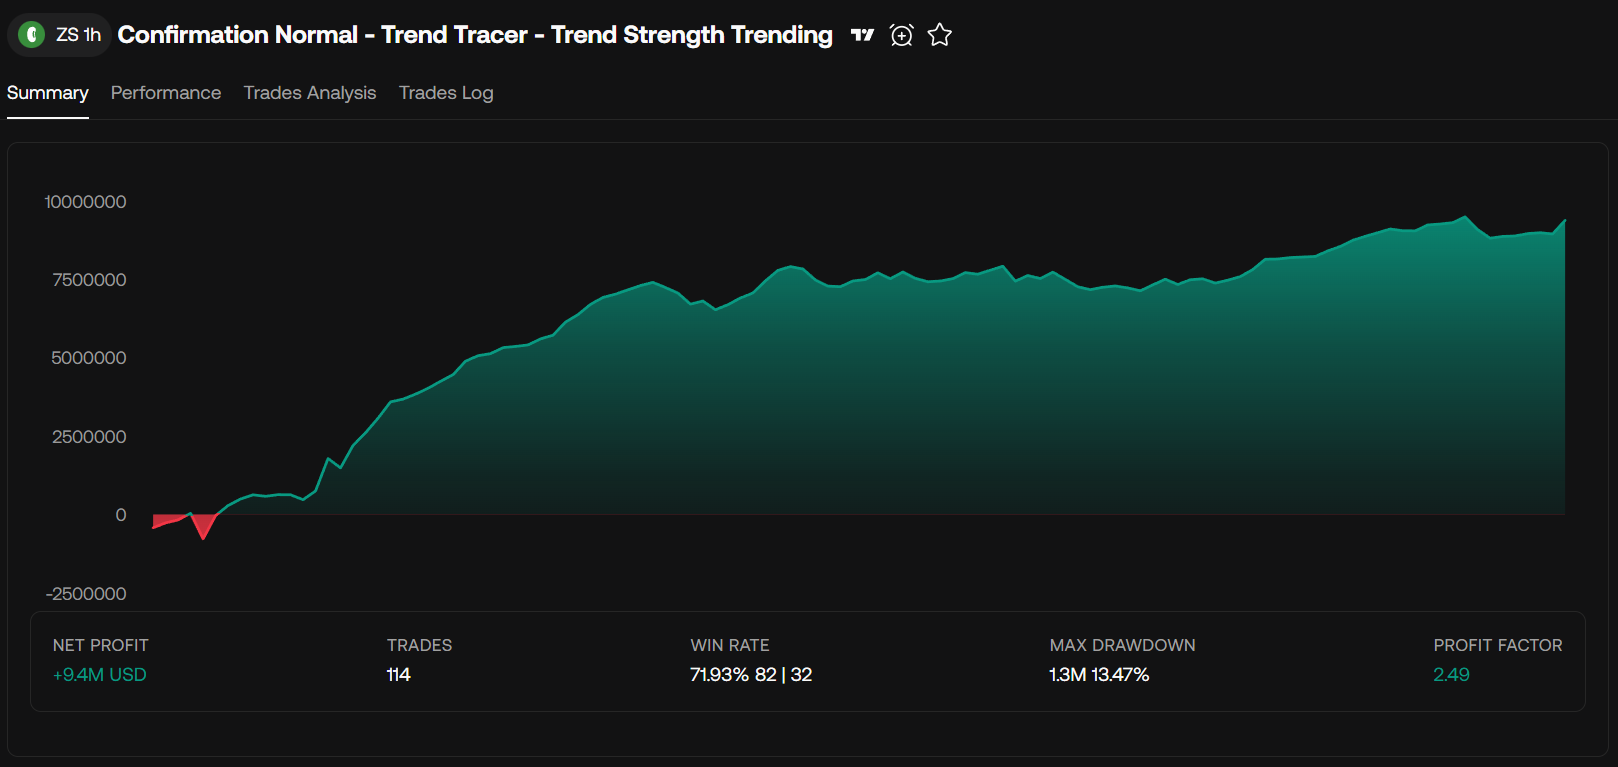
### Overview [#overview]
* Historical Net Profit
* Net Profit
* Trades
* Win Rate
* Winning Trades (left)
* Losing Trades (right)
* Max Drawdown
* Max Drawdown %
### Performance [#performance]
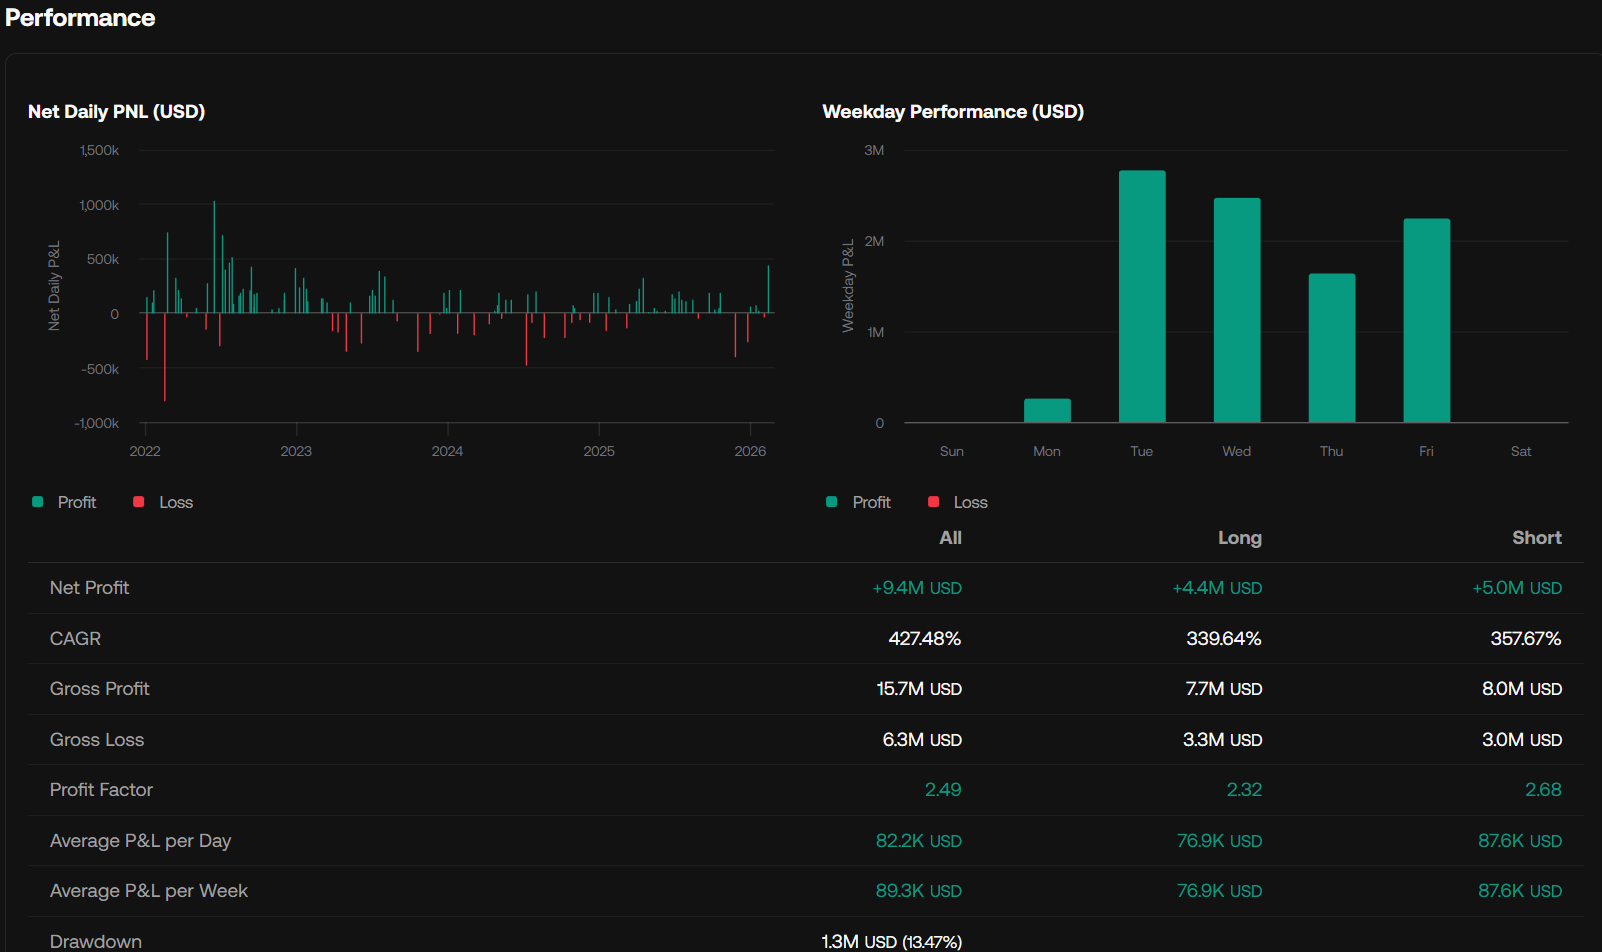
The **Performance** section includes two visualisations:
* Net Daily PNL: Net daily trades result (profit + loss)
* Weekday Performance: Sum of the profit and losses made during a specific day of the week
#### Table [#table]
A performance table is included listing statistics for all trades, only longs, and only shorts. The following statistics are returned:
*
Net Profit
*
CAGR (Compounded annualized growth rate)
*
Gross Profit
*
Gross Loss
*
Profit Factor
*
Average P&L per Day
*
Average P&L per Week
*
Drawdown
*
Drawdown Percent
### Trades Analysis [#trades-analysis]
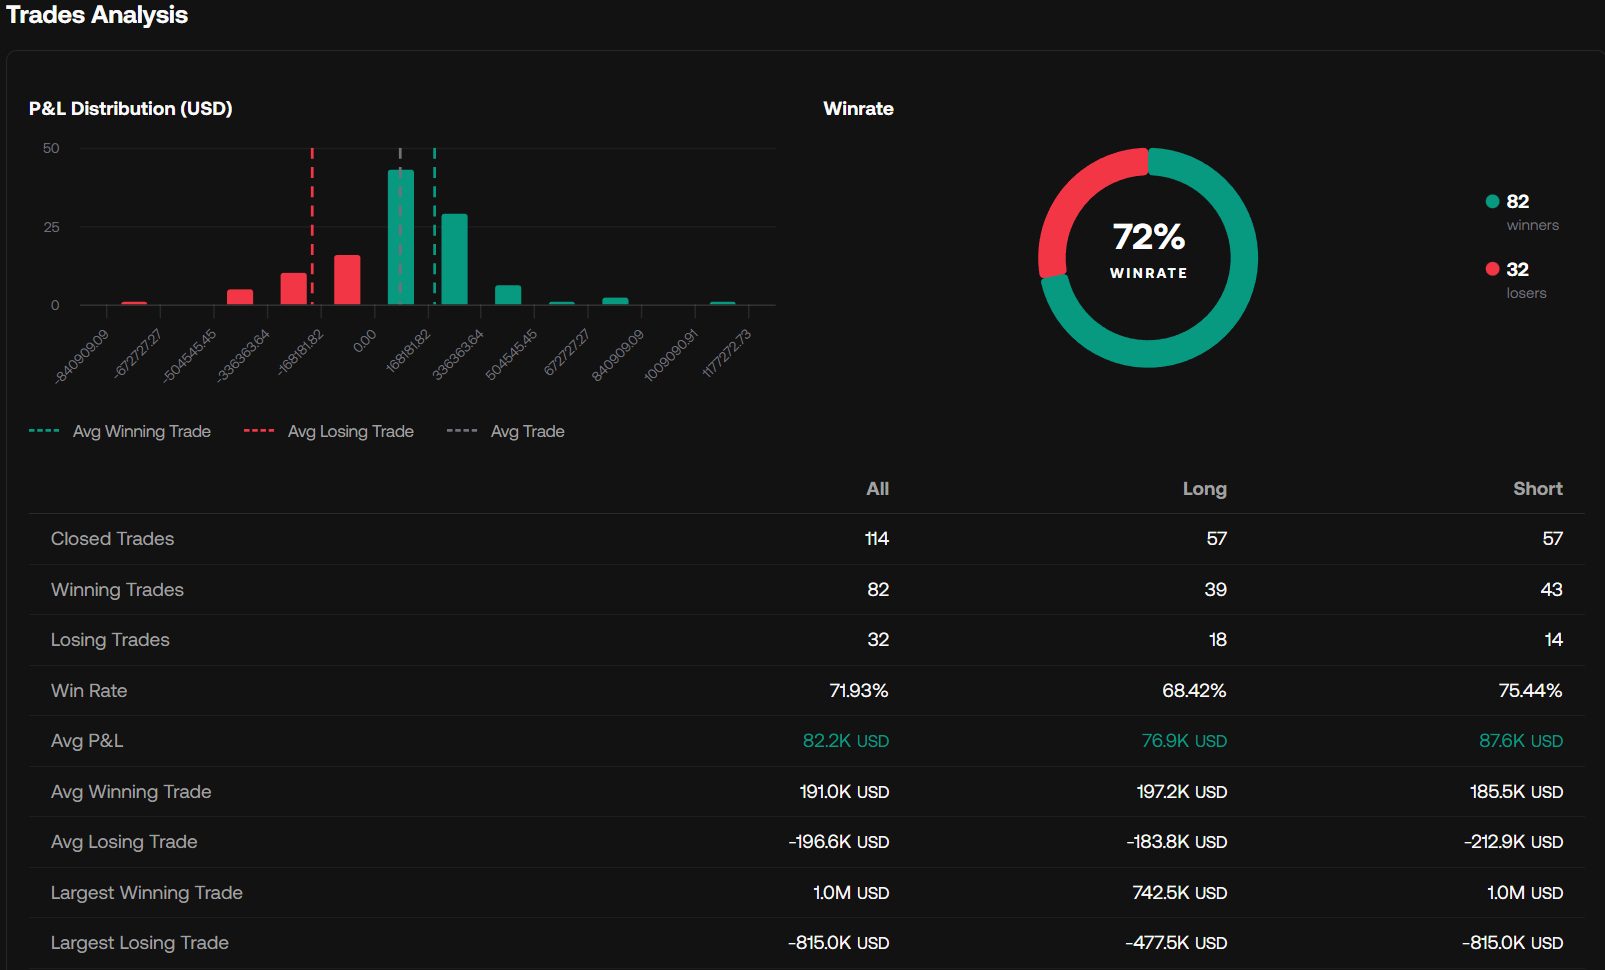
The **Trades Analysis** section includes two visualisations:
* P\&L Distribution: Distribution of trade profit and losses
* Winrate: Shows winrate, winning trades and losing trades
* Duration vs P\&L: Scatter plot showing trade duration (in bars) against the trade result
#### Table [#table-1]
A trades analysis table is included listing statistics for all trades, only longs, and only shorts. The following statistics are returned:
*
Closed Trades
*
Winning Trades
*
Losing Trades
*
Win Rate
*
Avg P&L
*
Avg Winning Trade
*
Avg Losing Trade
*
Largest Winning Trade
*
Largest Losing Trade
#### Duration [#duration]
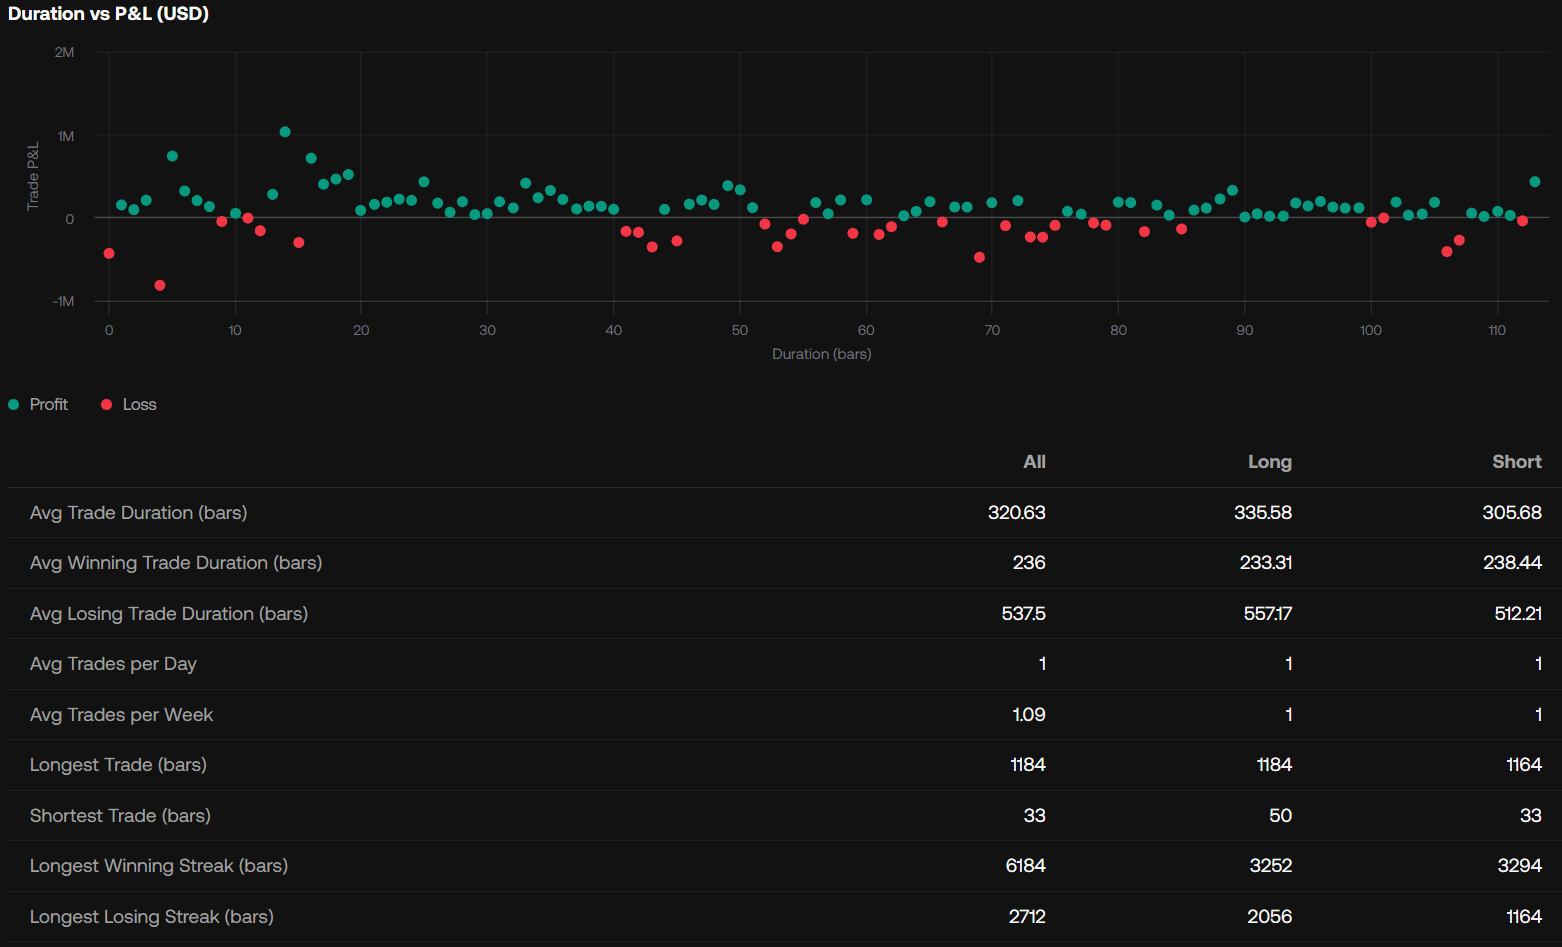
A duration table is included listing statistics for all trades, only longs, and only shorts. The following statistics are returned:
*
Avg Trade Duration (bars)
*
Avg Winning Trade Duration (bars)
*
Avg Losing Trade Duration (bars)
*
Avg Trades per Day
*
Avg Trades per Week
*
Longest Trade (bars)
*
Shortest Trade (bars)
*
Longest Winning Streak (bars)
*
Longest Losing Streak (bars)
## Trades Log [#trades-log]
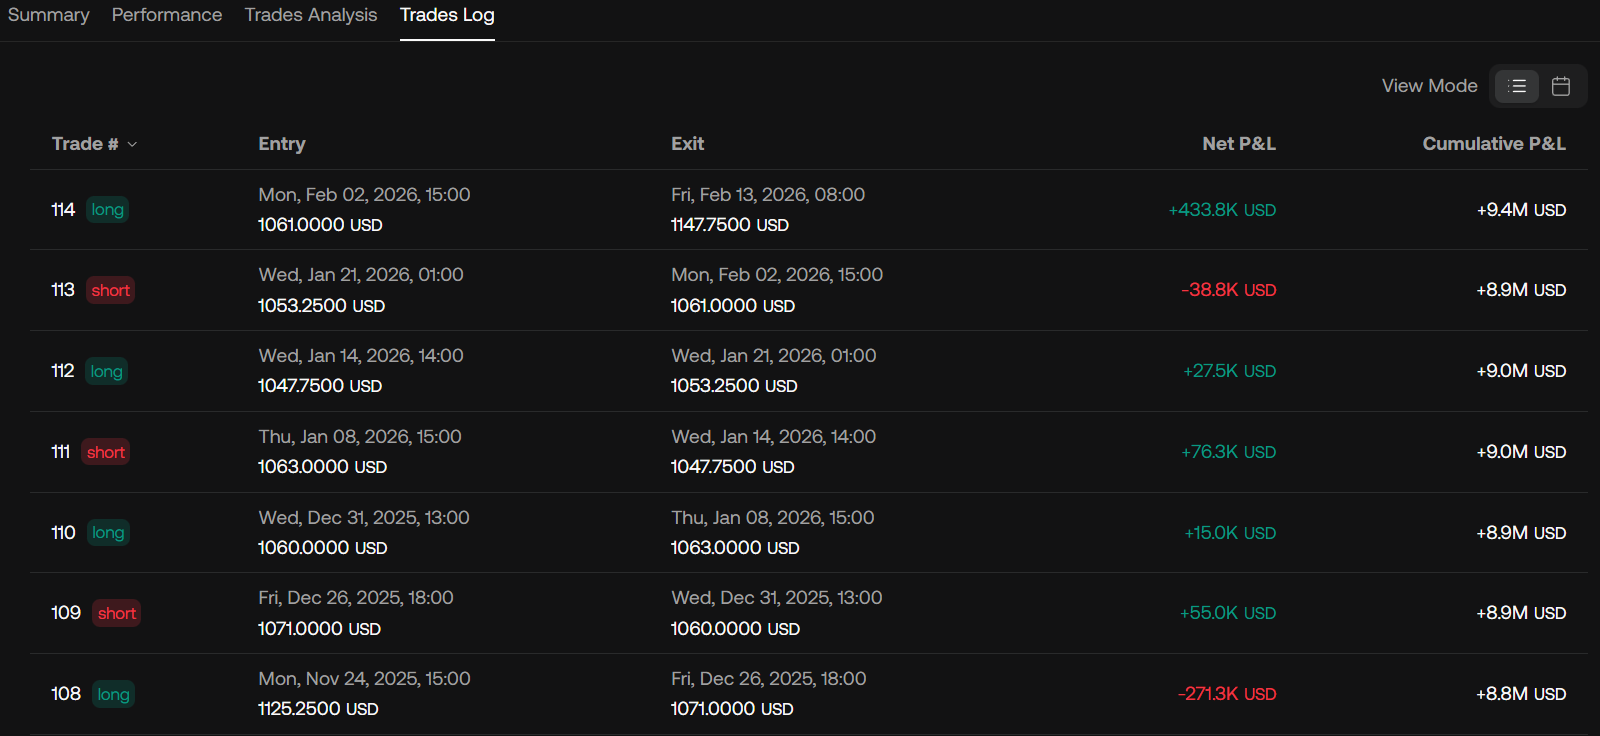
A trades log table is included showing each closed trade in chronological order, including the trade number, trade side, entry, exit, net P\&L, and the running cumulative P\&L after each trade.
Click on a column to sort it ascendingly or descendingly.
### Calendar View [#calendar-view]
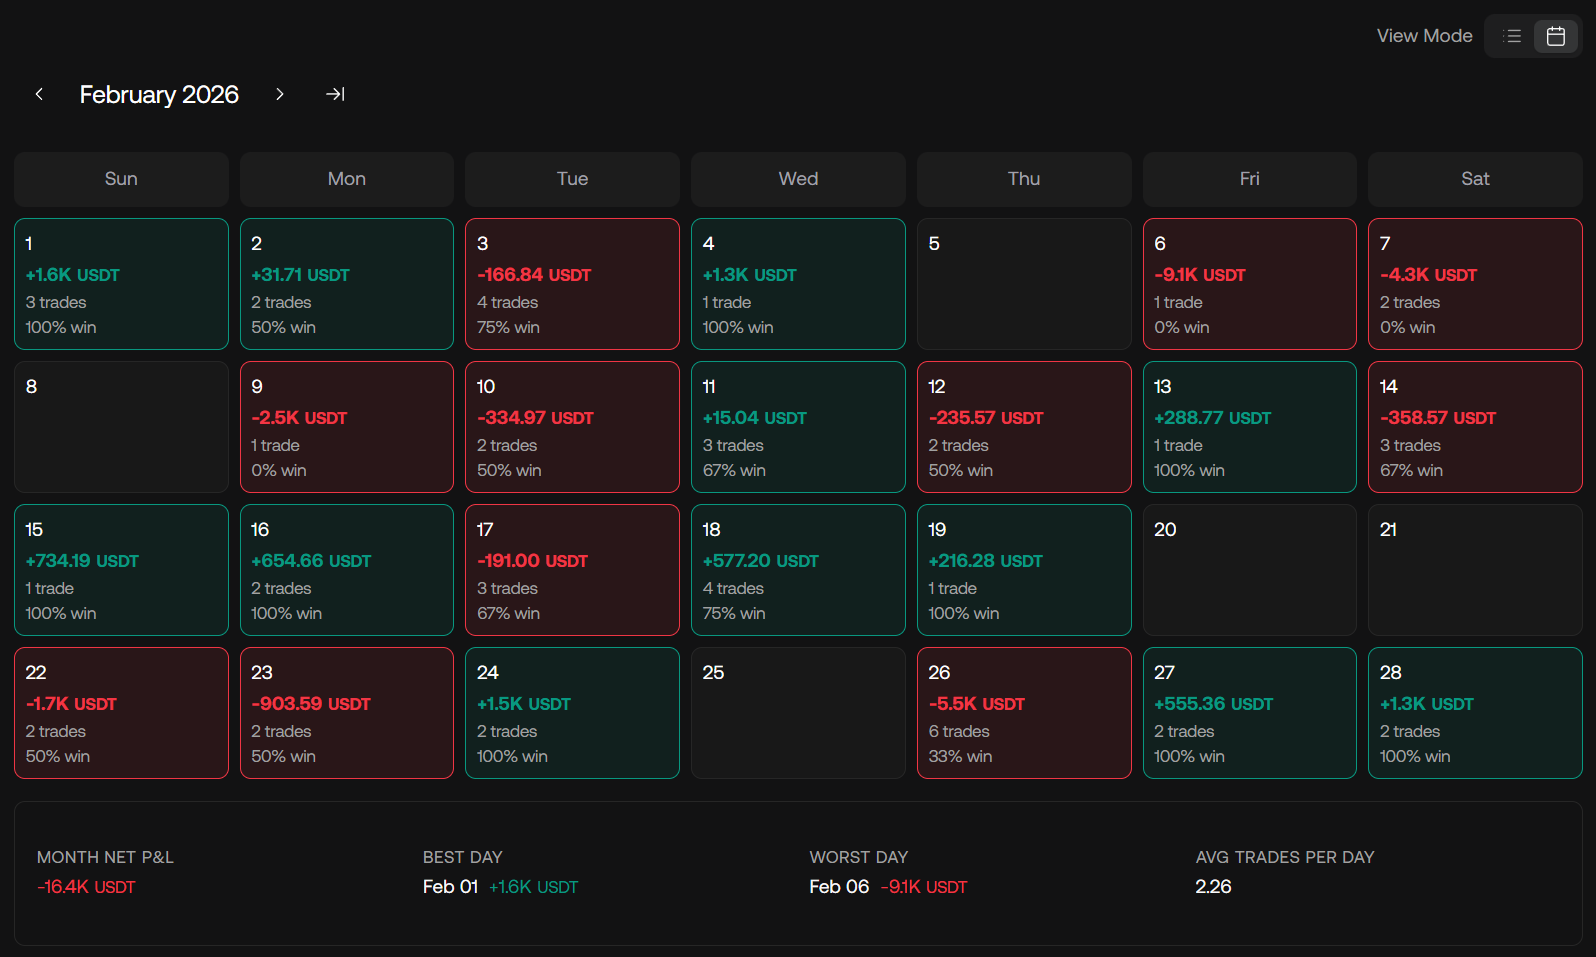
When the `View Mode` is switched to calendar view, trades are grouped by day in a monthly layout with month navigation at the top. Each day can show its net P\&L, number of trades, and win rate, while a summary below highlights the month net P\&L, best day, worst day, and average trades per day.
## Strategy Comparison View [#strategy-comparison-view]
When the Backtesting AI fetches multiple strategies at once, these will eb displayed in a comparison view, allowing for detailed comparisons.
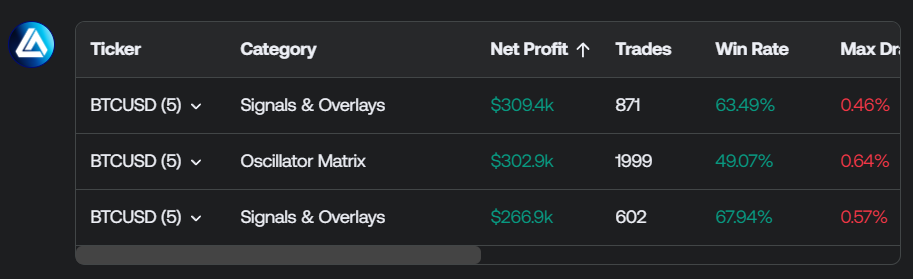
### Comparison Table [#comparison-table]
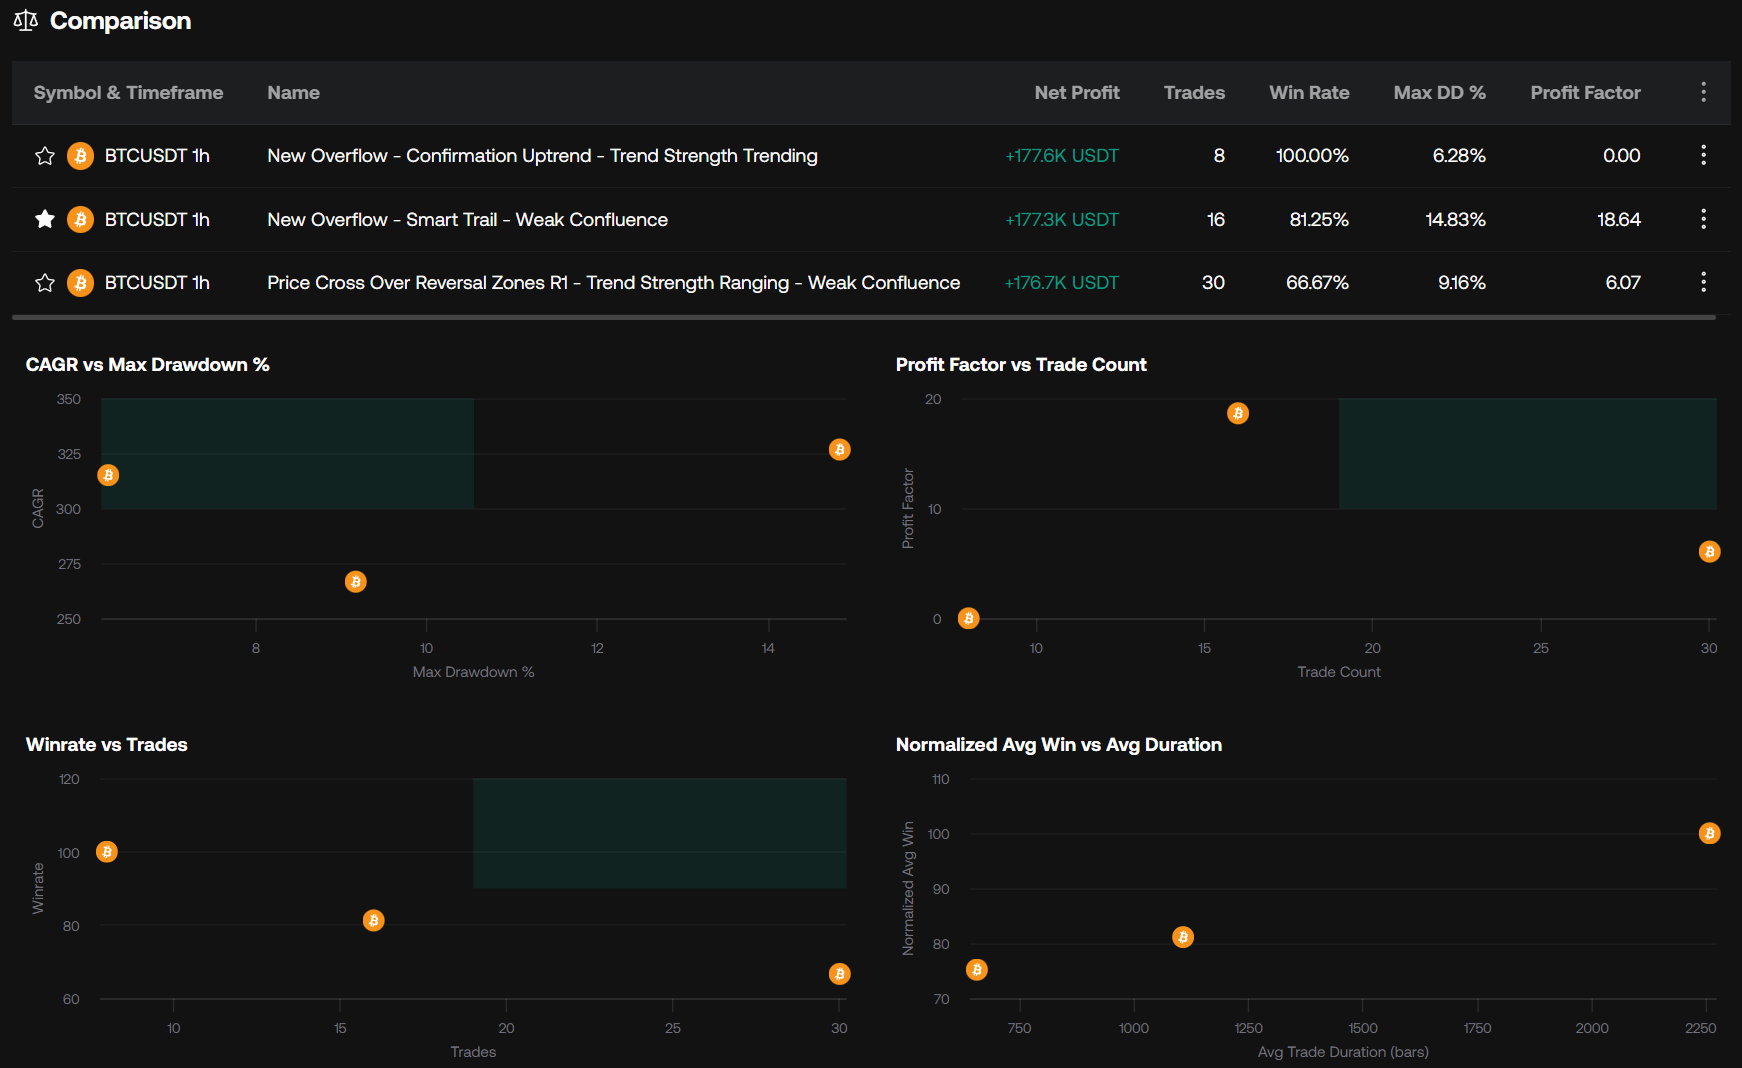
The comparison table displays each strategy side by side, including the symbol and timeframe, strategy name, net profit, trades, win rate, max DD %, and profit factor.
### Comparison Scatter Plots [#comparison-scatter-plots]
The comparison scatter plots help visualize how strategies relate across key metrics, with views such as CAGR vs Max Drawdown %, Profit Factor vs Trade Count, Winrate vs Trades, and Normalized Avg Win vs Avg Duration.
Each point represents a strategy, with strong performers being located in the quadrant in green.
Hovering over a strategy point in the graph shows a tooltip with the relevant strategy details.
# Fetching Information (/docs/ai-backtesting/fetching-information)
The AI Backtesting Assistant is able to fetch our product documentation to provide relevant information to you about the features used by a retrieved strategy or to simply help you learn more about our products.
The AI will automatically determine whether it requires fetching context from the documentation depending on the user query.
You can force the AI to fetch information from the documentation by telling it to fetch the documentation.
For example:
> Tell me more about confirmation signals, use the documentation
This can prevent the AI from giving partial information he might know from his existing context window.
## Detailed Strategy Descriptions Using Docs [#detailed-strategy-descriptions-using-docs]
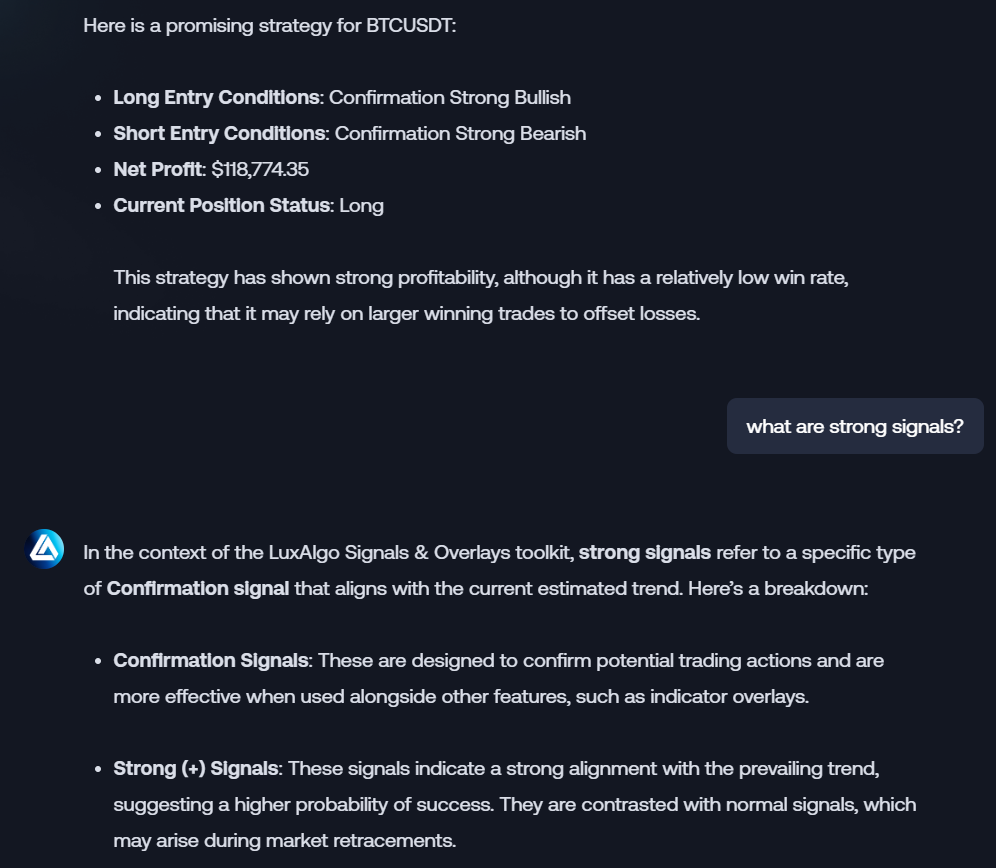
We can request for the AI to provide important context about the conditions returned by a trading strategy.
## Using Docs to Get Tailored Strategies [#using-docs-to-get-tailored-strategies]
By asking the AI to learn more about the LuxAlgo features from the documentation, we can effectively get unique trading strategies by simply mentioning trading styles.
For example, we can use the following prompt:
> From the documentation search for the best features for swing trading, then find a strategy using those features that provides good results on crypto on the hourly timeframe
# Fetching Strategies (/docs/ai-backtesting/fetching-strategies)
The primary role of the AI Backtesting Assistant is to help users find strategies quickly without having to manually iterate through various conditions, tickers, and timeframes on TradingView charts. Instead, users can simply ask the AI to look for the strategy that would best match the criteria they want.
The AI Backtesting Assistant has access to millions of unique strategies, each made using a wide variety of conditions.
This AI tool’s backtesting data & analytics are for informational purposes only and do not constitute financial advice or recommendations to buy or sell any financial product, including but not limited to securities, derivatives, cryptocurrencies, or other investment instruments.
This tool may contain errors, and past performance is not indicative of future results. Always conduct your own research and consult with a professional financial advisor.
LuxAlgo is not liable for any decisions made based on any information given. Read our [full disclaimer](https://www.luxalgo.com/legal/disclaimer/).
## Strategies Configuration [#strategies-configuration]
Strategies are evaluated using a maximum of the most recent 20.000 bars, with an initial capital of 10.000 base currency, without commissions/slippage, and using default settings for all toolkits features.
Unit position sizing is used across all tickers.
When a strategy enters a trade, any previous trade is closed. As such, it is not possible for two positions to be open at the same time.
Strategies do not make use of stop losses or take profits.
See the section below to learn more about the supported tickers, timeframes, and backtesting conditions.
### Schedule [#schedule]
In order to preserve ressources and avoid redundancy we run backtests three times a week:
* **Monday** 23:30 UTC
* **Wednesday** 23:30 UTC
* **Friday** 23:30 UTC
### Supported Tickers [#supported-tickers]
The following tickers are supported:
* AAPL
* AMD
* AMZN
* BABA
* CELH
* COIN
* CRWD
* DIS
* DUOL
* GME
* GOOG
* HOOD
* INTC
* MA
* META
* MSFT
* MSTR
* NFLX
* NKE
* NVDA
* ORCL
* PLTR
* PYPL
* RIVN
* SMCI
* SNOW
* SOFI
* TSLA
* UBER
* WMT
* ARKK
* IWM
* QQQ
* SPY
* VTI
* AAVEUSDT (Binance)
* ADAUSDT (Binance)
* ATOMUSDT (Binance)
* AVAXUSDT (Binance)
* BCHUSDT (Binance)
* BNBUSDT (Binance)
* BTCUSDT (Binance)
* DOGEUSDT (Binance)
* DOTUSDT (Binance)
* EOSUSDT (Binance)
* ETHUSDT (Binance)
* HBARUSDT (Binance)
* HYPEUSD (Kucoin)
* JUPUSDT (Binance)
* KASUSD (Kucoin)
* LINKUSDT (Binance)
* LTCUSDT (Binance)
* POLUSDT (Binance)
* SHIBUSDT (Binance)
* SOLUSDT (Binance)
* SUIUSDT (Binance)
* TONUSDT (Binance)
* TRXUSDT (Binance)
* UNIUSDT (Binance)
* VETUSDT (Binance)
* XLMUSDT (Binance)
* XRPUSDT (Binance)
* AUDJPY
* AUDUSD
* EURAUD
* EURGBP
* EURUSD
* EURJPY
* GBPAUD
* GBPJPY
* GBPUSD
* NZDUSD
* USDCAD
* USDCHF
* USDJPY
* XAGUSD
* XAUUSD
* UKOIL
* NQ
* ES
* RTY
* YM
* GC
* SI
* CL
* NG
* PL
* ZC
* ZW
* ZS
* 6E
* 6J
US equities (Stocks and ETFs) data is sourced from Cboe BZX and use regular trading hours.
Futures are based on continuous contracts and use electronic trading hours, without adjustment for contracts changes. Additionally, unlike TradingView, Futures contracts roll on the day prior to expiration.
### Supported Timeframes [#supported-timeframes]
5m, 15m, and 60m timeframes are supported.
## Strategy Entry and Exits Constructions [#strategy-entry-and-exits-constructions]
Strategy entry conditions can make use of multiple conditions from different toolkits together. We classify conditions as triggers and filters:
* Triggers: Triggers determine the initial conditions used by a strategy. These tend to be less persistent events on a chart, occurring for a single bar.
* Filters: Filters add precision to a strategy, potentially filtering out bad trades that would have been taken by simply using triggers. Filters tend to be more persistent, lasting for multiple bars on a chart.
Entry conditions contain a single trigger, and can contain up to two filters.
It is possible for a long/short entry condition to contain both bullish and bearish conditions
Long and short entry conditions mirror each other, that is, if the long entry condition uses a bullish condition, the short entry condition will use the same condition but bearish.
Example:
> * long: **Confirmation Any Bullish** and **Bullish Smart Trail** and **Bearish Trend Tracer**
> * short: **Confirmation Any Bearish** and **Bearish Smart Trail** and **Bullish Trend Tracer**
Finally, it is possible that some strategies using conditions from the Signals & Overlays® toolkit use exits condition to close trades.
### Signals & Overlays® Conditions [#signals--overlays-conditions]
***
#### Triggers [#triggers]
* Confirmation Any Bullish
* Confirmation Normal Bullish
* Confirmation Strong Bullish
* Contrarian Any Bullish
* Contrarian Normal Bullish
* Contrarian Strong Bullish
* Smart Trail Switch Bullish
* Price Cross Under Reversal Zones S1
* Trend Tracer Switch Bullish
* Trend Catcher Switch Bullish
* Neo Cloud Switch Bullish
* Confirmation Any Bearish
* Confirmation Normal Bearish
* Confirmation Strong Bearish
* Contrarian Any Bearish
* Contrarian Normal Bearish
* Contrarian Strong Bearish
* Smart Trail Switch Bearish
* Price Cross Over Reversal Zones R1
* Trend Tracer Switch Bearish
* Trend Catcher Switch Bearish
* Neo Cloud Switch Bearish
#### Filters [#filters]
* Confirmation Uptrend
* Contrarian Uptrend
* Bullish Smart Trail
* Price Below Reversal Zones S1
* Trend Tracer Bullish
* Trend Catcher Bullish
* Neo Cloud Bullish
* Confirmation Downtrend
* Contrarian Downtrend
* Bearish Smart Trail
* Price Above Reversal Zones R1
* Trend Tracer Bearish
* Trend Catcher Bearish
* Neo Cloud Bearish
* Trend Strength Trending
* Trend Strength Ranging
#### Exits [#exits]
Strategies using the Signals & Overlays® toolkit can make exit trades which are outlined below:
* Any strategy using Confirmation Signals can make use of builtin-exits labelled as "Confirmation Built-in Exits".
* Any strategy using Contrarian Signals can make use of builtin-exits labelled as "Contrarian Builtin Exits".
* Any strategy using Reversal Zones can make use of the exit condition "Price Cross R1/S1 Average", which will exit a trade when price crosses the average of the Reversal Zones.
### Price Action Concepts® Conditions [#price-action-concepts-conditions]
***
Currently only triggers are supported for the Price Action Concepts® toolkit.
#### Triggers [#triggers-1]
* Bullish CHoCH
* Bullish BOS
* Bullish OB Entered
* Bullish OB Exited
* New Bullish FVG
* Bearish FVG Mitigated
* New Bullish Opening Gap
* Bearish Opening Gap Mitigated
* New Bullish Volume Imbalance
* Bearish Volume Imbalance Mitigated
* Bullish Liquidity Grab
* Bearish Trendline Break
* Bearish CHoCH
* Bearish BOS
* Bearish OB Entered
* Bearish OB Exited
* New Bearish FVG
* Bullish FVG Mitigated
* New Bearish Opening Gap
* Bullish Opening Gap Mitigated
* New Bearish Volume Imbalance
* Bullish Volume Imbalance Mitigated
* Bearish Liquidity Grab
* Bullish Trendline Break
### Oscillator Matrix® Conditions [#oscillator-matrix-conditions]
***
#### Triggers [#triggers-2]
* New Bullish Overflow
* Money Flow Crossing Over 50
* HyperWave Oversold Bullish Signal
* HyperWave Crossing Over 80
* HyperWave Crossing Over 50
* Reversal Any Up
* New HyperWave Bullish Divergences
* New Bearish Overflow
* Money Flow Crossing Under 50
* HyperWave Overbought Bearish Signal
* HyperWave Crossing Under 20
* HyperWave Crossing Under 50
* Reversal Any Down
* New HyperWave Bearish Divergences
#### Filters [#filters-1]
* Bullish Overflow
* Money Flow Above 50
* HyperWave Above 80
* HyperWave Above 50
* Strong Bullish Confluence
* Weak Bullish Confluence
* Bearish Overflow
* Money Flow Below 50
* HyperWave Below 20
* HyperWave Below 50
* Strong Bearish Confluence
* Weak Bearish Confluence
## How To Fetch Strategies [#how-to-fetch-strategies]
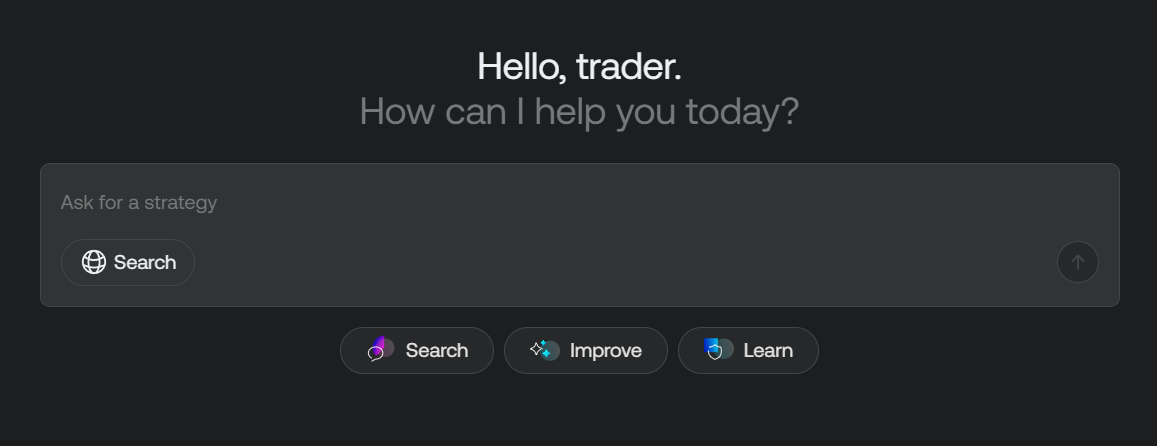
Interacting with the AI Backtesting Assistant is straightforward. All users need to do is type a prompt in the chat box located at the bottom of their screen.
Here are examples of prompts that will trigger the AI Backtesting Assistant to retrieve a trading strategy:
* What is the best performing strategy across all crypto tickers on the 5-minute timeframe?
* Give me three strategies using fair value gaps that have a winrate above 80%.
* Find a strategy with above average net profit but below average drawdown.
Users can also click on one of the suggested prompts in the search group located above the input prompt.
The AI can access the following backtesting results for strategies:
* Net Profit
* Max Net Profit
* Closed Trades
* Winning Trades
* Losing Trades
* Winrate
* Gross Profit
* Gross Loss
* Profit Factor
* Max Drawdown
* Max Drawdown Percent
* Average Trade
* Average Winning Trade
* Average Losing Trade
Due to calculations being sensitive to data differences, our Drawdowns calculations are based on realized profits/losses, which is not the case on TradingView, this can explain why certain differences can be observed.
These results will be returned in a component in the chat.
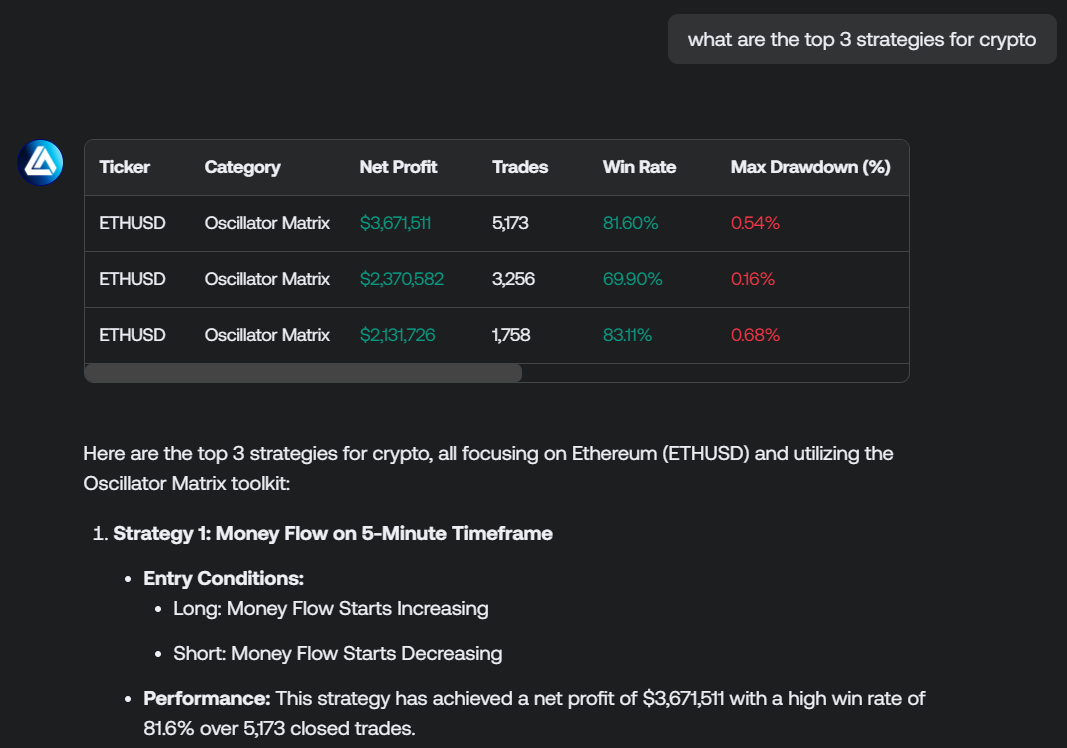
If multiple strategies are returned, they will all be located within a table.
A maximum of 3 strategies can be returned in a table at once, while a maximum of three strategies can be returned from a single fetching operation.
If the AI needs to fetch more than 3 strategies it will fetch strategies sequentially.
The AI can also access to the following information from a strategy:
* Strategy begins at: When the strategy started being evaluated
* Strategy current position: Long, short, or flat if no positions are currently open
### Fetch Statistics Across The Entire Strategy Population [#fetch-statistics-across-the-entire-strategy-population]
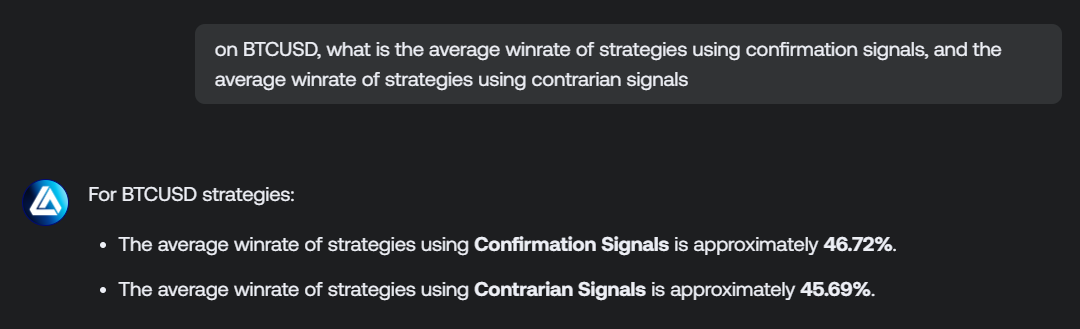
The AI can get general statistics and data across the whole population of strategies it has access to.
Example of prompts doing this are:
* What is the total net profit of all bitcoin strategies you have?
* On BTCUSD, are strategies using normal Confirmation signals better than the ones using strong Confirmation signals overall?
* What is total net profit of profitable strategies across stocks?
This can be useful to get big picture information about strategies.
Do note that such prompts can lead to high wait time for the results.
### Analyzing strategy trades [#analyzing-strategy-trades]
A returned strategy by the AI Backtesting Assistant contains a list of trades, each having information on its side (long / short), entry time and price, closing time and price, and P\&L result.
The AI Backtesting Assistant may filter trades by their index, trade side, result (win / loss), holding time (in minutes), P\&L, opening and closing time. Then an operation may be applied to a specific trade information from the filtered results.
Available capabilities from the trade analysis include:
* Trade filtering by index, trade side, result (win / loss), holding time (in minutes), P\&L, opening and closing time
* Operations on filtered subset such as average, median, count, sum, percentage
* Winning/Losing streak analysis
Example of typical questions one could ask related to trades of a strategy may include:
* Which trade has been the most/least profitable one?
* What is the entry and exit price price of most profitable long trade?
* What is the average trade duration of winning trades?
* What is the average profit/loss of trades with a duration above 50 minutes?
* How many winning trades occurred after 14 Jan 2025?
* What is the percentage of trades amongst the first 50 ones that are winning trades?
* What is the losing streak length before the last win?
* What is the average winning streak length?
* How many trades have a profit superior to the average winning trade?
## Reproducing a Strategy on TradingView [#reproducing-a-strategy-on-tradingview]
Once you get a strategy you like, you may be inclined to add it to your chart to visualize it and further optimize its results on TradingView.
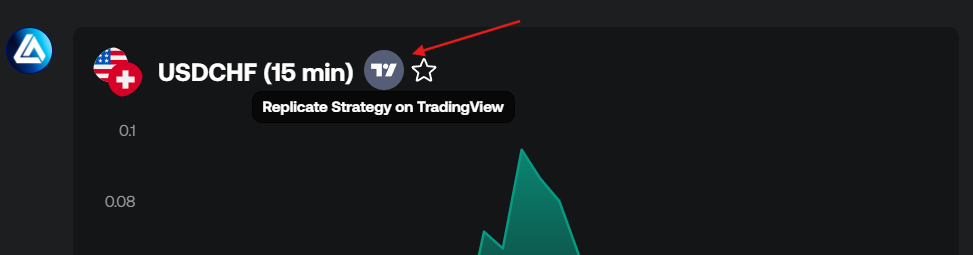
To do so, simply click on the TradingView logo located near the ticker symbol for the single strategy component, and to the right of a hovered row on a table containing strategies.
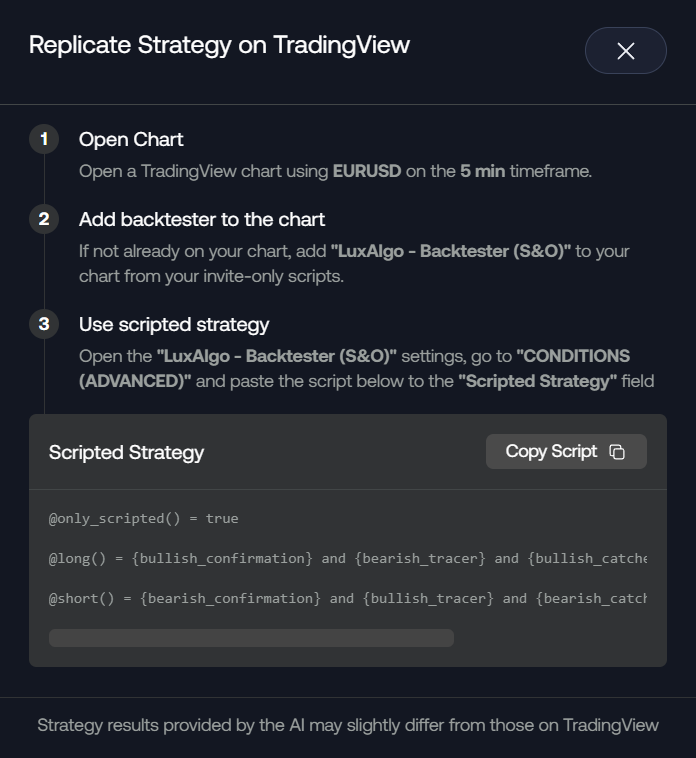
This will open a dialog box containing all the steps required to get the strategy on TradingView, as well as the scripted strategy which you must copy and paste to the relevant backtester.
A strategy using multiple conditions from at least two toolkits will require using LUCID connectors, learn more about LUCID connectors [here](/docs/ai-backtesting/backtesters/strategy-scripting/lucid-connectors).
If replicating a strategy involves making use of LUCID conectors, **make sure you enable the relevant features**, for example, if a strategy using the **Trend Catcher** requires using the LUCID connector of the **Signals & Overlays** toolkit, make sure the Trend Catcher overlay is enabled in the toolkit settings.
We compute strategies using data that might different from the one on TradingView, which can limit the reproducibility of strategies returned by the AI.
Some users might not be able to reproduce exact strategy results due to the limitation on how much data certain users can access.
## Saving Strategies [#saving-strategies]
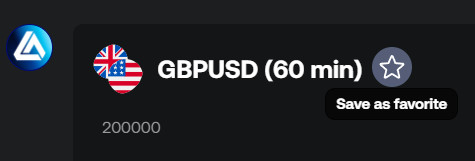
Strategies can be saved in the sidebar by clicking on the star icon located near the ticker symbol for the single strategy component, and to the right of a hovered row on a table containing strategies.
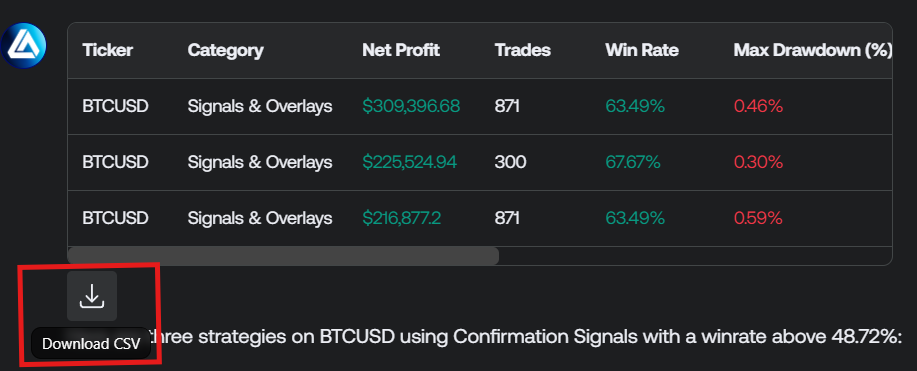
Additionally, strategies returned in a table can be exported as a CSV file.
## Prompting Tips [#prompting-tips]
The AI can make mistakes when fetching strategies, as this is a very complex process depending on the user query.
We will always aim to improve the AI Backtesting Assistant over time; however, the following tips can help you get the most from our AI.
### Make Detailed Queries [#make-detailed-queries]
Make sure to detail every aspect of the strategy you want to fetch if you have a precise one in mind, for example:
| Original | Improved |
| ------------------------------------------------------------ | ---------------------------------------------------------------------------------------------------------------------------- |
| Fetch a strategy that uses Confirmation Signals | Fetch a strategy that only uses Confirmation Signals and no other conditions |
| I want a PAC strategy that goes long on a new FVG, and CHoCH | I want a PAC strategy that goes long when:
- Step 1: a new bullish FVG occur - Step 2: a bullish CHoCH occur |
| I want the best strategy | I want the strategy with the highest net profit on BTCUSD 5 minute |
Context and details will help the AI avoid making guesses about your query.
### Encourage the AI to Improve [#encourage-the-ai-to-improve]
The AI Backtesting Assistant can be fairly self-aware if a fetched strategy doesn't meet a user criteria, and will then retry.
But if the AI response is clearly mistaken, then it can be good to let it know using a prompt encouraging re-evaluation of the fetching process:
> The strategy your returned is not the one I want. Correct the issue in your fetching process and retry to fetch the strategy in accordance with my query.
### Split Complex Queries Into Multiple Tasks [#split-complex-queries-into-multiple-tasks]
The AI will be more prone to mistakes if the query is complex, as such, it is best to do follow-up messages asking about the details of a strategy rather than asking the AI to give those alongside other information.
For example:
> Return a good strategy on BTCUSD, alongside the average net profit of all strategies on BTCUSD that use Confirmation signals, then tell me what the highest winrate strategy is, using the same conditions as the first one
The AI Backtesting Assistant might provide more relevant answers if we let context accumulate by splitting and re-ordering our initial query into multiple ones:
Return a good strategy on BTCUSD
Find the strategy with the highest winrate that use the same exact entry conditions returned previously
Return the average net profit of all strategies on BTCUSD that use Confirmation Signals.
# Introduction (/docs/ai-backtesting/introduction)
Access the AI Backtesting Assistant here.
The [AI Backtesting Assistant](https://www.luxalgo.com/backtesting/chat/) is a conversational AI leveraging a variety of state of the arts large language models to scan and retrieve a wide variety of strategies built using core features from our Signals & Overlays®, Price Action Concepts®, and Oscillator Matrix® toolkits. It also can give contextual information about our products & markets.
The AI Backtesting Assistant is only available for Ultimate users.
To learn more about the capabilities of the AI Backtesting Assistant, see the pages below:
Fetch strategies simply by using natural language
View detailed strategies backtset results
Learn more about LuxAlgo toolkits using our assistant
Common issues and solutions
## FAQ [#faq]
All users can access AI Backtesting [here](https://www.luxalgo.com/chat). Users with Premium and Ultimate plans can benefit from higher usage limits.
Credits is the currency system used to control the usage amount a user has with our AI products. The credit balance of an user is shared across both AI Backtesting platform and Quant, our Pine Script® coding agent.
User credits reset every first of the month.
The AI Backtesting Assistant has access to the backtesting results of over 10 million trading strategies using core features from the Signals & Overlays®, Price Action Concepts®, and Oscillator Matrix® toolkits.
Strategies are evaluated for some of the most traded tickers across 3 timeframes: 5 minute, 15 minute, and 1 hour.
**Included ticker symbols by market:**
* AAPL
* AMD
* AMZN
* BABA
* CELH
* COIN
* CRWD
* DIS
* DUOL
* GME
* GOOG
* HOOD
* INTC
* MA
* META
* MSFT
* MSTR
* NFLX
* NKE
* NVDA
* ORCL
* PLTR
* PYPL
* RIVN
* SMCI
* SNOW
* SOFI
* TSLA
* UBER
* WMT
* ARKK
* IWM
* QQQ
* SPY
* VTI
* AAVEUSDT (Binance)
* ADAUSDT (Binance)
* ATOMUSDT (Binance)
* AVAXUSDT (Binance)
* BCHUSDT (Binance)
* BNBUSDT (Binance)
* BTCUSDT (Binance)
* DOGEUSDT (Binance)
* DOTUSDT (Binance)
* EOSUSDT (Binance)
* ETHUSDT (Binance)
* HBARUSDT (Binance)
* HYPEUSDT (Kucoin)
* JUPUSDT (Binance)
* KASUSDT (Kucoin)
* LINKUSDT (Binance)
* LTCUSDT (Binance)
* SHIBUSDT (Binance)
* POLUSDT (Binance)
* SOLUSDT (Binance)
* SUIUSDT (Binance)
* TONUSDT (Binance)
* TRXUSDT (Binance)
* UNIUSDT (Binance)
* VETUSDT (Binance)
* XLMUSDT (Binance)
* XRPUSDT (Binance)
* AUDJPY
* AUDUSD
* EURAUD
* EURGBP
* EURUSD
* EURJPY
* GBPAUD
* GBPJPY
* GBPUSD
* NZDUSD
* USDCAD
* USDCHF
* USDJPY
* XAGUSD
* XAUUSD
* UKOIL
* NQ
* ES
* RTY
* YM
* GC
* SI
* CL
* NG
* PL
* ZC
* ZW
* ZS
* 6E
* 6J
US equities (Stocks and ETFs) use regular trading hours and are based on the Cboe BZX exchange.
Futures are based on continuous contracts and use electronic trading hours, without adjustment for contracts changes. Contract roll is performed taking into account a combination of volume and openinterest.
Unlike TradingView, Futures contracts roll on the day prior to expiration.
Yes, users have a token balance that determines how much they can use the AI, however, it is highly unlikely you will ever reach the end of your token balance. It resets at the first of each month and once it reaches 0, the AI will no longer be available until the balance is refreshed.
Yes, strategy results provided by the AI can be exported as a CSV file for easy access and analysis.
Backtests are performed on all the tickers on Monday, Wednesday, and Friday at 23:30 UTC, using our own internal system on data from quality third party providers, ensuring users can reproduce the results given by the AI on TradingView if needed.
Strategies starts being evaluated at a specific date, which can be returned by the AI assistant.
No, currently backtests are performed on Monday, Wednesday, and Friday at 23:30 UTC for all strategies. As a result you might potentially see some more recent trades once you replicate a given strategy on TradingView.
We are actively working on updating strategies continuously.
Due to the potential difference in market data and processes it is possible for backtest results to slightly differ from what you might observe on TradingView.
## Disclaimer [#disclaimer]
This AI tool’s backtesting data & analytics are for informational purposes only and do not constitute financial advice or recommendations to buy or sell any financial product, including but not limited to securities, derivatives, cryptocurrencies, or other investment instruments.
This tool may contain errors, and past performance is not indicative of future results. Always conduct your own research and consult with a professional financial advisor.
LuxAlgo is not liable for any decisions made based on any information given. Read our [full disclaimer](https://www.luxalgo.com/legal/disclaimer/).
# Troubleshooting (/docs/ai-backtesting/troubleshooting)
The AI Backtesting Assistant is an early feature, and such might face several limitations described in this page.
Don't hesitate to send your feedback at [support@luxalgo.com](mailto:support@luxalgo.com) or in our [Discord server](https://discord.com/invite/LUX).
## I can't use the AI Backtesting Assistant [#i-cant-use-the-ai-backtesting-assistant]
The AI Backtesting assistant is only available for our Ultimate users. Users without a plan can purchase one [here](https://www.luxalgo.com/pricing/).
Users subscribed to the Premium plan will need to upgrade to the Ultimate plan to use the AI Backtesting Assistant.
## The AI is not responding to my message [#the-ai-is-not-responding-to-my-message]
To ensure fair and consistent access to the AI Backtesting Assistant, users are subject to rate limits defined in terms of concurrent requests.
If the maximum number of concurrent requests is exceeded, messages sent to the AI Backtesting Assistant will take longer to get answered.
Waiting for some time will generally resolve the issue.
## Reached maximum monthly usage for the AI Backtesting Assistant [#reached-maximum-monthly-usage-for-the-ai-backtesting-assistant]
Because of the amount of compute necessary to run our LLM and to prevent potential abuse, users have a limited usage of the AI Backtesting Assistant.
The amount of usage is determined by the amount of content returned by the AI, as such large messages can consume more usage than more frequent small messages.
The monthly usage is reset every first of the month.
In order to significantly save on usage you can refresh the page to clear the chat, as generating new messages on large conversations will drain usage more quickly.
You can also use a cheaper model to reduce usage, the cost of a model is indicated by the amount of $ signs present in the model selection.
## I am seeing very different strategy results on Tradingview [#i-am-seeing-very-different-strategy-results-on-tradingview]
We compute strategies using data that might be slightly different on TradingView.
The amount of data you have access to can also affect its ability to reproduce strategies, as strategies are backtested using 20.000 bars.
## Specific models do not work [#specific-models-do-not-work]
Some models can be subject to geo-restriction and as such might not be usable by specific users.
We always include one model that is not subject to this restriction, such as Qwen models.
# Creating Alerts (/docs/ai-strategy-alerts/creating-alerts)
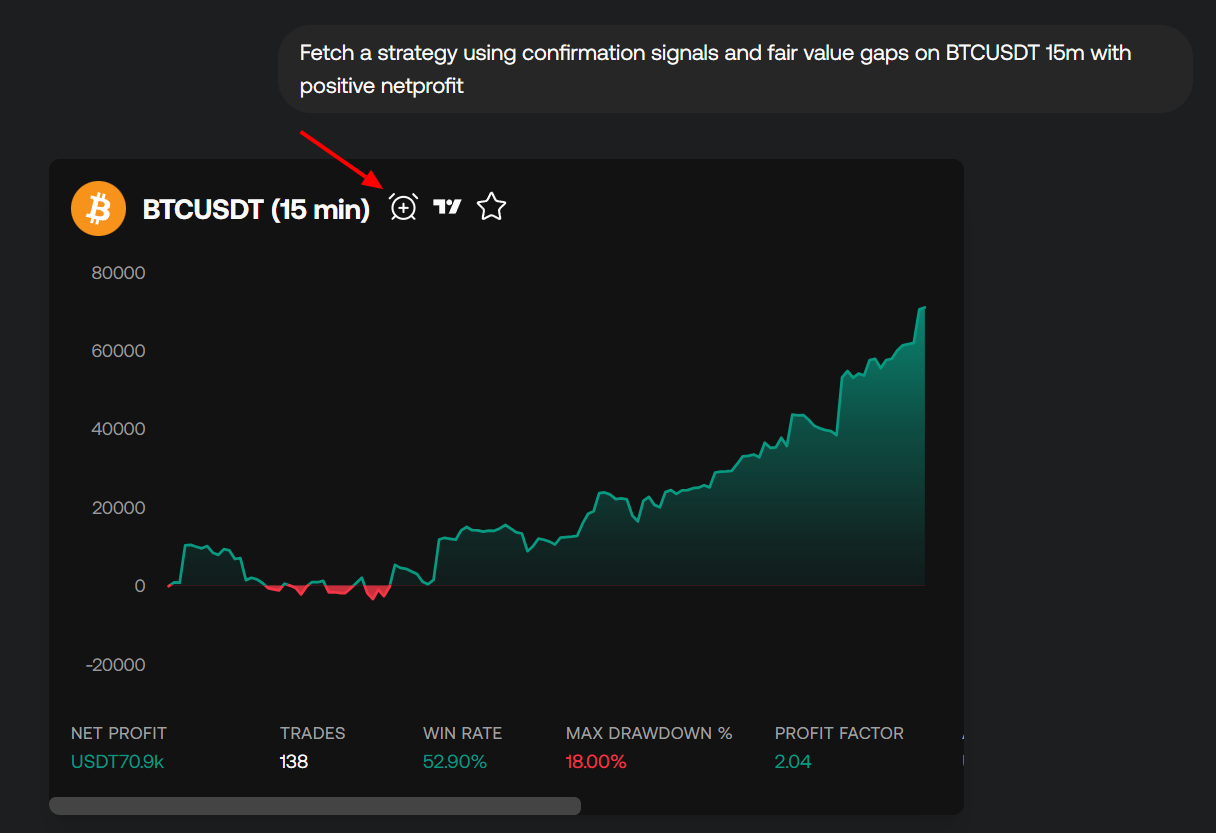
Users can easily create alerts from strategies by requesting them to our [AI Assistant](/docs/ai-backtesting/introduction).
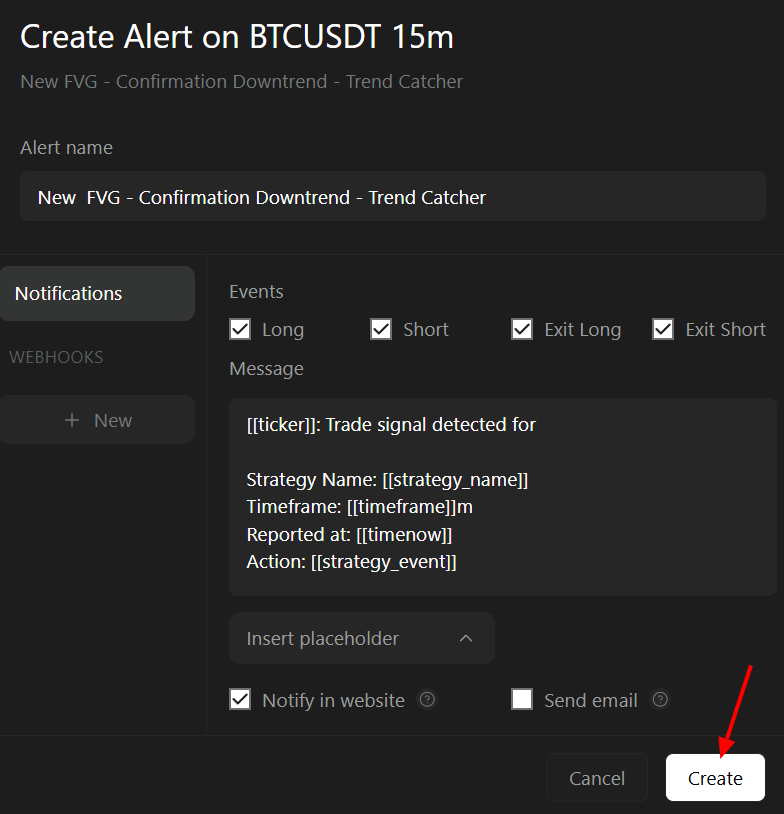
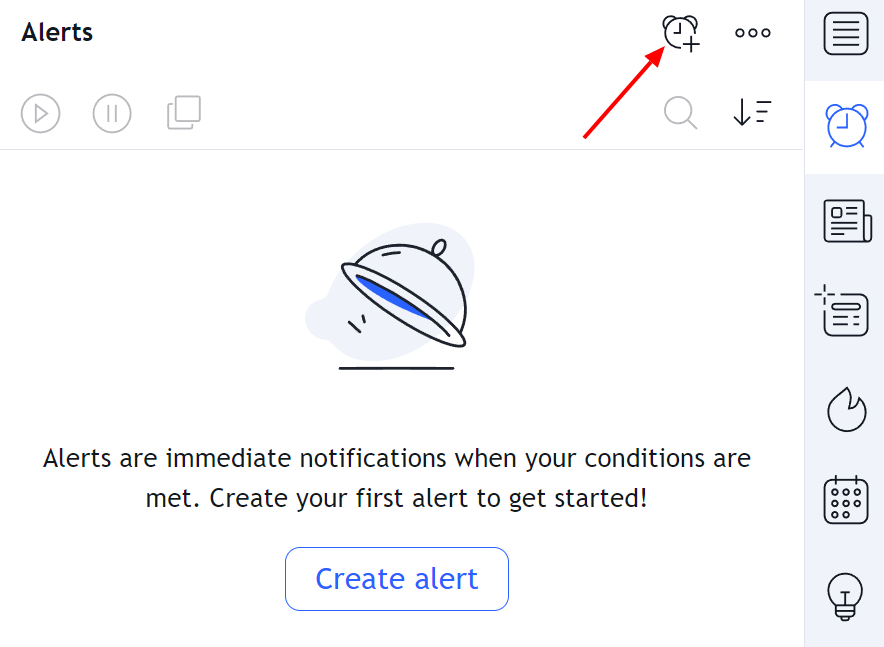
Once a strategy is fetched the user can create an alert from it by clicking on the alarm icon. This will open up a menu allowing to customize the alert. Once done the user can create the alert by clicking on the button "Create".
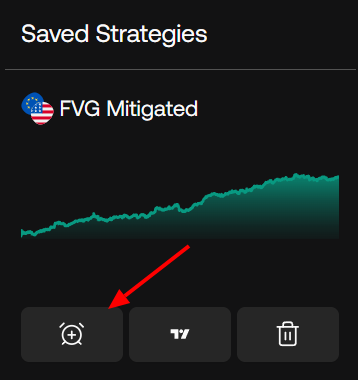
Alerts can also be created from saved strategies in the sidebar.
Users can have a maximum of 100 alerts running.
## Accessing Created Alerts [#accessing-created-alerts]
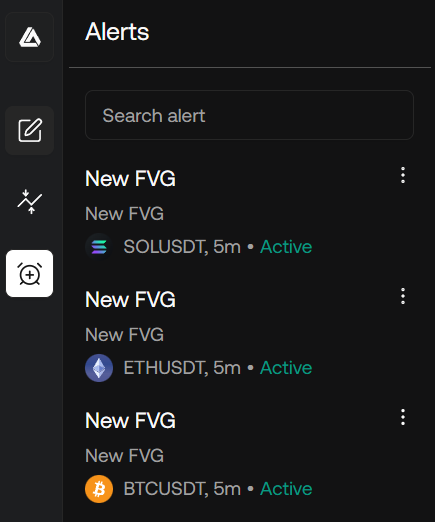
Created alerts can be accessed from the sidebar. From there the user can edit, pause, or delete them.
### Editing Created Alerts [#editing-created-alerts]
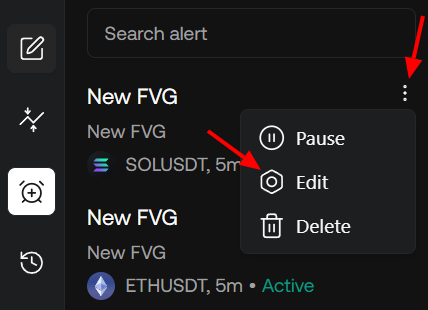
Alerts can be edited at any time by clicking on the kebab menu in the sidebar. Once edited and saved, the alert will use the new user-set configuration for future alerts.
# Introduction (/docs/ai-strategy-alerts/introduction)
Strategy alerts within our AI platform are only available to our Ultimate users. [Upgrade](https://www.luxalgo.com/pricing) your subscription to start creating strategies & alerts.
Any AI trading strategy you create out of millions on the LuxAlgo platform can now generate advanced alerts. This feature sends alerts triggered by events such as going long, short, exits, taken by the strategies available from using our [AI Assistant](/docs/ai-backtesting/introduction).
LuxAlgo users may use our alerts system to receive notifications in the form of in app notifications within our app, emails, or make use of our integrated webhooks for more advanced usage through third party platforms such as automated trading.
## Features [#features]
## FAQ [#faq]
See [this guide](/docs/ai-strategy-alerts/creating-alerts).
Only users with an **Ultimate** subscription may create alerts.
Users with an **Ultimate** subscription are limited to 100 alerts.
Yes, users can enable emails to be sent when an alert triggers.
Currently alerts are limited to the supported tickers and timeframes, as well as the available strategies in our database.
Yes, we allow creating up to 4 webhooks for a single alert.
Yes, it is possible to use our webhooks to integrate with third party automation platforms to place orders.
We do not guarantee the proper execution of orders nor the arrival of requests to set webhooks.
Yes, it is possible for alerts to be delayed depending on the load on our systems and other external factors.
No, alerts created from strategies on futures use a real-time data feed.
Canceling or downgrading your Ultimate subscription will keep your existing alerts active. You will be able to create alerts only until the end of the subscription.
Once your Ultimate subscription ends, all your alerts will be stopped.
If you pause your subscription, all of your alerts will stop immediately.
All alerts will be immediately stopped but will remain tied to your account in the state they were set as.
If you resubscribe, you will regain access to previously created alert and may reactivate them.
## Disclaimer [#disclaimer]
Alerts and notifications provided by LuxAlgo are intended **for informational and display purposes only**. They are **not designed or guaranteed for trading execution, investment decisions, or financial advice**.
LuxAlgo does not guarantee the **availability, accuracy, reliability, or timely delivery** of any alerts, notifications, or webhooks. **Downtime or delivery failures may occur** at any time without prior notice.
By using LuxAlgo alerts, you acknowledge that LuxAlgo **is not liable for any losses, damages, or outcomes** resulting from the use, interpretation, or reliance upon such alerts, notifications, or webhooks.
Read our [full disclaimer](https://www.luxalgo.com/legal/disclaimer/).
# Notifications (/docs/ai-strategy-alerts/notifications)
Users can be notified of triggered alerts via in-app notifications and/or emails.
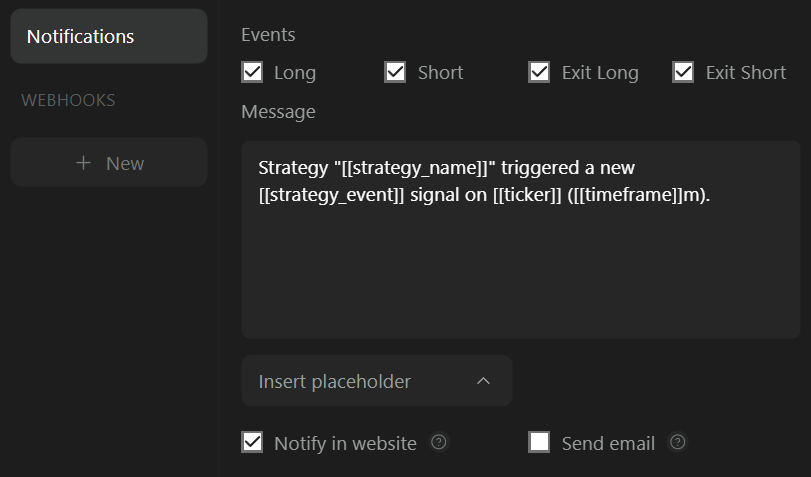
The default view when creating or editing an alert displays the notification settings by default and can be accessed at any time by clicking on "Notifications" in the alert menu sidebar.
## Events [#events]
The event toggles determine which strategy events (long, short, exit long, exit short) trigger an in-app or email notification (if enabled).
## Alert message [#alert-message]
The alert message field determines the content that appears in the in-app notification or email.
### Placeholders [#placeholders]
Users might want to include dynamic data in their alert message, such as which strategy event triggered the alert or the strategy's entry price.
This is possible using placeholders. The syntax is `[[placeholder_name]]`. The following placeholders are available.
| Placeholder | Description | |
| -------------------------------- | ------------------------------------------------------------------------------------------------------------------------------------------------------------------------------ | ---------- |
| \[\[currency]] | Currency of the asset the strategy is based on | |
| \[\[current\_contract\_myy]] | For strategies set on futures, current contract traded by the strategy in the format `[ROOT][MONTH_CODE][2 digit YEAR]`, for example `ESZ25` | `string` |
| \[\[current\_contract\_myyyy]] | For strategies set on futures, current contract traded by the strategy in the format `[ROOT][MONTH_CODE][4 digit YEAR]`, for example `ESZ2025` | `string` |
| \[\[exchange]] | Exchange where the asset is traded | |
| \[\[strategy\_event]] | Event originating from the strategy, options include "long", "short", "exit long", "exit short" | |
| \[\[strategy\_id]] | A unique identifier associated to the strategy | |
| \[\[strategy\_market\_position]] | Current position of the strategy, options include "long", "short", "flat" | |
| \[\[strategy\_name]] | Name of the strategy | |
| \[\[strategy\_order\_action]] | Action taken by the strategy, options include "buy" and "sell". For this placeholder an exit long would lead to the value being "sell" while an exit short would lead to "buy" | |
| \[\[strategy\_order\_price]] | Price at which the order was executed | |
| \[\[ticker]] | Ticker symbol the strategy is based on | |
| \[\[time]] | ISO 8601 datetime (including milliseconds) of the opening time of the candle for which the strategy event occurred. Example `2025-11-17T23:14:52.123Z` | `datetime` |
| \[\[timeframe]] | Timeframe the strategy is based on | `number` |
| \[\[timenow]] | ISO 8601 datetime (including milliseconds) of the alert being triggered. Example `2025-11-17T23:14:52.123Z` | `datetime` |
Example of a strategy alert message using placeholders:
```
Strategy "[[strategy_name]]" triggered a new [[strategy_event]] signal on [[ticker]] ([[timeframe]]m) at price [[strategy_order_price]].
```
Placeholders may be inserted in the message directly through the "Placeholders" dropdown; click a placeholder to insert it.
## In-App Notifications [#in-app-notifications]
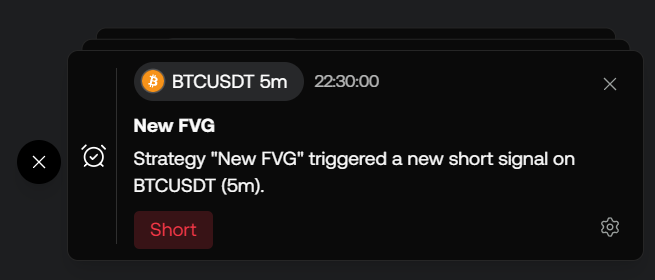
In-app notifications display small cards indicating an alert has been triggered. On desktop, they appear at the bottom-right of the screen; on mobile, at the bottom.
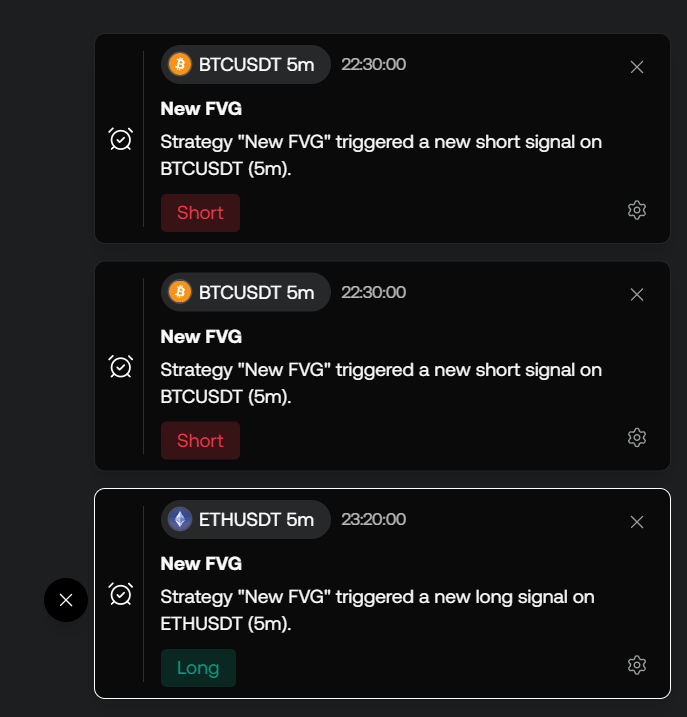
Hovering over a card shows messages from older alerts. Removing a card displays the next oldest alert (if any) at the top of the list.
Users can edit alerts directly from the cards by clicking the gear icon in the bottom-right.
## Emails [#emails]
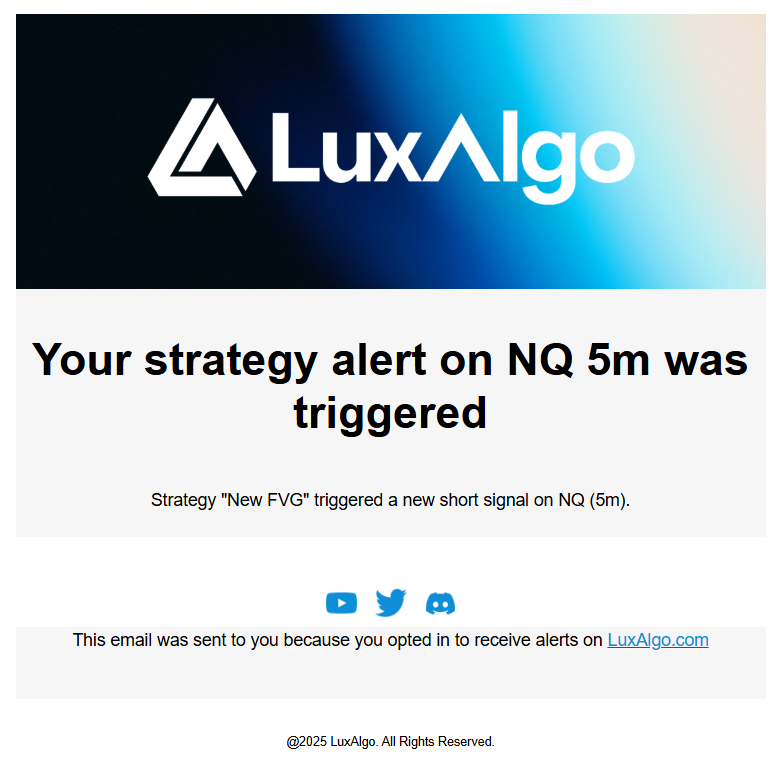
When a strategy alert is triggered, the user can receive an email at the address associated with their account.
To receive emails, enable "Send email" in the Notifications settings at the bottom-right.
# Webhooks (/docs/ai-strategy-alerts/webhooks)
Webhooks allow strategy alerts to be sent to third-party applications such as Discord, Telegram, automation platforms, or anywhere for advanced usage such as automated trading.
## Creating a webhook [#creating-a-webhook]
To create a webhook, simply look at the alert menu sidebar and click `+ New` under the **WEBHOOKS** section. This will open the settings for the new webhook, which will also appear in the alert menu sidebar.
Users can create up to 4 webhooks.
## Webhook Settings [#webhook-settings]
***
### Webhook URL (Required) [#webhook-url-required]
The URL of the webhook that will be reached when an alert is triggered. Only valid URLs are allowed.
Once a valid URL is entered, the webhook toggle can be enabled.
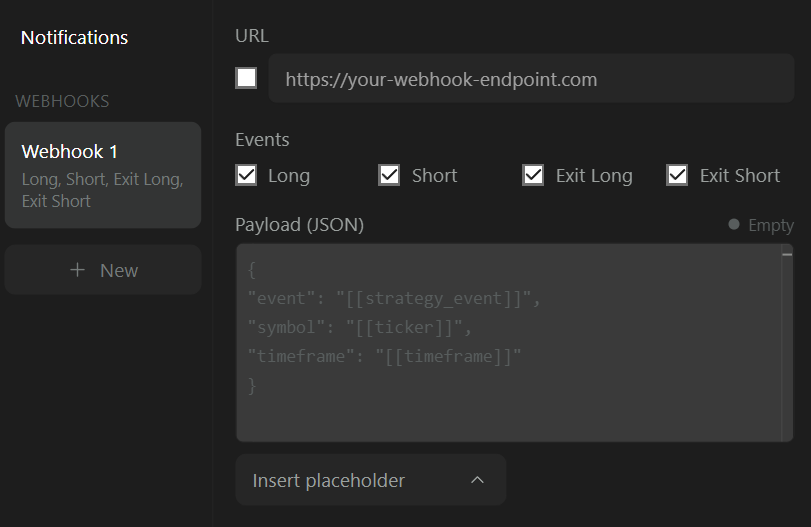
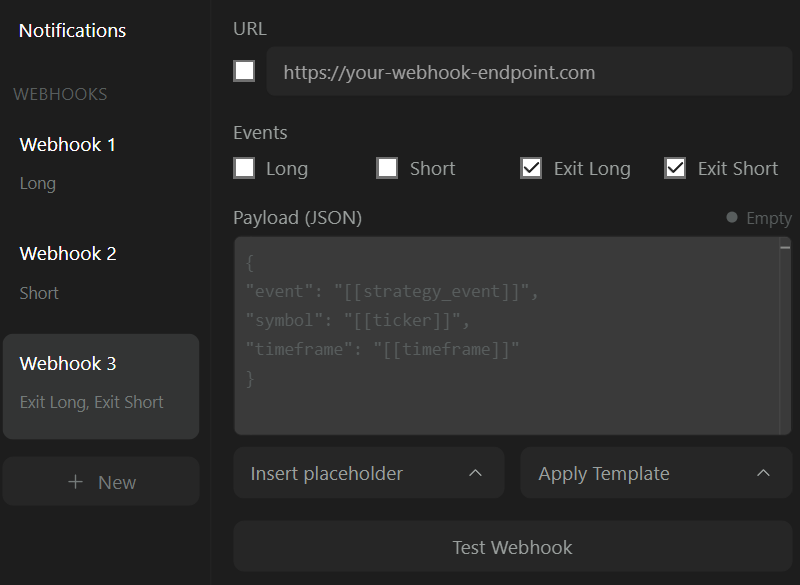
### Events [#events]
The event toggles determine for which strategy events (long, short, exit long, exit short) a webhook is triggered.
### Payload (Optional) [#payload-optional]
The payload field should contain the data sent to the webhook. The expected format for the payload is JSON.
> Learn more about the JSON format [here](https://www.geeksforgeeks.org/javascript/json-introduction).
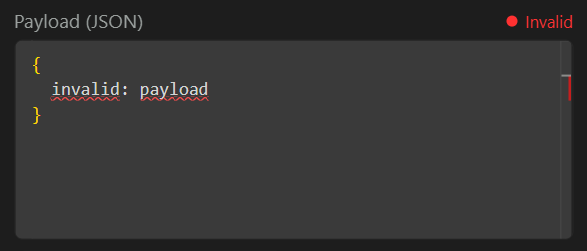
If the payload is invalid it will be indicated.
If no payload is provided an empty JSON `{}` will be sent.
#### Placeholders [#placeholders]
Users might want to include in their alert message dynamic data, such as which strategy event triggered the alert or the entry price of the strategy.
This is possible by using placeholders. The placeholder syntax is as follows `[[placeholder_name]]`. The following placeholders are available.
| Placeholder | Description | Type |
| -------------------------------- | ------------------------------------------------------------------------------------------------------------------------------------------------------------------------------ | ---------- |
| \[\[currency]] | Currency of the asset the strategy is based on | `string` |
| \[\[current\_contract\_myy]] | For strategies set on futures, current contract traded by the strategy in the format `[ROOT][MONTH_CODE][2 digit YEAR]`, for example `ESZ25` | `string` |
| \[\[current\_contract\_myyyy]] | For strategies set on futures, current contract traded by the strategy in the format `[ROOT][MONTH_CODE][4 digit YEAR]`, for example `ESZ2025` | `string` |
| \[\[exchange]] | Exchange where the asset is traded | `string` |
| \[\[strategy\_event]] | Event originating by the strategy, options include "long", "short", "exit long", "exit short" | `string` |
| \[\[strategy\_id]] | A unique identifier associated to the strategy | `string` |
| \[\[strategy\_market\_position]] | Current position of the strategy, options include "long", "short", "flat" | `string` |
| \[\[strategy\_name]] | Name of the strategy | `string` |
| \[\[strategy\_order\_action]] | Action taken by the strategy, options include "buy" and "sell". For this placeholder an exit long would lead to the value being "sell" while an exit short would lead to "buy" | `string` |
| \[\[strategy\_order\_price]] | Price at which the order was executed | `number` |
| \[\[ticker]] | Ticker symbol the strategy is based on | `string` |
| \[\[time]] | ISO 8601 datetime (including milliseconds) of the opening time of the candle for which the strategy event occurred. Example `2025-11-17T23:14:52.123Z` | `datetime` |
| \[\[timeframe]] | Timeframe the strategy is based on | `number` |
| \[\[timenow]] | ISO 8601 datetime (including milliseconds) of the alert being triggered. Example `2025-11-17T23:14:52.123Z` | `datetime` |
Even though the result of a placeholder can have a specific type, we only consider placeholders valid if they are strings (in between double quotation marks) in the payload.
Example of valid payload:
```json
{
"id": "my_unique_id",
"time": "[[timenow]]",
"event": "[[strategy_event]]",
"year": 2025,
"strategy conditions":
{
"long": "Confirmation Any Bullish",
"short": "Confirmation Any Bearish"
}
}
```
Placeholders may be inserted in the message directly through the "Placeholders" dropdown and clicking in the specific placeholder to insert. These will be inserted as a string directly.
## Creating Multiple Webhooks [#creating-multiple-webhooks]
Users can create up to 4 webhooks, one for different events, different URLs, or payloads.
This is useful if the URL or expected payload for specific events are different, or if a specific alert should be delivered to multiple platforms at the same time.
### Duplicating Webhooks [#duplicating-webhooks]
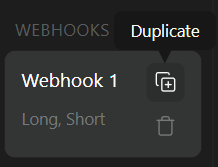
To easily preserve fields such as webhook URL and payload, users can duplicate the webhook by hovering on its corresponding item in the alert menu sidebar, clicking on the duplicate button will duplicate the webhook.
Duplicated webhooks come with the webhook URL toggle disabled.
## Templates [#templates]
Alerts and notifications provided by LuxAlgo are intended **for informational and display purposes only**. They are **not designed or guaranteed for trading execution, investment decisions, or financial advice**.
LuxAlgo does not guarantee the **availability, accuracy, reliability, or timely delivery** of any alerts, notifications, or webhooks. **Downtime or delivery failures may occur** at any time without prior notice.
By using LuxAlgo alerts, you acknowledge that LuxAlgo **is not liable for any losses, damages, or outcomes** resulting from the use, interpretation, or reliance upon such alerts, notifications, or webhooks.
Read our [full disclaimer](https://www.luxalgo.com/legal/disclaimer/).
### TradersPost [#traderspost]
Create a new strategy on TradersPost, once created navigate to it, click on "Webhook" and copy the provided URL.
In the LuxAlgo strategy alert creation menu create a new webhook, add the provided webhook URL, and use the following as payload:
```json
{
"ticker": "[[ticker]]",
"action": "[[strategy_order_action]]",
"sentiment": "[[strategy_market_position]]",
"quantity": "1",
"price": "[[strategy_order_price]]",
"time": "[[timenow]]",
"interval": "[[timeframe]]"
}
```
For `quantity` use your preffered position sizing based on your money management rules.
See the following docs for more information about [TradersPost](https://docs.traderspost.io/docs).
#### For Futures [#for-futures]
When setting a strategy alert for futures you plan on automating TradersPost recommends for the current contract traded to be provided.
The futures contract should be in the format `[ROOT][MONTH CODE][4 digit YEAR]`. This can be provided using this template:
```json
{
"ticker": "[[current_contract_myyyy]]",
"action": "[[strategy_order_action]]",
"sentiment": "[[strategy_market_position]]",
"quantity": "1",
"price": "[[strategy_order_price]]",
"time": "[[timenow]]",
"interval": "[[timeframe]]"
}
```
### 3commas [#3commas]
#### Single Webhook [#single-webhook]
Create a new signal bot on 3commas, select TradingView strategy, and copy the provided URL.
In the LuxAlgo strategy alert creation menu create a new webhook, add the provided webhook URL, and use the following as payload:
```json
{
"secret": "your_secret_token",
"max_lag": "300",
"timestamp": "[[timenow]]",
"trigger_price": "[[strategy_order_price]]",
"tv_exchange": "[[exchange]]",
"tv_instrument": "[[ticker]]",
"action": "[[strategy_order_action]]",
"bot_uuid": "your_bot_uuid",
"strategy_info": {
"market_position": "[[strategy_market_position]]",
"market_position_size": "1"
},
"order": {
"amount": "1",
"currency_type": "base"
}
}
```
Use your provided "secret" and "bot\_uuid".
For `amount` in `order` use your preffered position sizing based on your money management rules.
See the following [docs](https://help.3commas.io/en/articles/8778456-signal-bot-tradingview-strategy-type) to learn more about 3commas strategy bots.
#### Multiple Webhooks [#multiple-webhooks]
You can also use multiple webhooks with 3commas to open specific positions.
Create a new signal bot on 3commas, select custom signal, select "Reversal" as direction, copy the provided URL and use the following payloads depending on the position:
Only keep "long" enabled in the event tab.
```json
{
"secret": "your_secret_token",
"max_lag": "300",
"timestamp": "[[timenow]]",
"trigger_price": "[[strategy_order_price]]",
"tv_exchange": "[[exchange]]",
"tv_instrument": "[[ticker]]",
"action": "enter_long",
"bot_uuid": "your_bot_uuid"
}
```
Only keep "exit long" enabled in the event tab.
```json
{
"secret": "your_secret_token",
"max_lag": "300",
"timestamp": "[[timenow]]",
"trigger_price": "[[strategy_order_price]]",
"tv_exchange": "[[exchange]]",
"tv_instrument": "[[ticker]]",
"action": "exit_long",
"bot_uuid": "your_bot_uuid"
}
```
Only keep "short" enabled in the event tab.
```json
{
"secret": "your_secret_token",
"max_lag": "300",
"timestamp": "[[timenow]]",
"trigger_price": "[[strategy_order_price]]",
"tv_exchange": "[[exchange]]",
"tv_instrument": "[[ticker]]",
"action": "enter_short",
"bot_uuid": "your_bot_uuid"
}
```
Only keep "exit short" enabled in the event tab.
```json
{
"secret": "your_secret_token",
"max_lag": "300",
"timestamp": "[[timenow]]",
"trigger_price": "[[strategy_order_price]]",
"tv_exchange": "[[exchange]]",
"tv_instrument": "[[ticker]]",
"action": "exit_short",
"bot_uuid": "your_bot_uuid"
}
```
Use your provided "secret" and "bot\_uuid".
See the following [docs](https://help.3commas.io/en/articles/8529406-signal-bot-custom-signal-type) to learn more about 3commas signal bots.
### Cornix [#cornix]
Go to your dashboard, and create a new bot by selecting "TradingView Bot".
Select wether this bot should be for live or a demo trading account.
Configure the bot name, account, symbol, position size and the direction.
Click on create bot and choose in the new window if the bot should be activated or not after creation. If not activated you will need to activate it later on.
Once created copy the Webhook URL for this bot and paste it in the webhook URL field in the LuxAlgo alert creation menu.
Before creating the alert only keep the relevant event enabled based on the direction selected before, if you selected "Long" only keep the long event selected.
Repeat the above steps for the Short direction.
### Discord [#discord]
You can receive messages from AI strategy alerts directly in your Discord server, this can be useful to have a personal log for alerts or just a simple place to get notified on actions taken by strategies.
Make sure you have a server and a channel with a webhoook setup, to learn more about creating webhooks for Discord see [this](https://support.discord.com/hc/en-us/articles/228383668-Intro-to-Webhooks) guide.
Copy the webhook URL, paste it in the webhook URL field in the LuxAlgo alert creation menu, and use the following payload:
```json
{
"username": "[[strategy_name]]",
"content": "New [[strategy_event]] signal on [[ticker]] ([[timeframe]]m)"
}
```
You maye customize the message look using the fields described [here](https://discord.com/developers/docs/resources/webhook#execute-webhook-jsonform-params).
# How To Use Discord (/docs/getting-started/community)
Discord is a free instant-messaging platform for participating in communities. Below you will find the basics on how to create a free Discord account and how to get access as a LuxAlgo subscriber.
This is the platform where we host our 150,000+ member community with automated alerts, strategy forums, and various bots to further optimize your experience at LuxAlgo.
## Create A Free Discord Account [#create-a-free-discord-account]
To create a Discord account go to the [Discord website](https://discord.com), download the Discord app (or open it from the browser) and enter your desired username.
## Joining The Discord [#joining-the-discord]

When you first join our server, you won't be able to see anything besides our public channels. You can get help in the **#support** channel, see our announcements, get useful information regarding LuxAlgo, and learn how to sign up. If you haven't already joined the server, [click here.](https://discord.gg/lux)
## Exclusive Roles [#exclusive-roles]
Once you get a subscription on our website, you will be able to connect your Discord account to our system, which will give you exclusive perks.
The @Premium, and @Ultimate Discord roles are automatically granted to users depending on the plan they chose from [our website](https://luxalgo.com/pricing). All users are prompted to connect their Discord account right after they sign up for their roles, however, we also send an email which includes a link to your LuxAlgo account anyone can always access to connect their Discord account and receive an exclusive role.
Every exclusive role includes access to our highly active community market discussion channels where traders discuss all markets using LuxAlgo tools alongside a user strategy forum for sharing trading strategies made with our exclusive tools, and an Alert Scripting forum for sharing advanced alert setups from our toolkits with the powerful Alert Scripting feature.
Our community also has scanner alerts which are made up of thousands of pre-set alerts using our exclusive toolkits.
The @Premium and @Ultimate roles unlock access to all of our scanner alerts which are also based on features from our Signals & Overlays toolkit.
The @Ultimate role includes access to a section of channels for backtesting, where our data-driven traders discuss strategy creation & share backtesting data using our AI Backtesting Assistant.
To get your exclusive role, click "Connect Accounts" from your Subscription Confirmation email and then click the 'Authorize Discord' button in the portal and your role will be granted automatically.
If you are having trouble, please reply to the Subscription Confirmation email with your Discord username and our support team will ensure you have full access right away.
# FAQ (/docs/getting-started/faq)
## Access [#access]
Sign up to any plan on
[our website](https://luxalgo.com)
.
After purchasing a subscription, you will be prompted to
**connect your accounts**
& get instant access.
If you are having trouble, let our live human support team know your TradingView username and we will fix your access. If you're speaking to an AI Agent, request to speak to a human directly.
The **Premium Plan** gives you the full set of our world-renowned Price Action Concepts®, Signals & Overlays®, and Oscillator Matrix® toolkits + screeners on TradingView which makes it the best choice for advanced technical analysis.
The **Ultimate Plan** was designed for using our AI Backtesting platform and Backtesters, allowing you to automate backtesting of our toolkits. This is the most popular choice as it uses AI & deep optimization to give you the biggest advantage possible for data-driven, automated analysis.
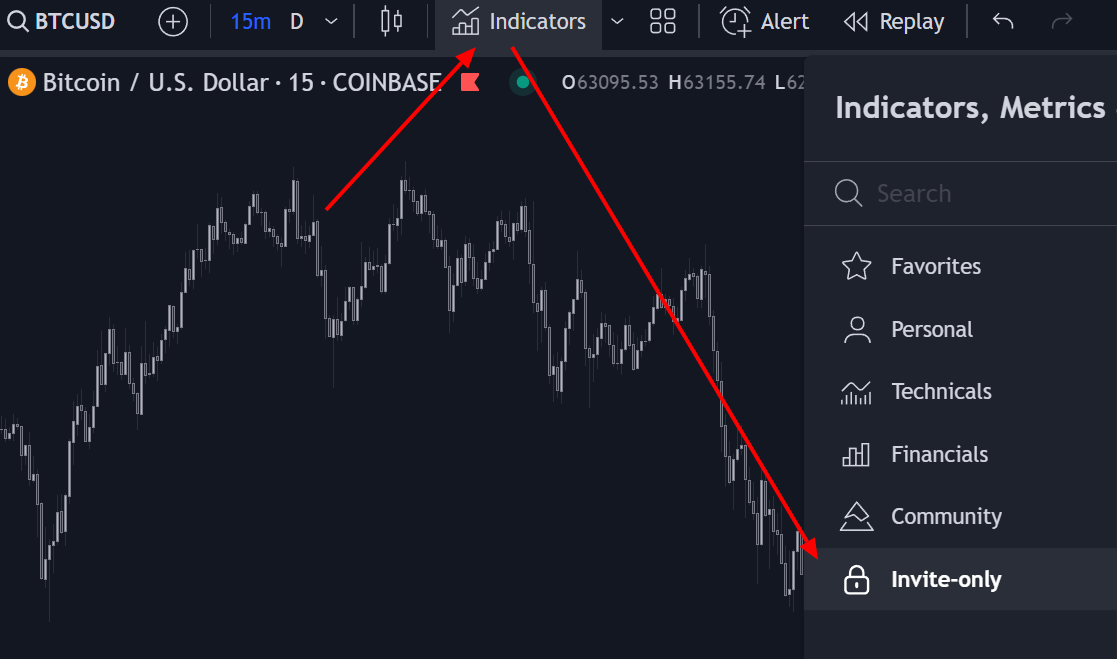
Make sure the username you used to connect your TradingView account is correct. If so, **refresh your browser/app** and then check your your Indicators --> Invite-only scripts folder on TradingView again.
If you just created a TradingView account as you signed up for a LuxAlgo core platform subscription, it may take 5 - 10 minutes to be indexed in TradingView's userbase first. Please wait and then try entering your username again within our Connect Accounts user portal.
If you still don't have access, let our live human support team know your TradingView username and we will fix your access. If you're speaking to an AI Agent, request to speak to a human directly.
## Products [#products]
Our tools are designed to work across all major asset classes and timeframes, but the specific coverage depends on which platform you are using:
TradingView Indicators (Premium Plan): These tools function on any ticker and timeframe available on TradingView. Whether you are trading obscure altcoins, penny stocks, or futures on a 1-minute chart, the indicators will load and provide analysis instantly.
LuxAlgo AI (Ultimate Plan): Our AI platform scans and backtests strategies on major liquid markets including Crypto (BTC, ETH, SOL, etc.), Forex (EURUSD, GBPUSD, etc.), Indices (SPX, NDX), and major Stocks. It is optimized for standard timeframes (5m, 15m, 1H, 4H, Daily) to find the most robust strategies for Scalping, Swing Trading, or Day Trading.
No, all features within our toolkits do **not** repaint. Everything appears in real-time and are confirmed & permanent on the chart once the candle a signal was generated on has closed.
Repainting is where past results of an indicator or a signal change based on data in the future. In terms of our exclusive tools, none of them repaint in any way. Only a small few of our hundreds of free indicators have this functionality.
Within our Signals & Overlays toolkit, any signal is confirmed only once the candle is closed. This means a signal could appear on your chart but not be confirmed until that candle is closed and the next candle has started.
Our alerts in Discord will **never** notify you on any signal until the candle has closed and confirmed it. If you're adding alerts for our toolkits within TradingView, make sure to always select the "Once per bar close" configuration.
You don't need to upgrade your TradingView account, our exclusive tools work with 100% functionality on the basic plan of TradingView (free). [You can sign up for free here](https://www.tradingview.com/gopro/?share_your_love=LuxAlgo).
Yes, all of our plans are great for beginners.
Every plan comes with many tutorials as well as access to our highly active community where users can get 24/7 support, discuss strategies, & go through daily analysis amongst each other using LuxAlgo.
Our Ultimate Plan is great for traders who want to do more powerful strategy creation but even a beginner can maximize their advantage of it using our AI platform.
Yes, you can automate your trades using LuxAlgo. Our LuxAlgo AI platform is specifically designed for algorithmic trading, allowing you to generate backtested strategies and stream live signals directly to third-party automation platforms via webhooks.
Additionally, our indicators and strategies available on TradingView can be automated in the same way by setting up alerts that trigger webhooks. However, for the most robust experience, we recommend using our AI strategies which are engineered specifically for generating automated signals.
Yes, you can send trades to MetaTrader via third parties.
While our premium visual indicators (like Signals & Overlays™) are designed exclusively for the TradingView charting interface, you can still execute trades on your MT4 or MT5 account using our tools:
For Automation (Recommended): You can use the LuxAlgo AI platform to generate strategies and stream signals directly to third party apps that plug in to your MetaTrader account via webhooks. This allows you to run algorithmic strategies on our platform while the trades execute automatically on yours.
For Manual Trading: Many users perform their analysis on TradingView using our premium toolkits and then manually enter the resulting trades into their MetaTrader terminal.
Yes, TradingView supports real-time data for the majority of tickers you can find on the platform. Only a small portion of them (mostly futures contracts) require a small monthly fee to access real-time data.
While we are proud to be the world's largest provider of free open-source indicators on TradingView, our paid plans offer a completely different level of professional capability:
LuxAlgo AI (Ultimate): The biggest difference is our AI platform, which goes beyond simple indicators. It allows you to generate backtested strategies, optimize settings using data-driven insights, and automate your trading via webhooks—capabilities that do not exist in free scripts.
Premium Toolkits: Our paid indicators (like Signals & Overlays and Price Action Concepts) are designed as "all-in-one" systems with extreme capabilities for customization & alert functionalities. Instead of combining multiple free indicators that clutter your chart, these toolkits provide comprehensive, noise-free workflows with advanced features and customization specifically engineered for serious traders.
This error message appears when an user does not have access to the indicator. If you've already registered your TradingView username within our Connect Accounts portal and you're seeing this message, refresh your browser or app and make sure you're logged in on the TradingView profile you entered.
If you are still getting this issue, let our live human support team know your TradingView username and we will fix your access. If you're speaking to an AI Agent, request to speak to a human directly. If you have not signed up with us, you'll see this error when trying to add our exclusive tools to your chart. You can get instant access [here](https://luxalgo.com/pricing).
This error generally occurs when TradingView can't handle script loads under high traffic. This error can appear when a high number of features are enabled. Changing settings within the indicators, or hiding/unhiding it will make the script recalculate and potentially fix the issue.
We are always trying to improve the performance of the toolkit in order to limit these issues.
This error generally occurs when a TradingView study exceeds the memory limit fixed by TradingView. This error can't be directly prevented and will generally be returned when using anything below the 1 minute timeframe.
We recommend users to stay with minute and higher timeframes to avoid potential errors with our premium toolkits.
## Billing [#billing]
You can cancel your subscription anytime by logging directly into your account on [our website](https://luxalgo.com/account/) and accessing the billing page where you will find your subscription and a way to easily cancel it on your own.
Once your subscription has been canceled, you will have access for the rest of the time in the plan you purchased and you will not be charged again.
You can re-activate a subscription that you previously cancelled by purchasing a plan again on our [pricing page](https://luxalgo.com/pricing).
Once you select the plan you want to subscribe back with, make sure to login to the same account you used with your previous subscription.
You can upgrade your subscription by logging in on [our website](https://luxalgo.com/pricing).
Once logged in, select your plan of choice to upgrade to and you will see a pop-up modal with the details.
We automatically convert any remaining time into a value of days on your new plan so you have a longer period of time on your newly upgraded subscription.
You can extend your current subscription up to 3 times on [our website](https://luxalgo.com/pricing).
Keep in mind that we only allow extending a subscription 3 times and it is for annual plans only.
For special limited time offers we do you can receive discounts which are all automatically applied, displayed on the pricing cards, and for the first payment of your subscription only.
You can always get up to 50% off the total price you'd pay monthly by choosing to pay annually on our plans.
We offer a 30 day money back guarantee so you can try our exclusive tools for 30 days risk free. We also have hundreds of free indicators you can try on our [Library](https://luxalgo.com/library) to experience our free tools first.
No, the price you signed up for is the price you will keep forever as long as you stay signed up. We will **never** change the price of your subscription. All members are grandfathered into the price they first signed up at regardless of any price increases we may do in the future.
Please keep in mind that all coupons used on LuxAlgo.com are for the first interval of your subscription only. All future billing intervals aside from the first one will be at the full price of the subscription you chose.
Access is instant for both our AI platform and TradingView tools immediately after sign-up:
LuxAlgo AI Platform: You can log in directly on our website to access the AI strategies immediately.
Complimentary TradingView tools: You will be prompted to enter your TradingView username in our Connect Accounts portal. Once connected, our Premium toolkits will instantly appear in your TradingView account under the "Invite-only scripts" folder (found within the Indicators menu on TradingView).
Troubleshooting: If you don't see the indicators on TradingView right away, try refreshing your browser or app. If you are still having trouble, please use the Live Chat on our website (request to speak to a human) or reply to your confirmation email, and our team will resolve it immediately.
If you're within 30 days of your first initial purchase, you can request a refund by getting in touch with our live human support team from contacting [support@luxalgo.com](mailto:support@luxalgo.com) or by requesting to speak to a human if you've already reached out on our website so a team member can help you with this directly.
Within your account, you can optionally downgrade your plan which will only start once your current plan ends.
For example if you have 15 days left in your Ultimate Plan and you're downgrading to Premium, the Premium plan will start in 15 days at full price.
Yes, we allow username changes in most scenarios as long as it's not too frequent. You may request this and send your new username alongside your old username to [support@luxalgo.com](mailto:support@luxalgo.com) and you may need to ask for our live human support team and we will change your username. If you're speaking to an AI Agent, request to speak to a human directly for this request.
# How To Get Updates (/docs/getting-started/how-to-update)
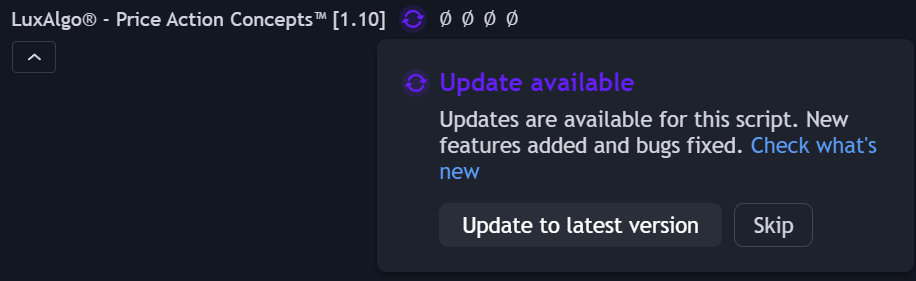
## Applying An Update [#applying-an-update]
On Tradingview updates are easy to apply. Once an update is available, refresh your chart, then a purple 🔄 icon will be visible near the indicator title, click on it and click on "Update to latest version".
You can also apply an update by following these steps:
1. Refresh your browser or mobile app
2. Remove the indicator from your chart
3. Re-add it from your invite-only indicators
The latest version of the indicator should appear.
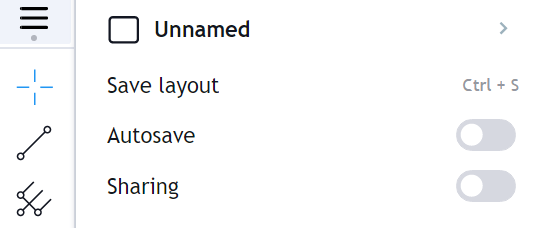
Make sure to save your **Chart Layout** on Tradingview after successfully installing an update so you can ensure it will stay
## Receiving Updates Notifications [#receiving-updates-notifications]
We always announce our updates on our community Discord server & [X Account](https://x.com/LuxAlgo). You can also receive update notifications on your TradingView charts directly by going to:
`settings -> notifications -> SCRIPTS YOU'VE ADDED TO FAVORITES OR LIKED`
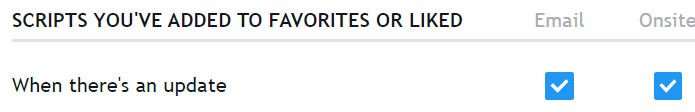
Make sure to follow the LuxAlgo account on [TradingView](https://www.tradingview.com/u/LuxAlgo/#published-scripts) to ensure you are notified when we push updates with new features to our exclusive tools!
# Quickstart (/docs/getting-started/introduction)

## Getting Started with LuxAlgo [#getting-started-with-luxalgo]
Welcome to the LuxAlgo documentation guide. Click any of the buttons below to learn how to get setup, use our tools, and enhance your trading experience.
In-depth guide on how to use Quant, our coding agent for creating indicators and strategies using Pine Script®.
In-depth guide on how to use our Toolkits
In-depth guide on how to use our Screeners
In-depth guide on our Backtesters
Learn how to find strategies using our AI platform.
Get alerted from AI strategy trades.
Learn how to setup exclusive LuxAlgo tools on TradingView
## Frequently Asked Questions [#frequently-asked-questions]
Need quick answers to general questions about our website, products, or billing? Click the button below to visit our FAQ.
Read through our frequently asked questions
## Join our Community [#join-our-community]
Need further support or want to give us some feedback? You can [join our community](https://discord.com/invite/LUX) or drop us an email at [support@luxalgo.com](mailto:support@luxalgo.com).
# How To Setup LuxAlgo (/docs/getting-started/setup-tools)
Once you've signed up to any plan on [our website](https://luxalgo.com/pricing) -- you will be able to see a place to "Connect Accounts" and enter your TradingView username to get instant access to use our exclusive tools compatible with TradingView.
In order to use our exclusive tools, you need to open a chart on TradingView.

Once your chart is open, click on **Indicators** (or type **/** ) to open the indicator menu, then click on "**Invite-only Scripts**". You should see the names of each Toolkit, Screener, or Backtester appear in this folder and you can click on one them to add to your chart.
Remember, you don't need to use all of these tools at once. It is suggested for users to explore through our tools to find a couple features that fit most optimally in your trading.
If you don't see the invite-only scripts folder or the locks appear red, please first try refreshing your browser/app. If this still doesn't have them show up, please email [support@luxalgo.com](mailto:support@luxalgo.com) with your TradingView username or contact live-chat on our website and our team will grant you access right away.
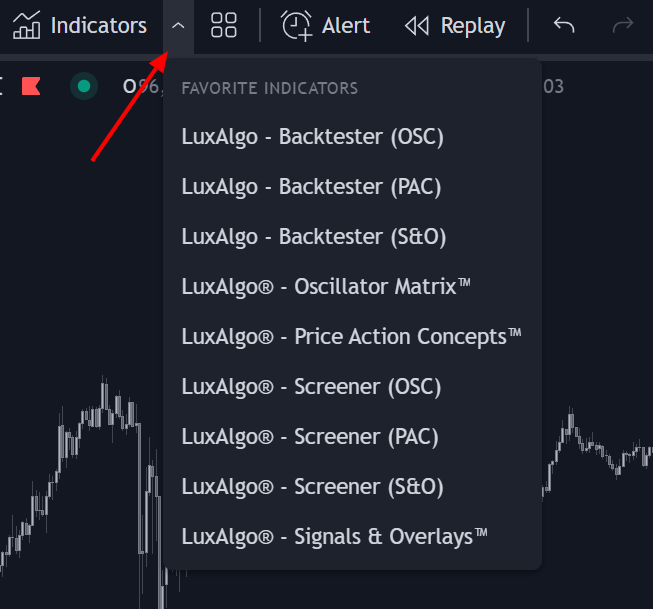
If you want to quickly access our tools you can add them to your favorites by clicking on the star at the right of their names in the folder. You will then be able to load the starred indicators directly from your favorites tab while on your charts.
# TradingView Alerts (/docs/getting-started/tradingview-alerts)
In this page, we show you the specifics of how to set up any alert on TradingView in general. If you want to learn how to set up specific alerts on our exclusive tools specifically, you can see the following [video](https://youtu.be/olKQq5XR5S0?t=38).
On the TradingView platform, alerts can be created to trigger for any user set condition, such as crosses between two indicators, price entering or exiting a channel...etc. Users can be notified when the condition is trigerred via phone notifications, emails, SMS, and more through webhooks.
## How To Create An Alert [#how-to-create-an-alert]
To create an alert you can:
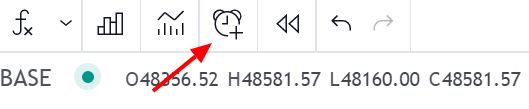
* Click on the alert button at the top of your chart.
* From the alert manager
* Using hotkeys `ALT + A` (Windows) or `⌥ + A` (Mac)
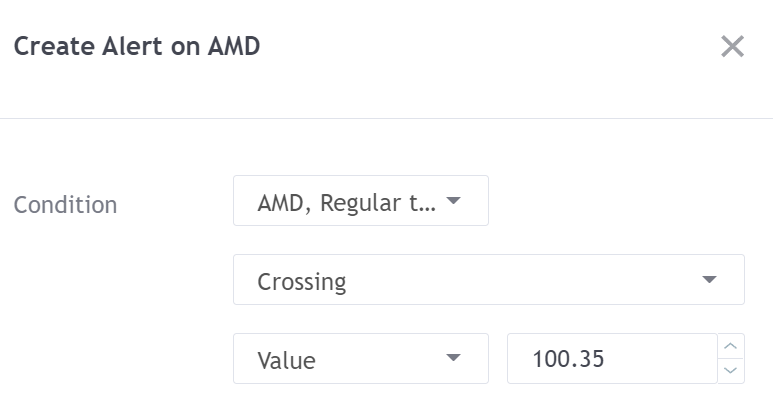
## Trigger Conditions [#trigger-conditions]
Users can select the conditions used to trigger an alert in the condition menu, selecting the indicators and a set of rules used to trigger an alert. The second drop down menu controls the specific alert trigger conditions, while the other drop down controls the elements/plots to be used for conditions.
Indicators return plots, which are visual elements that can be used to set the alert condition. Plots are used to visualize series of values, conditions, etc. Note that indicators can return multiple plots.
Available conditions to set custom alerts are explained below:
### Crossing/Crossing Up/Crossing Down [#crossingcrossing-upcrossing-down]
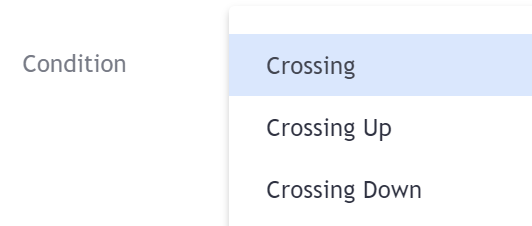
Crossing conditions are commonly used and allow users to be alerted when two elements cross each other.
Three crossing conditions are available, **Crossing**, **Crossing Up**, **Crossing Down**.
**Crossing** will alert on any crosses between two selected plots/values.
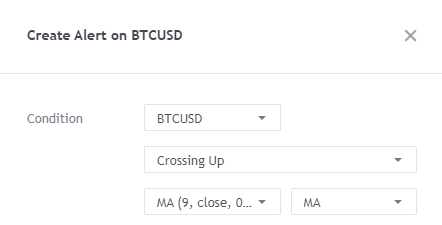
**Crossing Up** will alert only when the first selected element crosses over the second one.
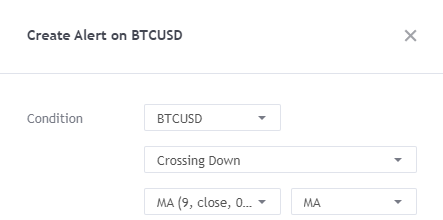
**Crossing Down** will alert only when the first selected element crosses over the second one.
### Entering/Exiting Channel [#enteringexiting-channel]
**Entering/Exiting Channels** conditions will trigger when any selected element enter or exit user selected upper/lower bounds.
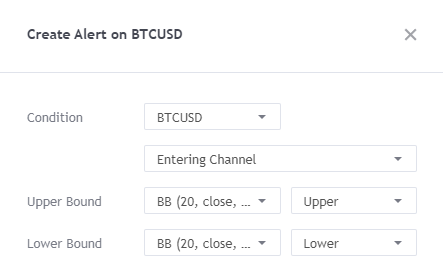
The **Entering Channel** condition will trigger when the element in the first drop-down menu cross-under the selected upper bound or cross-over the selected lower bound.
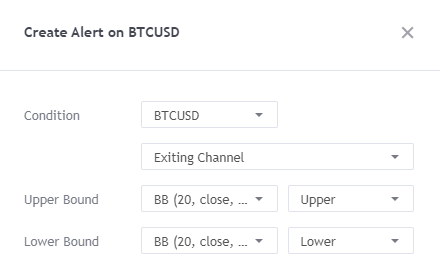
The **Exiting Channel** condition will trigger when the element in the first drop-down menu cross-over the selected upper bound or cross-under the selected lower bound.
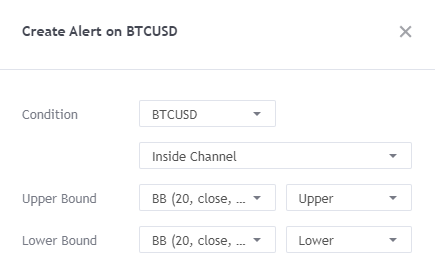
### Outside/Inside Channel [#outsideinside-channel]
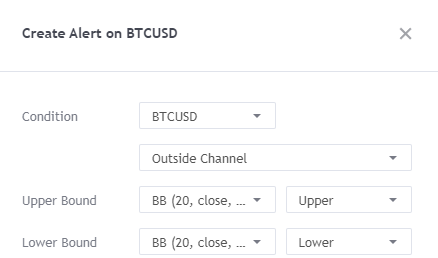
**Outside/Inside Channels** conditions will trigger when any selected element is outside or within selected upper/lower bounds.
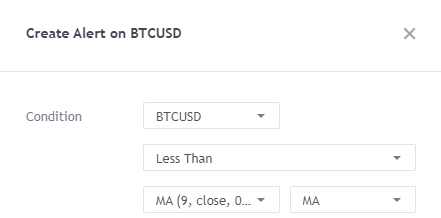
### Greater/Less Than [#greaterless-than]

The **Greater Than** and **Less Than** conditions will trigger when a selected element is greater or less than a selected element or value.
## How To Use Placeholders [#how-to-use-placeholders]
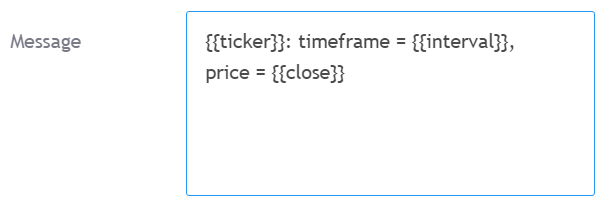
Placeholders allow for the value of a variable to be returned in an alert message. This variable can be the closing price of a symbol (`{{close}}`), the time frame of the chart the alert is created on (`{{interval}}`), and even the value of an indicator. This is done using the `{{plot("Name")}}` placeholder, where `"Name"` is the name of the plot you want the value to be returned in the alert message. Note that only the first 22 plots in an indicator can be used in placeholders.
Note that `plot("Name")` must be part of the indicator selected in the alert condition.
## Warning Message [#warning-message]
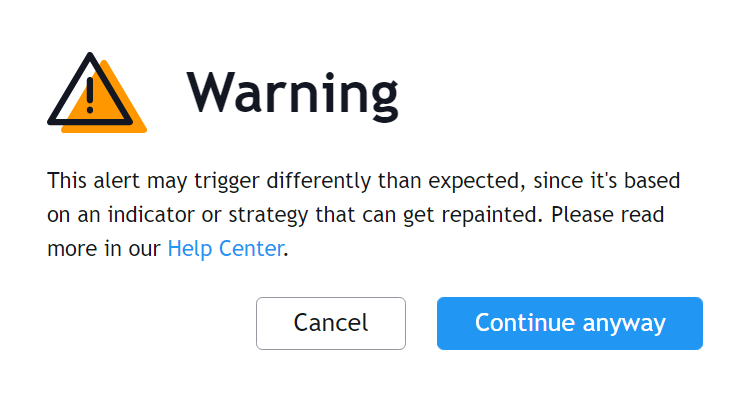
When you create an alert using certain indicators such as the Signals & Overlays® indicator, you might see a warning message, this is caused by internal Pine Script® functions used in the script that may have a repainting behavior when set in a specific way.
The alerts provided by the LuxAlgo indicators **do not repaint** and as such, you can click on **continue anyway**.
## Managing Alerts [#managing-alerts]
The alerts manager menu allows you to manage the alerts you have currently set. From there you can create, remove, pause, reactivate, clone, search, sort and edit your alerts. To access the alert manager menu click on the alerts icon represented by an alarm symbol at the top left of the chart.

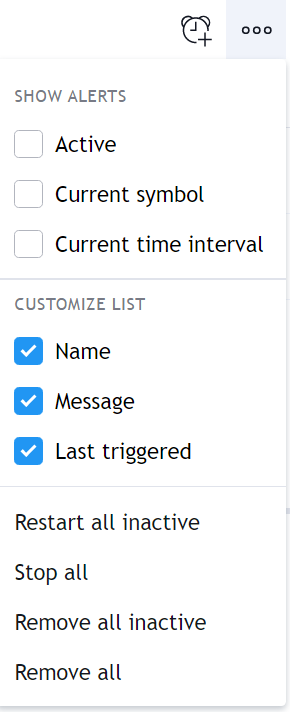
If you want to remove all your current alerts click on the three horizontal dots at the right of the "add alert" icon, then select "remove all".
For more information on how to manage alerts go [here](https://www.tradingview.com/support/solutions/43000595311-manage-alerts/).
### Updating Alerts [#updating-alerts]
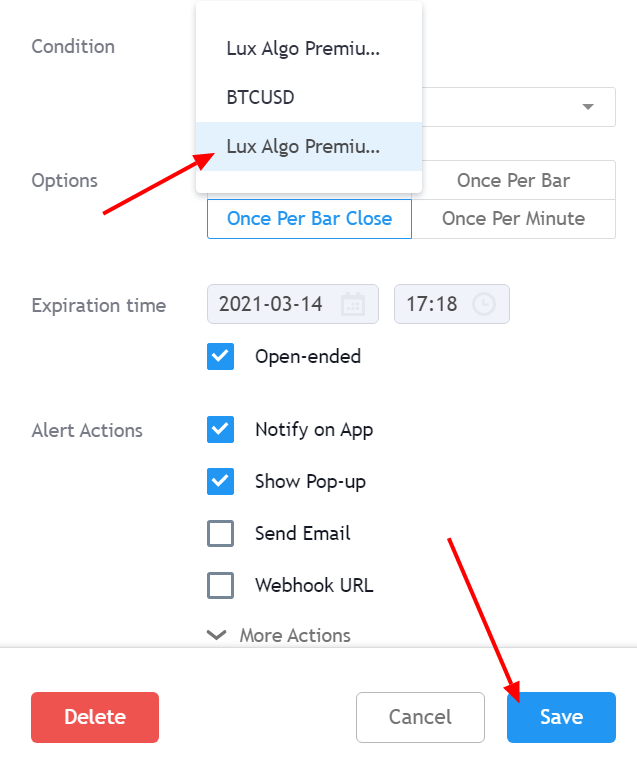
It is important to note that if one of the indicator settings is **changed after the alert is created**, then the alert will be **triggered using the old settings**. In order to update an alert go to the alert manager and click on edit.
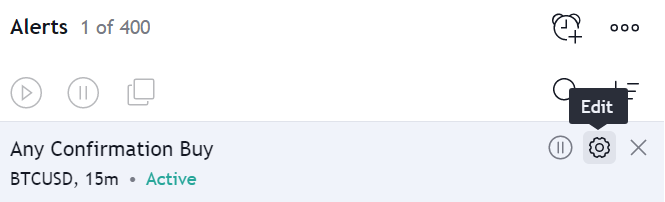
In the first drop-down menu of the **Condition** section, select the second indicator with the same name as the one first used to create the alert you want to update and save the alert.
# What Is TradingView? (/docs/getting-started/tradingview)

[TradingView ](https://www.tradingview.com)is a free charting platform and social network where traders/investors can **look** at financial charts and use a wide variety of tools to spot opportunity in every market across Stocks, Forex, Crypto, Futures & Commodities. TradingView users can connect most brokers to trade directly on the platform and **leap** into opportunities as they are presented in real time from their charts.
This is the platform where we host our exclusive tools. You can create a free account on TradingView and then sign up on [our website](https://luxalgo.com/pricing) to receive instant-access to use our tools.
## How To Create A TradingView Account [#how-to-create-a-tradingview-account]
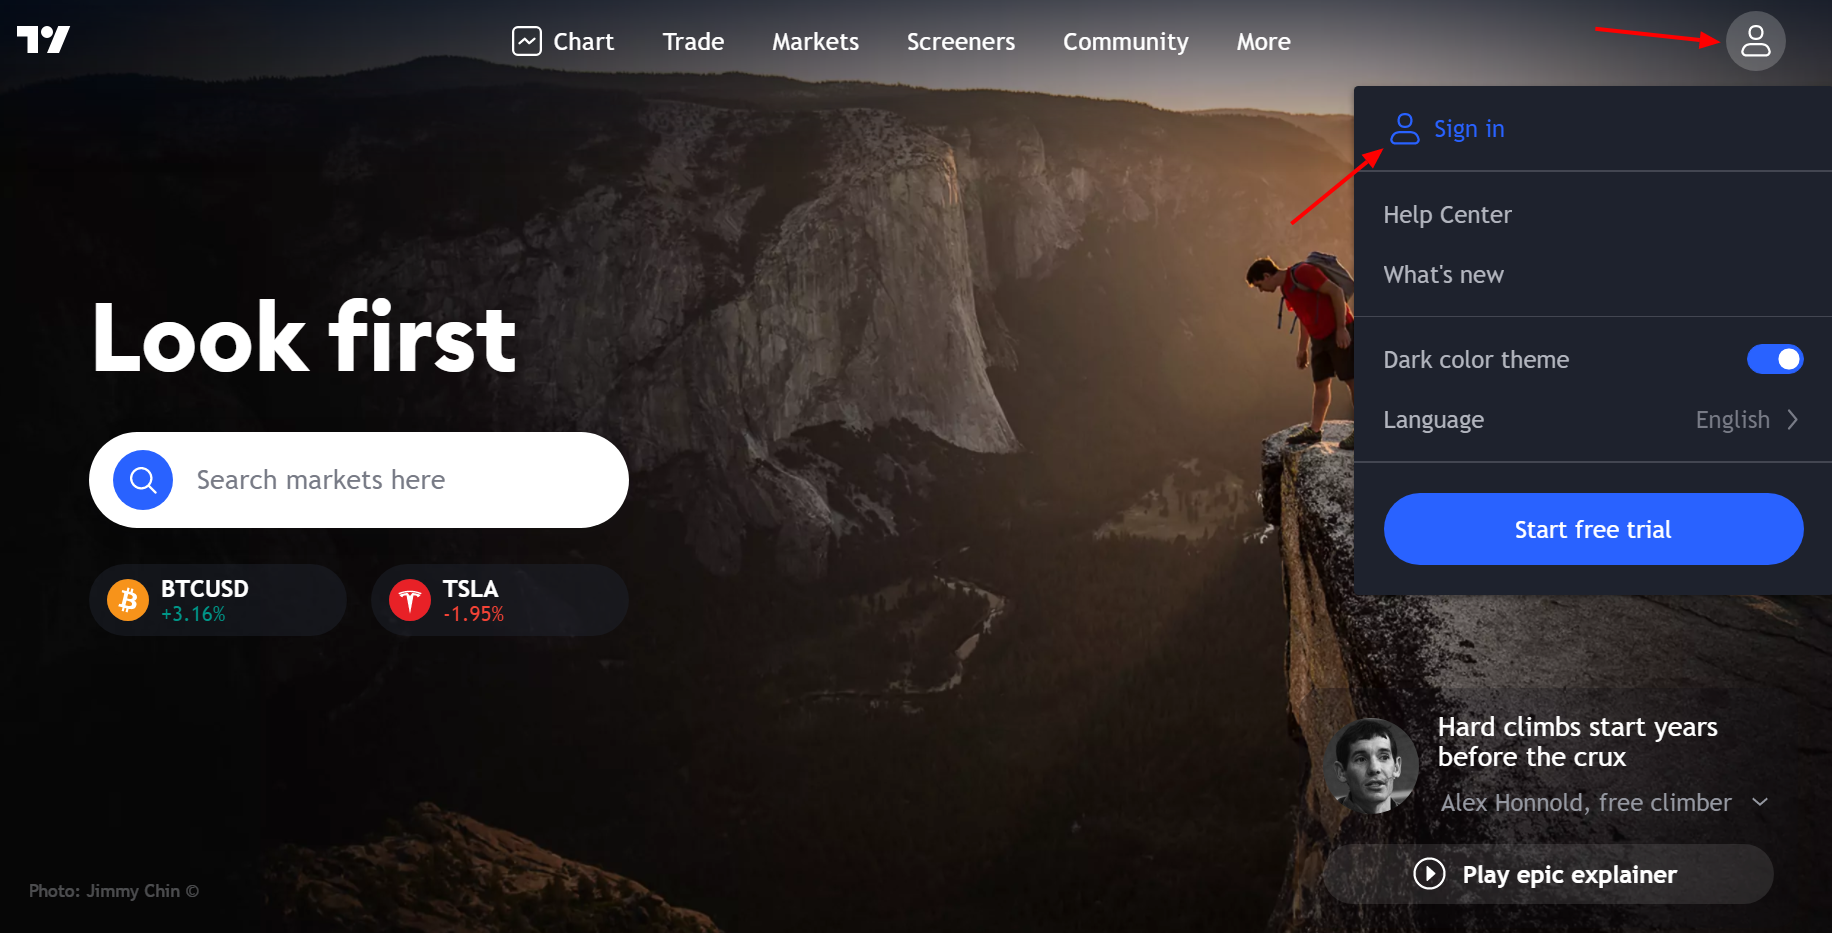
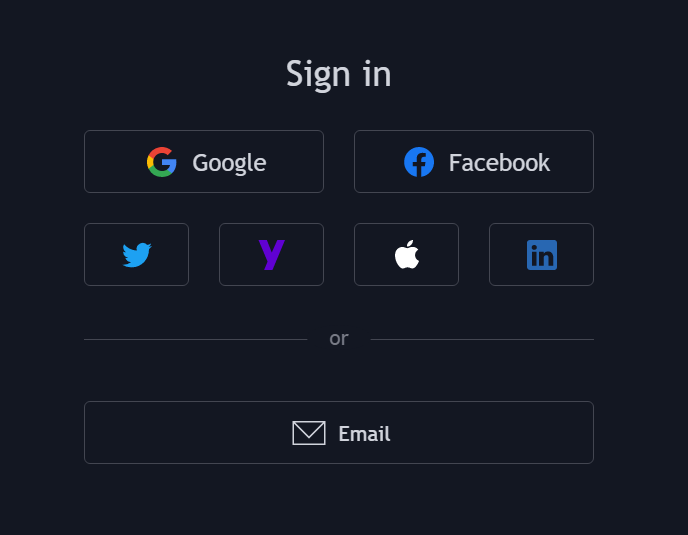
In order to create a TradingView account, you need to go to the TradingView [homepage](https://www.tradingview.com). Click on "Sign in" at the top right of the homepage, then click on "Sign up" at the bottom of the current window. You can sign up using your social media profiles or an email address.
## TradingView Charts [#tradingview-charts]
### How To Open A Chart On TradingView [#how-to-open-a-chart-on-tradingview]

You can open a chart on TradingView by clicking on 'Chart', located at the top left of the website when you are logged in.
### How To Change Symbol [#how-to-change-symbol]
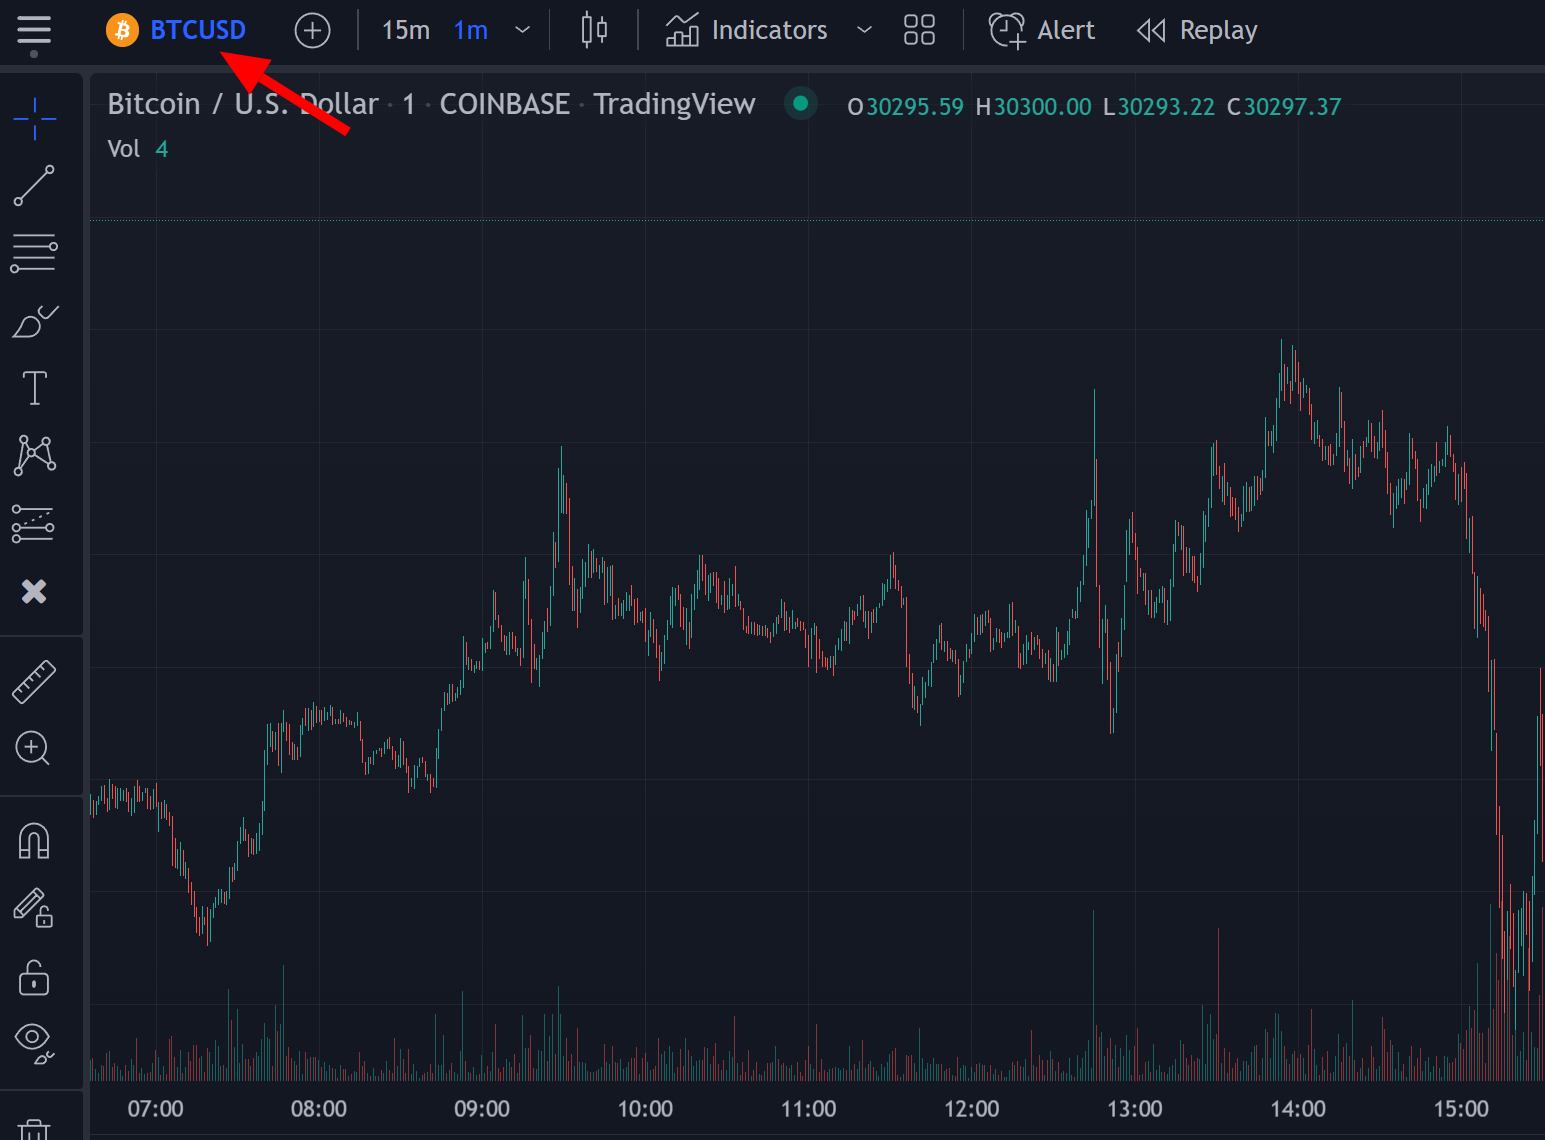
You can change the symbol of the chart by clicking on the top left section containing the current chart ticker.
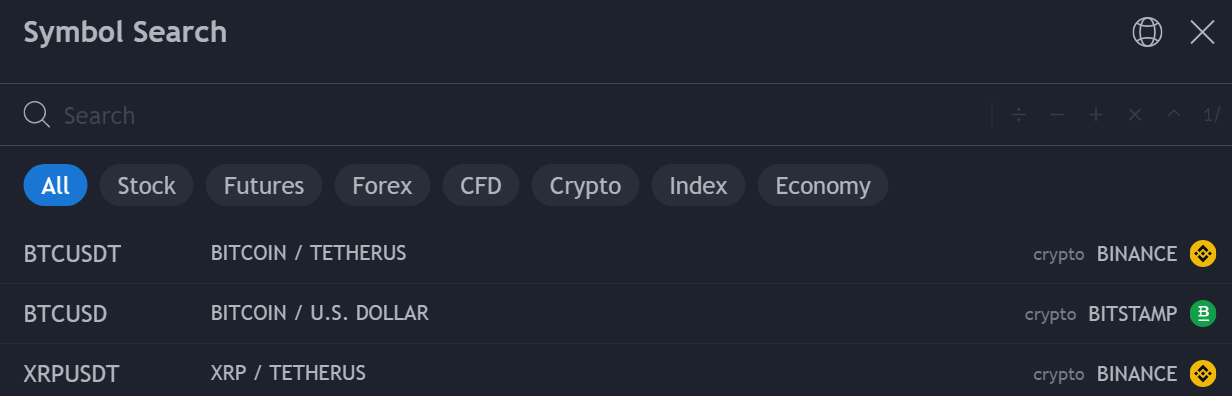
You can also directly type the name of the symbol on your keyboard.
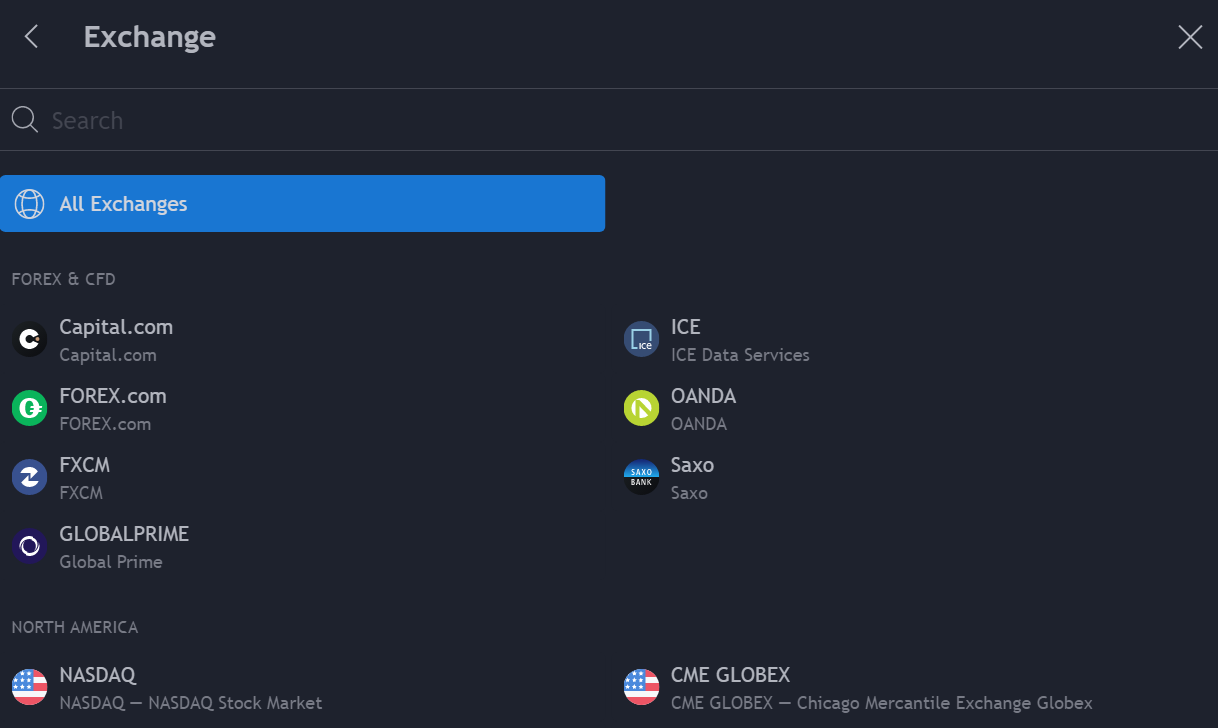
Once you click on it, you will be able to search for specific symbols. You can also filter out symbols by markets or exchange.
### Change Chart Timeframe [#change-chart-timeframe]
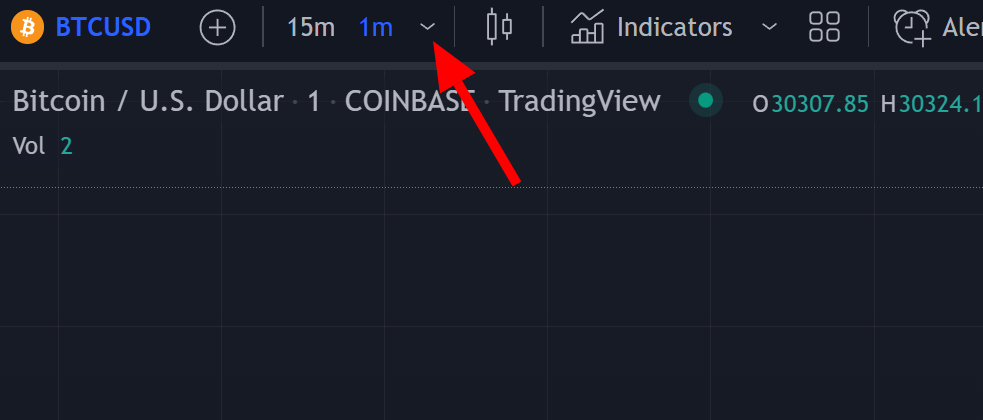
Timeframes determine the frequency at which a new candle is displayed on the chart. To change the timeframe of your chart simply click on the section at the right of the ticker name and select a timeframe of interest.
You can also type the timeframe directly on your keyboard to change it.
### Add Indicators To Your Chart [#add-indicators-to-your-chart]
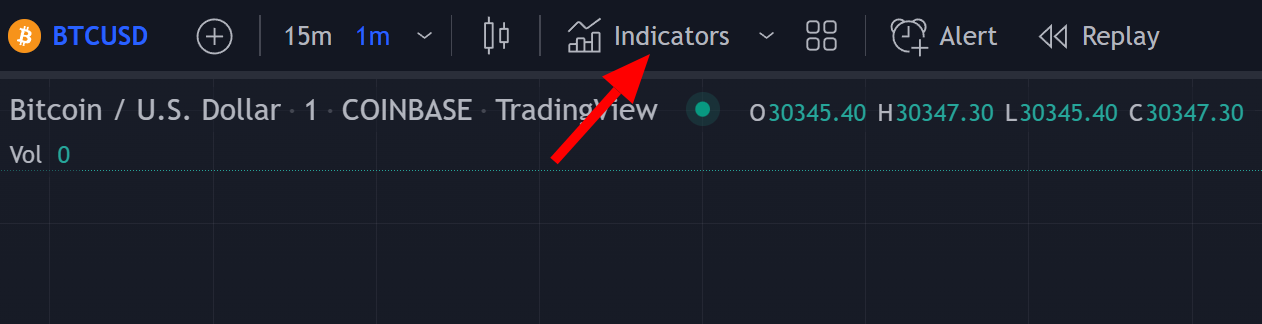
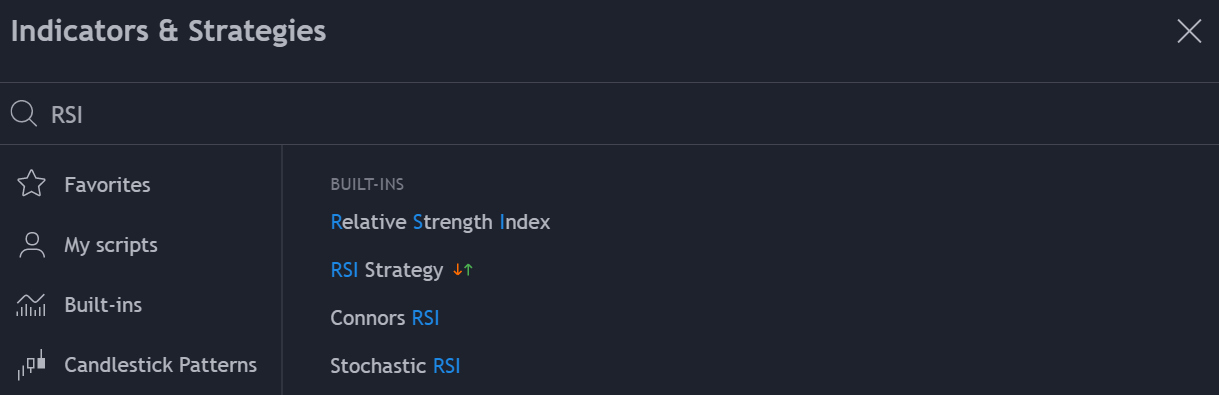
Click on the **Indicators** button at the top of the chart. This will open a menu where you can search for the indicator and click on it to add it to your chart.
### Save A Chart Layout [#save-a-chart-layout]
You can create, delete and save chart layouts on TradingView if you wish to save your indicator & chart settings on specific tickers/timeframes. Once you make a change on a layout, you will need to save these changes, all you need to do is to click on the cloud symbol at the top right of the chart.
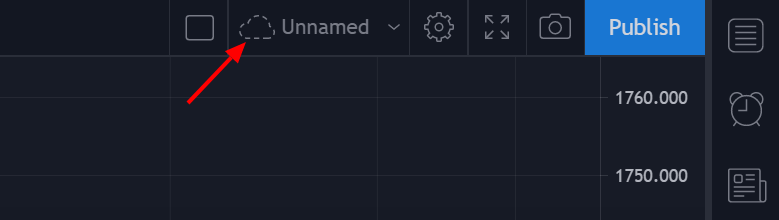
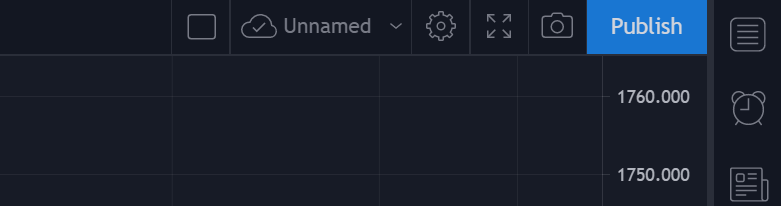
You can also save a chart layout by pressing `ctrl + s` or `cmd + s` for mac users, on your keyboard.
# What Is LuxAlgo? (/docs/getting-started/what-is-luxalgo)
LuxAlgo is the leading AI platform for generating indicators and trading strategies.
We are widely known for hosting the world’s largest open-source [Library](https://luxalgo.com/library) of trading indicators & algorithms used by millions of traders across 5+ charting platforms such as TradingView, however, this massive repository serves a higher purpose. It acts as the intelligence engine that powers our advanced AI platform for indicators and strategy creation.
We constantly automate technical analysis concepts traders use into scripts, innovate on them by building advanced algorithms, and package all of them into a streamlined AI platform. An ecosystem where traders can easily generate smarter, statistically robust strategies of their own rather than relying on someone elses research or market "edge".
## Architect Your Edge [#architect-your-edge]
Quant is our AI coding agent specialized in generating and validating Pine Script® indicators and strategies for TradingView®. Built on our extensive library of proprietary tools and frameworks, Quant transforms your trading ideas into production-ready code. Whether you're describing an indicator concept in plain language or uploading a chart screenshot, Quant leverages deep Pine Script® knowledge to architect, validate, and deploy custom trading tools instantly—no coding experience required.
## From Indicators to Intelligence [#from-indicators-to-intelligence]
LuxAlgo transforms the traditional concept of a "trading library" into an active strategy engine.
While most platforms provide disconnected tools that require users to manually guess which settings or combinations might work, our platform automates this complexity. We utilize the vast logic within our proprietary toolkits to serve as the foundation for **automated strategy generation**.
* **Automated Discovery:** Instead of manually testing hundreds of settings, our engine iterates through them to find statistically significant setups.
* **Data-Driven Decisions:** Strategies are built on concrete historical data from our advanced toolkits, not subjective chart reading.
* **Optimization:** The platform identifies the specific parameters that have historically aligned with market movements, removing the need for random trial and error.
## The LuxAlgo Advantage [#the-luxalgo-advantage]
Our advantage comes from the quality of the data feeding our platform. LuxAlgo is the only company with a proprietary library deep enough to train a specialized trading engine effectively.
The logic driving our platform is validated by the world's largest community of technical traders. Our underlying algorithms are used by **over 1 million followers** on TradingView and are developed by a team holding the rare **'Pine Wizard'** distinction. This means the strategies you generate aren't based on generic code, but on the highest-rated, most stress-tested technical trading concepts in the world.
## Why LuxAlgo AI Beats Generic Models [#why-luxalgo-ai-beats-generic-models]
A common question is: *"Can't I just use ChatGPT or generic AI to make an indicator or trading strategy myself?"*
Generic AI models (LLMs) cannot access specialized data & tools for building strategies on their own. They lack the structured environment required to build executable trading systems and often will just give you bug-filled, outdated, irrelevant Pine Script® code for TradingView. This is often seen with generic LLMs
LuxAlgo is backed by **proprietary trading intelligence** that generic AI lacks:
1. **Structured Framework:** Unlike a chatbot that writes theoretical code, LuxAlgo’s AI operates within a rigorous testing environment using our proprietary Signal & Overlay™ and Price Action™ architectures.
2. **No Hallucinations:** Our platform doesn't "invent" data. It iterates through actual, hard-coded parameters within our algorithmic trading tools to find what is mathematically valid.
3. **Actionable Output:** While a generic AI might give you a vague concept, LuxAlgo delivers a fully configured, backtested strategy ready to be deployed immediately.
# Features (/docs/quant/features)
Quant provides a comprehensive set of features designed to help you create, refine, and deploy Pine Script® indicators and strategies. This page covers the core capabilities available in the Quant interface.
## Code Generation [#code-generation]
Quant can generate complete Pine Script® code based on your natural language descriptions. When Quant generates code, it appears in a split editor view, allowing you to review the generated script alongside the chat interface. You can copy the generated code using the copy button and paste it directly into TradingView® to add the indicator to your charts.
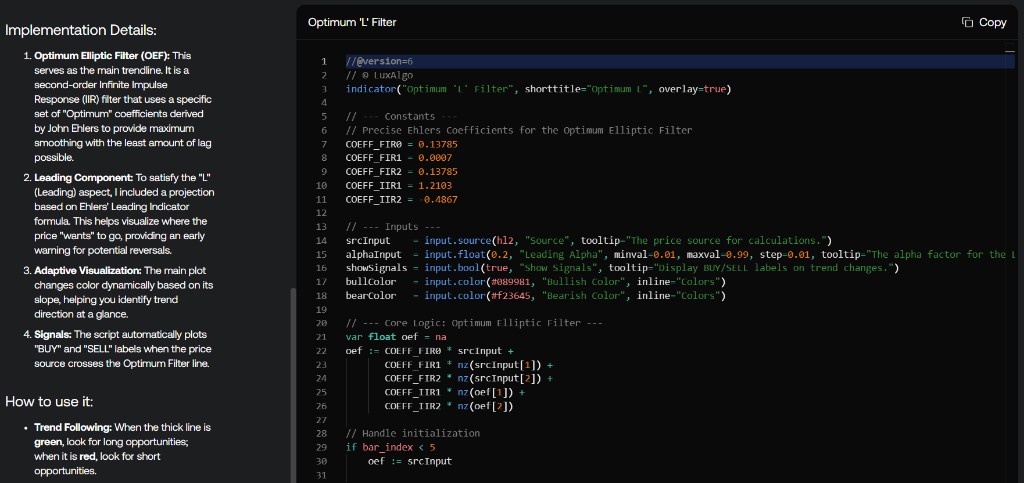
The code cannot be copied while Quant is actively generating code. Wait for the generation to complete before using the copy button.
Quant leverages its access to both TradingView scripts and LuxAlgo's proprietary script library to reliably handle niche and complex concepts. This dual knowledge base enables Quant to generate more relevant and code of higher quality.
## Instant Visualization [#instant-visualization]
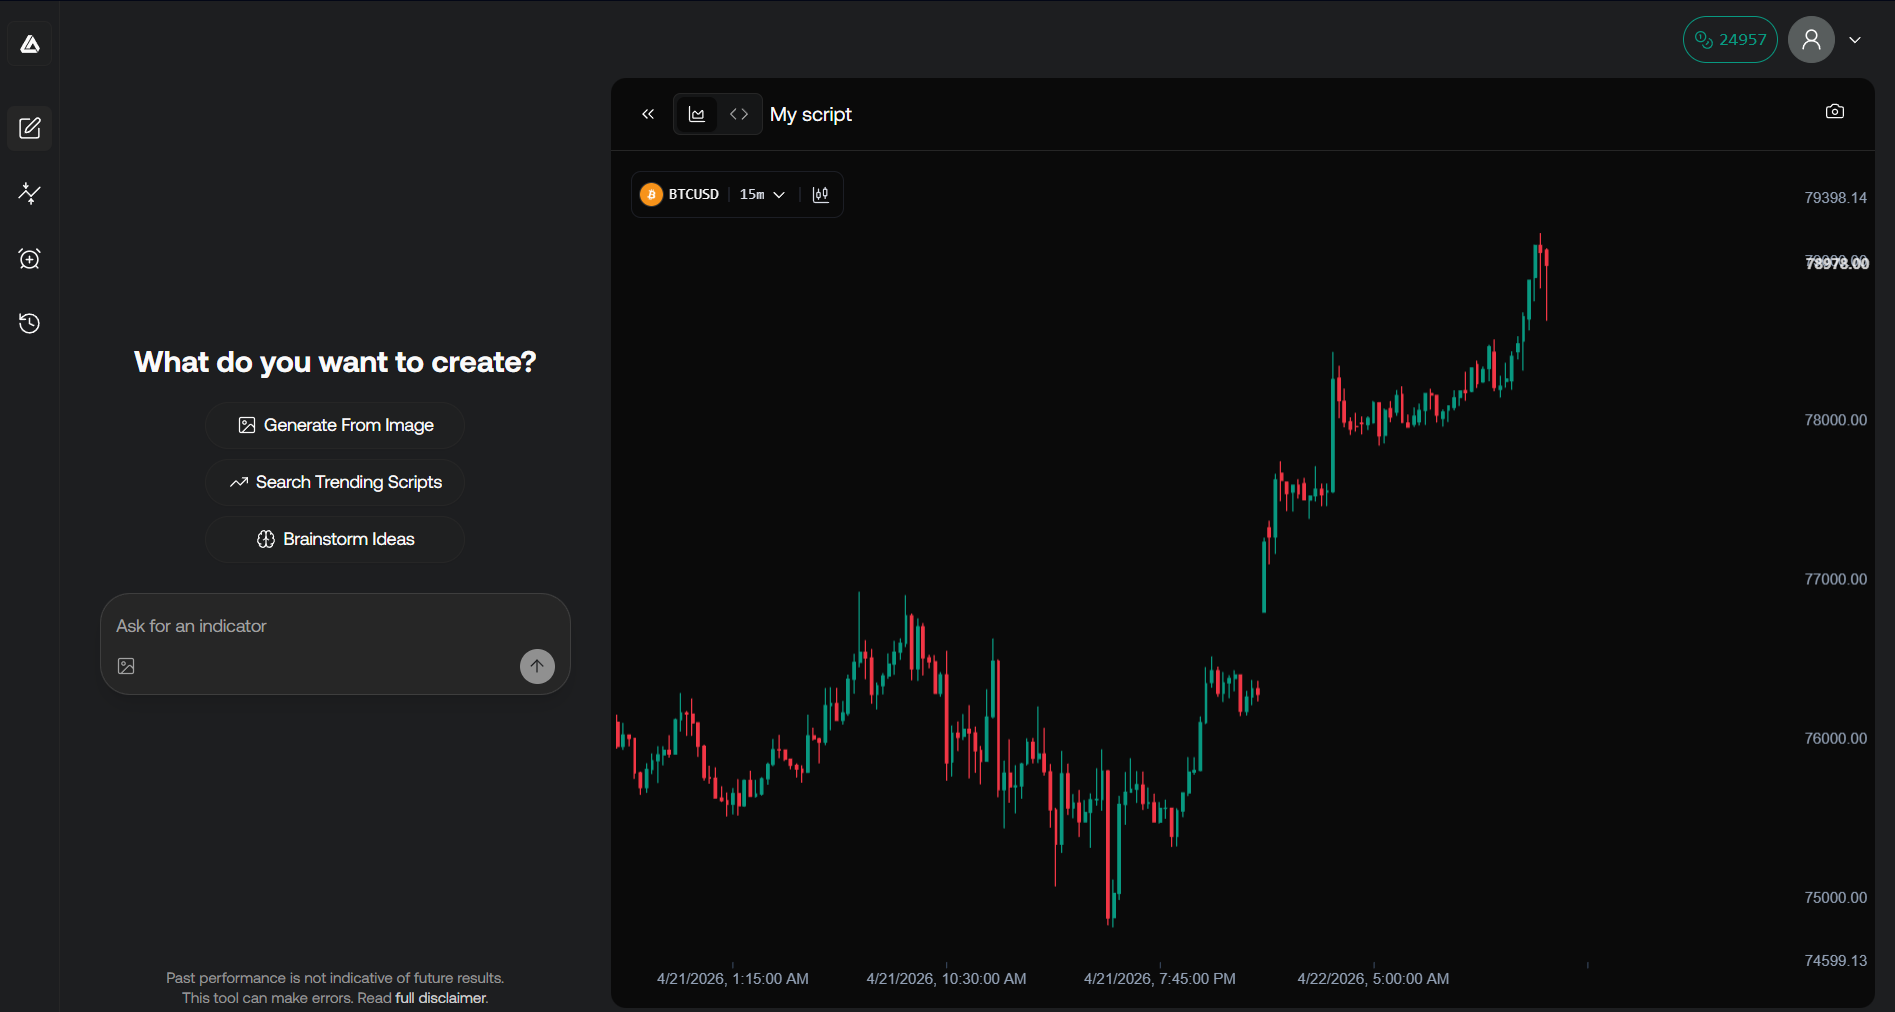
Once generated, indicators can be displayed in a chart for direct visual feedback. Strategy scripts can also be run and backtested on the chart — see [Backtesting](#backtesting).
Displayed results may differ from what could be seen on TradingView®.
Not all indicators are compatible with our chart and may only be displayed on TradingView® charts.
Users can access data from the following assets:
* Stocks
* Cryptocurrencies
* Forex
* Commodities
on the follwoing timeframes: 1 minute, 5 minutes, 15 minutes, 30 minutes, 1 hour, 4 hours, 1 day.
Due to data limitations, only completed candles are returned. Users may experience a one candle delay across assets
## Image to Code [#image-to-code]
You can upload images of indicators or chart setups, by pasting them directly in the prompt input, uploading them from the upload image button, or by clicking on "Generate From Image", and Quant will analyze the visual representation to generate Pine Script® code that reproduces the indicator's behavior as closely as possible.
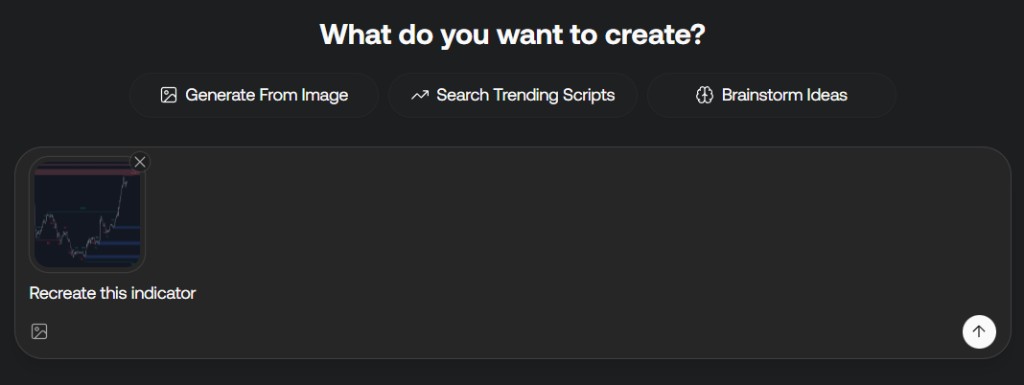
Additionally, you can send images during your conversation to provide more context or refine Quant's understanding of your requirements. This helps Quant better interpret complex visual patterns and generate more accurate code.
You can attach chart images directly to the chat input prompt from the camera icon in the chart header and clicking on "Attach to chat".
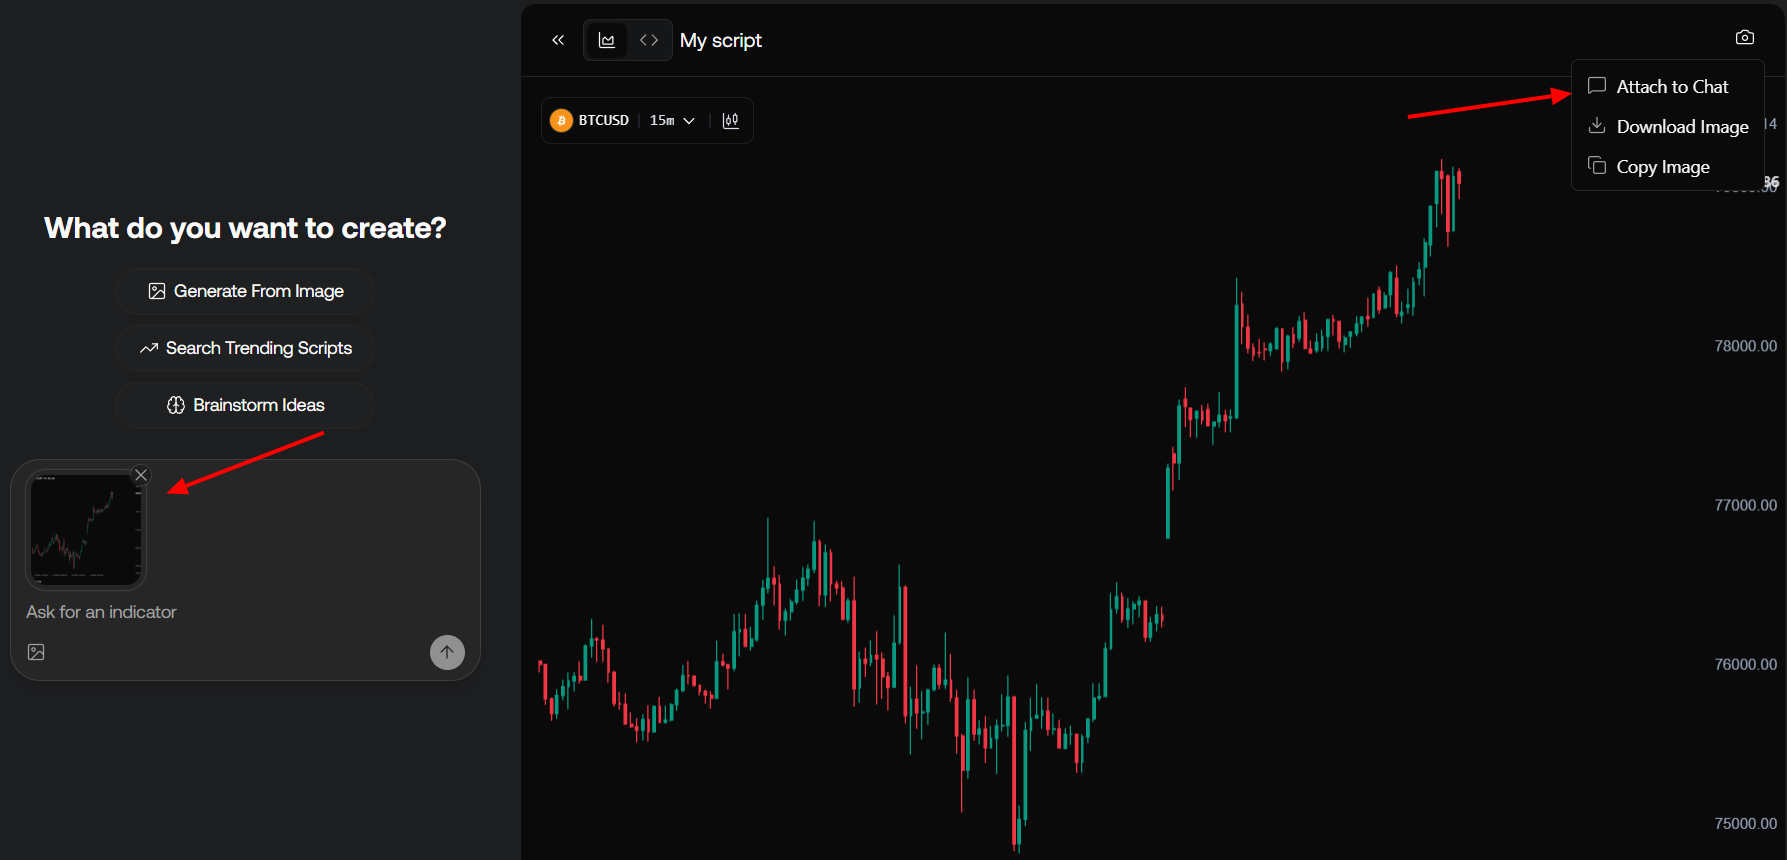
## Backtesting [#backtesting]
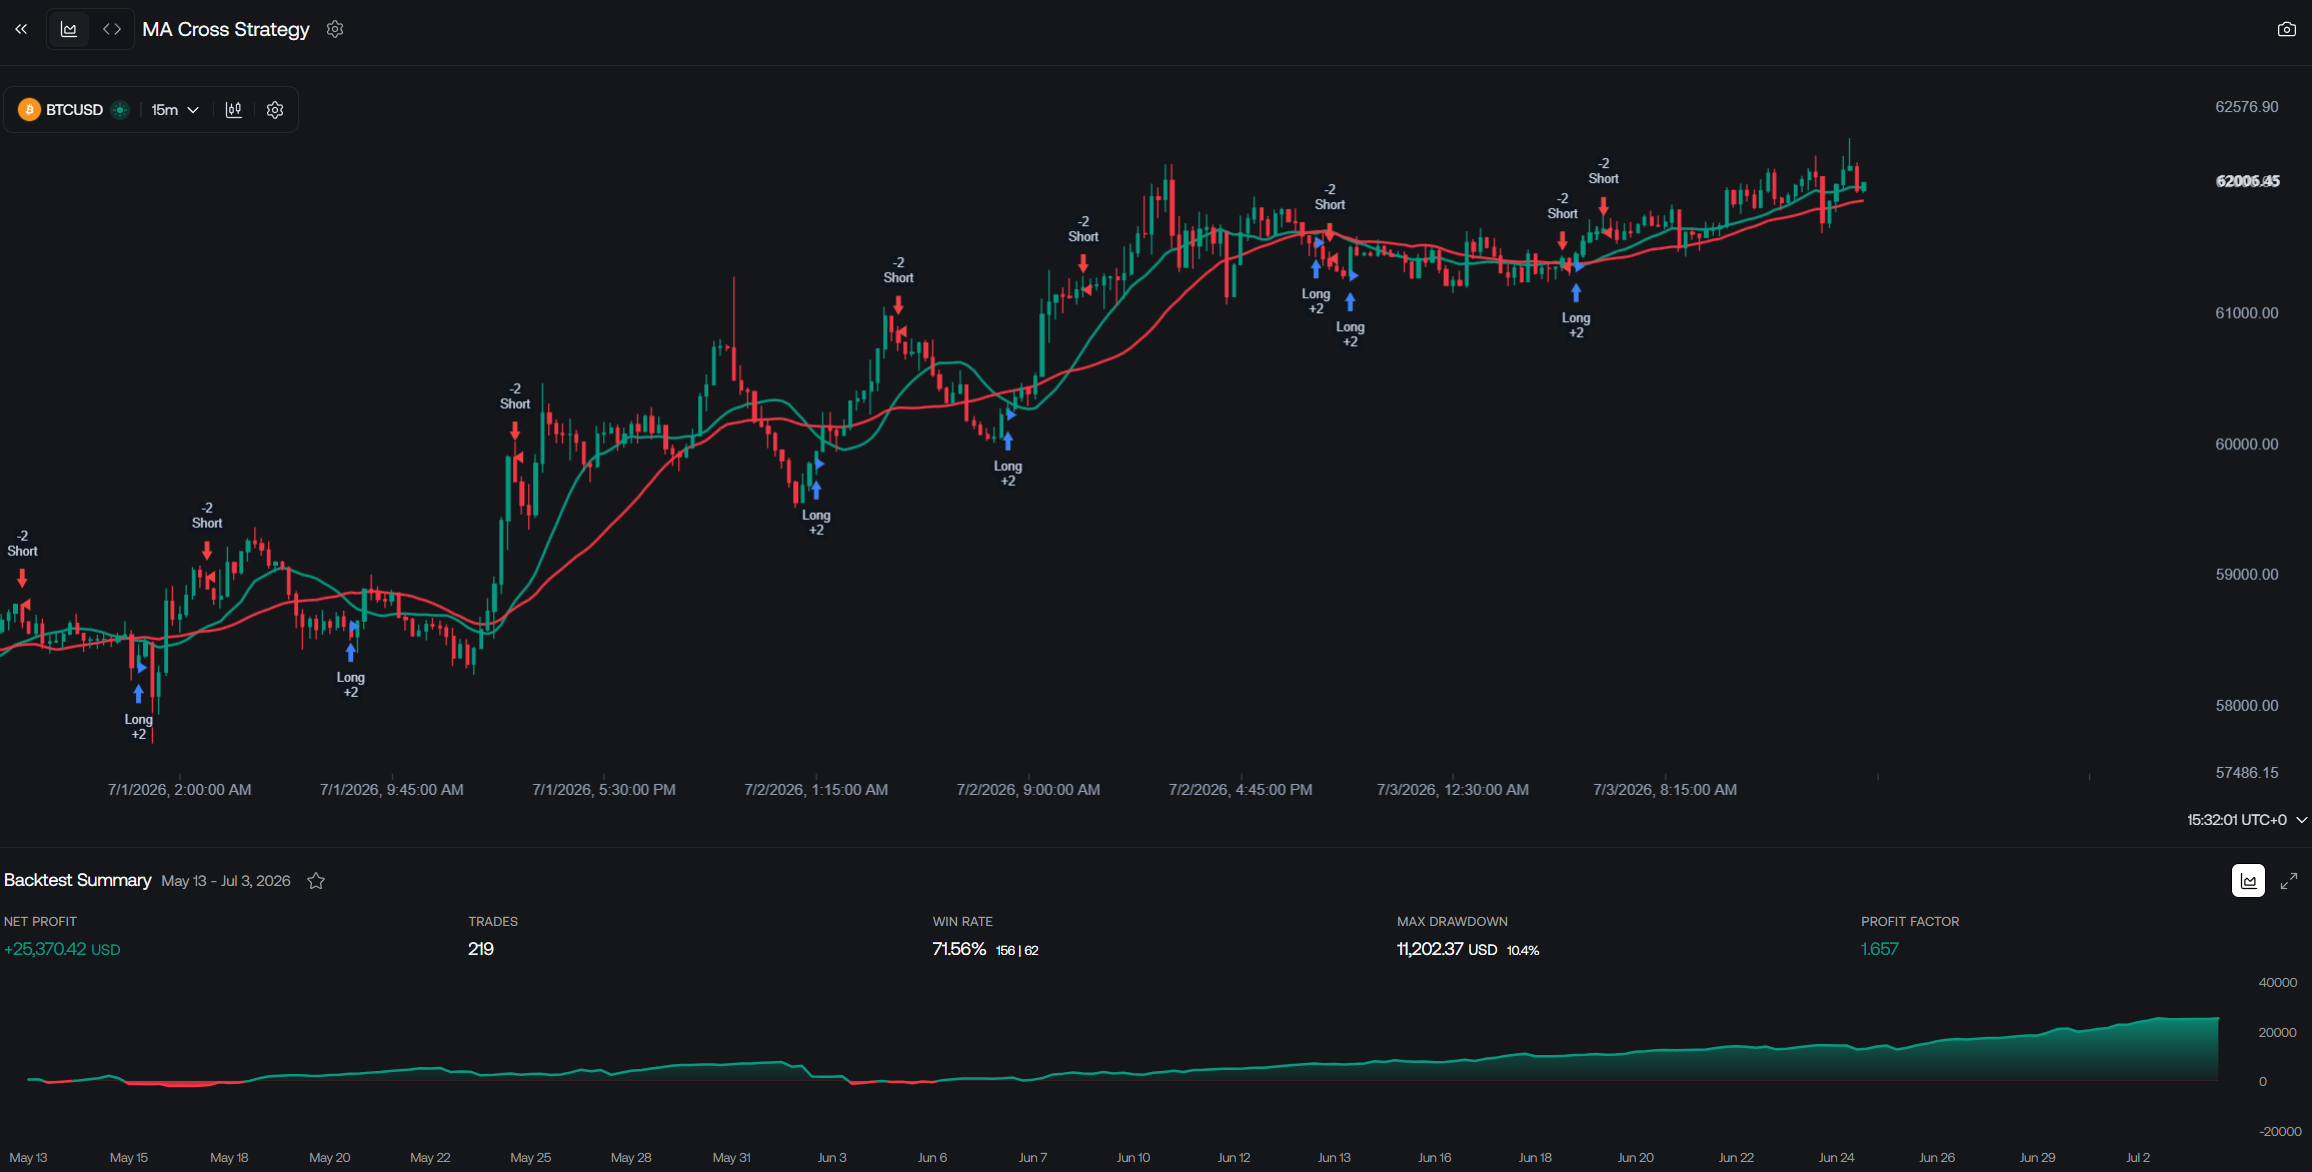
Once a script uses a `strategy(...)` declaration, running it on the chart computes trade history and performance statistics in real time—no need to copy the code to TradingView® first.
### Converting Indicators to Backtests [#converting-indicators-to-backtests]
Indicators are not backtested as-is. To evaluate an indicator's logic as a strategy, use the **Backtest** button in the toolbar, or ask Quant to convert the current indicator into a backtestable strategy. Quant rewrites the script with the appropriate `strategy(...)` declaration and entry/exit logic while preserving the original concept.
The toolbar **Backtest** action is only shown when the editor holds indicator code (not already a strategy).
### Running a Backtest [#running-a-backtest]
Click **Run** after your script is a strategy. The chart displays the strategy alongside a **Backtest Summary** strip below it, showing:
* Net Profit
* Trades
* Win Rate (with winning and losing trade counts)
* Max Drawdown (absolute and percentage)
* Profit Factor
* Historical net profit chart (toggleable)
Use the maximize button on the summary strip to open the full backtest viewer.
### Backtest Viewer [#backtest-viewer]
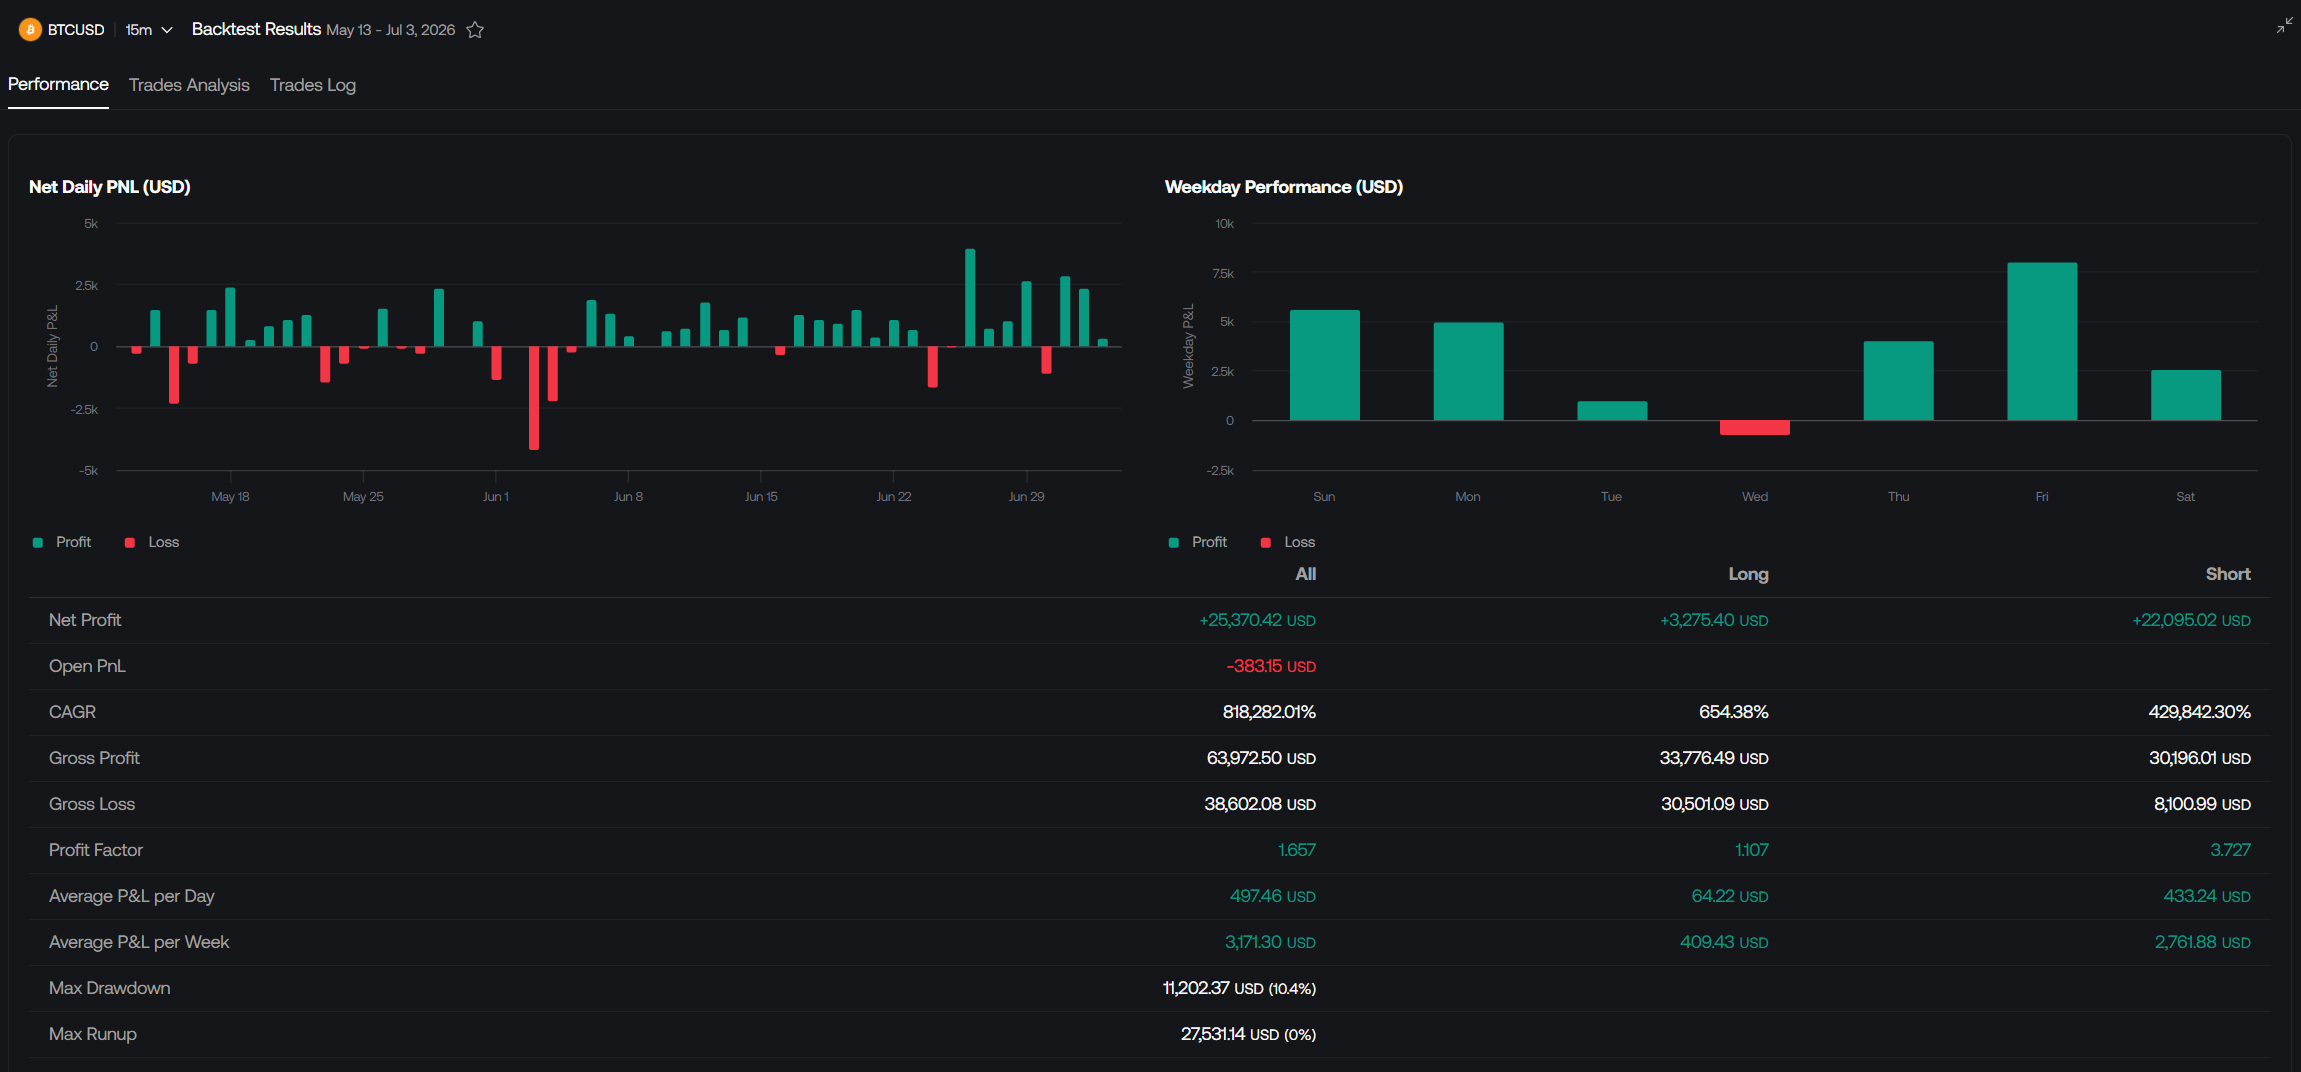
The maximized backtest viewer provides detailed analytics across three tabs:
* **Performance** — historical net profit chart, summary metrics, net daily P\&L, weekday performance, and a performance table (all trades, longs, and shorts)
* **Trades Analysis** — P\&L distribution, win rate breakdown, duration vs. P\&L scatter plot, and a trades analysis table
* **Trades Log** — a searchable trade log with entry, exit, net P\&L, and cumulative P\&L; switch to calendar view to review daily results
From the maximized viewer you can change the symbol and timeframe to re-run the backtest on different market data without leaving Quant.
### Script Settings [#script-settings]
Open the settings gear in the toolbar to tune how a strategy runs:
* **Inputs** — adjust the script's declared `input.*` parameters. Changes apply immediately and re-run the backtest, similar to TradingView®.
* **Properties** — configure backtest settings such as initial capital, default order size (quantity, base currency, or % of equity), pyramiding, commission, slippage, and margin for long and short positions.
Properties apply only to strategy scripts. Indicator scripts expose the Inputs tab when they declare inputs.
### Saving Strategies [#saving-strategies]
Save a backtest using the star icon in the summary strip or maximized viewer. Saved strategies appear in the **Saved Strategies** sidebar and include the script code, chart symbol, timeframe, input overrides, and backtest properties from the run.
From the sidebar you can open a saved Quant strategy in a new conversation (**See in Quant**) to reproduce the same tuned backtest, or inspect its backtest configuration.
Backtest results may differ from what you observe on TradingView® due to differences in market data, fill logic, or processing.
Backtests use the same assets and timeframes available in [Instant Visualization](#instant-visualization): stocks, cryptocurrencies, forex, and commodities on 1 minute, 5 minutes, 15 minutes, 30 minutes, 1 hour, 4 hours, and 1 day timeframes.
## Bug Fixing [#bug-fixing]
Quant can automatically identify and fix errors and warnings in your Pine Script® code. To fix all errors and warnings present in your script, use the "Fix with Quant" button in the editor.
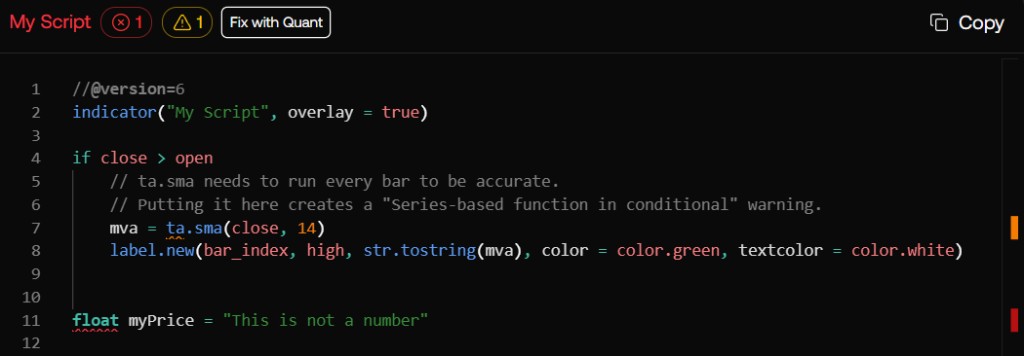
Errors prevent the script from running, while warnings won't prevent execution but may cause unexpected results.
The editor also includes error and warnings highlighting for users more used to this.
You can hover on the error or warning button to get more information about them.
### Runtime Errors [#runtime-errors]
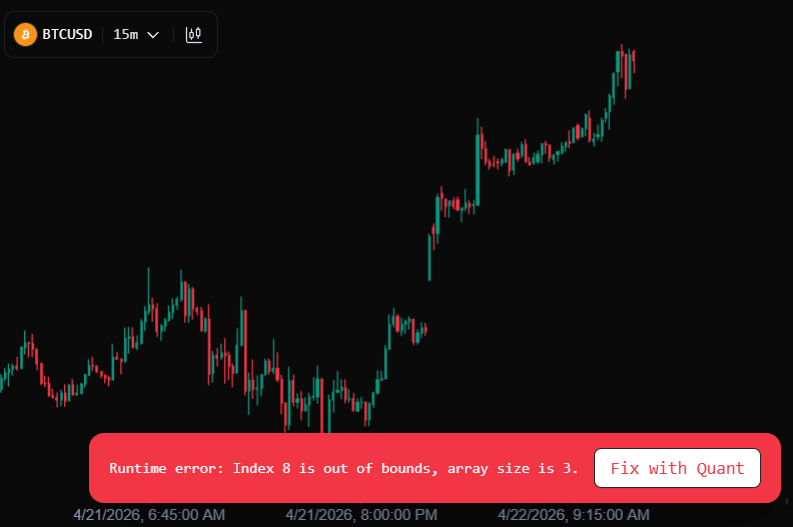
Quant can also help fix detected runtime errors. Unlike syntax errors runtime errors only appears once running the indicator over historical and/or newly formed candles.
If a runtime error is present, a message will appear at the bottom part of the chart.
## Pine Script® Help [#pine-script-help]
Quant has access to the complete Pine Script® knowledge base and can assist you with questions about Pine Script® syntax, functions, best practices, and implementation patterns. Whether you're learning Pine Script® or need clarification on specific concepts, Quant can provide accurate, context-aware answers based on official Pine Script® documentation.
## Assisted Coding [#assisted-coding]
For more experienced Pine Script® developers, Quant can assist with repetitive tasks and complex implementations. The integrated code editor is fully interactive and supports syntax/error highlighting as well as syntax completion, providing a professional coding environment.
The editor cannot be used while Quant is generating code. Wait for code generation to complete before making manual edits.
You can work collaboratively with Quant by making manual edits to the code, and Quant will learn from your changes to assist with subsequent iterations and refinements.
# Introduction (/docs/quant/introduction)
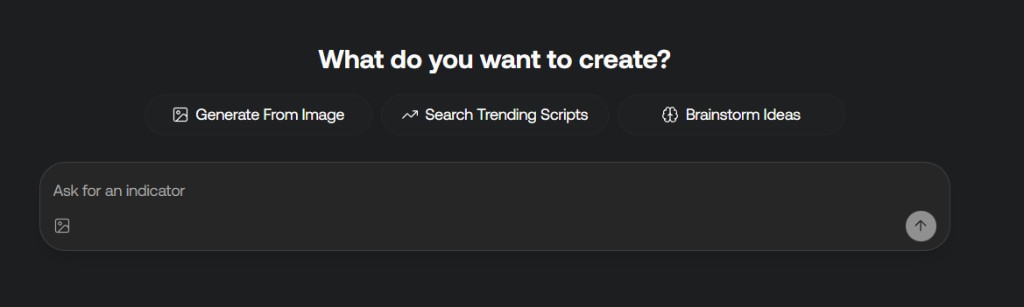
Quant is an AI coding agent specialized in generating and validating Pine Script® indicators and strategies for TradingView®. This documentation will help you understand Quant's capabilities, learn how to effectively prompt it, and troubleshoot common issues.
Quant leverages deep knowledge of Pine Script®, trading indicators, strategies, styling, and validation, built from our extensive library of tools and frameworks developed over 5+ years. This specialization makes Quant superior to generic AI chatbots for trading tool generation.
All users can access Quant [here](https://www.luxalgo.com/quant). Users with Premium and Ultimate plans benefit from higher usage limits.
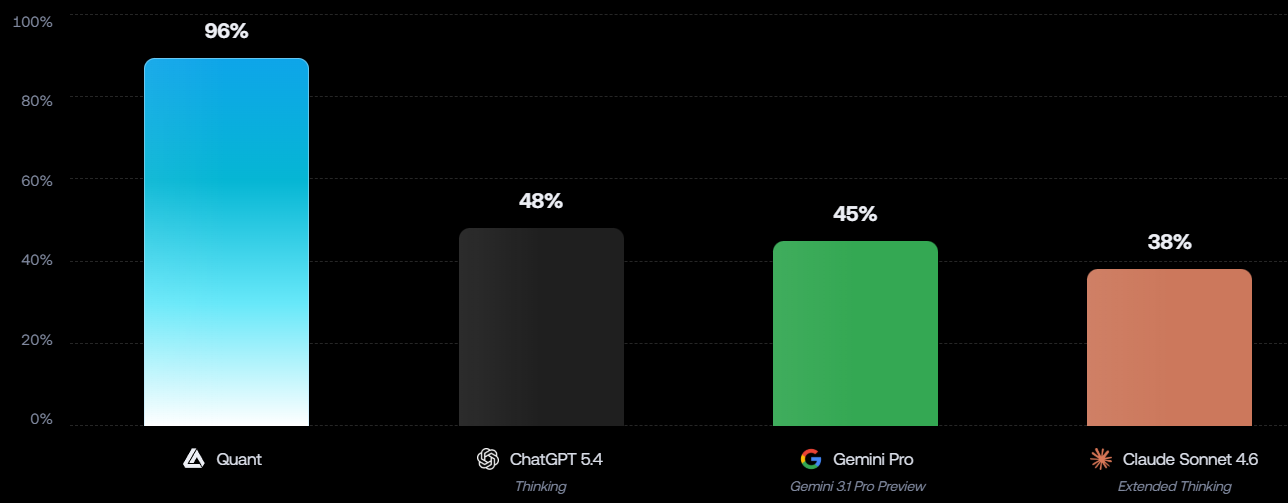
> *All 100 indicators varied in complexity. An implementation is considered failed if it contains errors (syntax or runtime), return NaN or constant unexpected values, or if the AI did not comply with the user request due to infeasability. Benchmark done on 02/21/2026.*
The chart above represents the percentage of correct implementations out of 100 total indicators amongst multiple chatbots.
## Documentation [#documentation]
## FAQ [#faq]
All users can access Quant [here](https://www.luxalgo.com/quant). Users with Premium and Ultimate plans can benefit from higher usage limits.
Credits is the currency system used to control the usage amount a user has with our AI products. The credit balance of an user is shared across both AI Backtesting platform and Quant, our Pine Script® coding agent.
User credits reset every first of the month.
Quant is fully specialized toward trading-tool generation, making it superior to existing AI chatbots that always generate bug-filled, generic indicators & strategies.
We built Quant to work with a wizard-level knowledge of Pine Script®, trading indicators, strategies, styling, and validation which was only possible from our own extensive library of tools + frameworks we've publicly released & privately hosted over 5+ years.
Yes, you can upload chart screenshots to have Quant reverse-engineer any indicator or marked up strategy into a working replica, often first try. Users can also keep iterating on it in the same chat to generate more features on top as they wish, instantly.
Yes. Quant can generate complete functional TradingView indicators from simple concepts to entire toolkits, which are validated and refined so they are ready to use on your charts.
No. You don't need to know Pine Script® to use Quant. Quant handles all the coding for you based on your requests.
Credits are consumed faster on very long conversations with Quant. We recommend starting new conversations whenever reaching a total of 50 messages.
## Disclaimer [#disclaimer]
TradingView® and Pine Script® are registered trademarks of TradingView, Inc. LuxAlgo is not affiliated with TradingView. Please read our [full disclaimer](https://www.luxalgo.com/legal/disclaimer/).
# Prompting Tips (/docs/quant/prompting-tips)
Effective prompting is key to getting the best results from Quant. Follow these tips to generate high-quality Pine Script® code efficiently.
## Start Simple [#start-simple]
Say what you want to build in plain language.
**Examples:**
* "A RSI oscillator with signals."
* "An order block detector with breakout signals."
This gets you moving fast and gives the agent something concrete to scaffold.
## Be Specific About the "Result" [#be-specific-about-the-result]
Tell Quant what "done" looks like:
* Expected indicator behavior under specific scenarios
* How the indicator should look like, with explicit mention of plot/label/line styles, colors, linewidth...etc
* Tell Quant if the indicator should appear on the chart, or in its own pane
You can use images to provide a more direct answer about what the output should look like.
## Break Big Work Into Small Steps [#break-big-work-into-small-steps]
Asking Quant to build a complex indicator/strategy/toolkit in a single shot will generally lead to poor results.
Instead of "build the whole toolkit," do:
* "Start with element A."
* "Add element B"
* "Add element C"
* "Add alerts"
Incremental prompts reduce bugs, and provide checkpoints you can comeback to.
## Ask the Agent to Plan When It's Complex [#ask-the-agent-to-plan-when-its-complex]
If you're not sure about the indicator architecture:
> "Break this indicator into steps and propose a plan to achieve it"
Then implement step-by-step.
## Iterate with Targeted Follow-ups [#iterate-with-targeted-follow-ups]
After the first output, request one change per message:
* "Add moving average to x."
* "Add alert on condition x."
* "Add tooltip to these inputs..."
This keeps iterations clean and predictable.
# Alerts (/docs/ai-backtesting/backtesters/alerts)
## Backtester Alerts [#backtester-alerts]
| Buy Alerts | Sell Alerts |
| :--------------------------------------: | :---------------------------------------: |
| 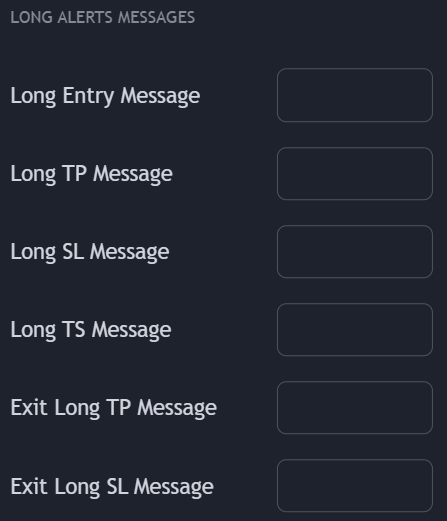 | 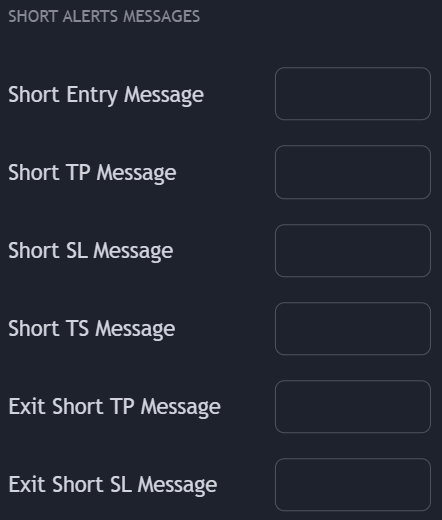 |
Users can get alerted for any action executed by a strategy, from opening positions to closing them. The way alerts work is the same across all the Backtester scripts.
The message field in the **Alert Messages** setting section of each Backtester allows for the strategy to send a custom alert message depending on the action taken by the strategy, if no messages are set the strategy will send default messages.
In order for alerts to return custom user set messages the `{{strategy.order.alert_message}}` should be set on the message field of the Tradingview alert menu.
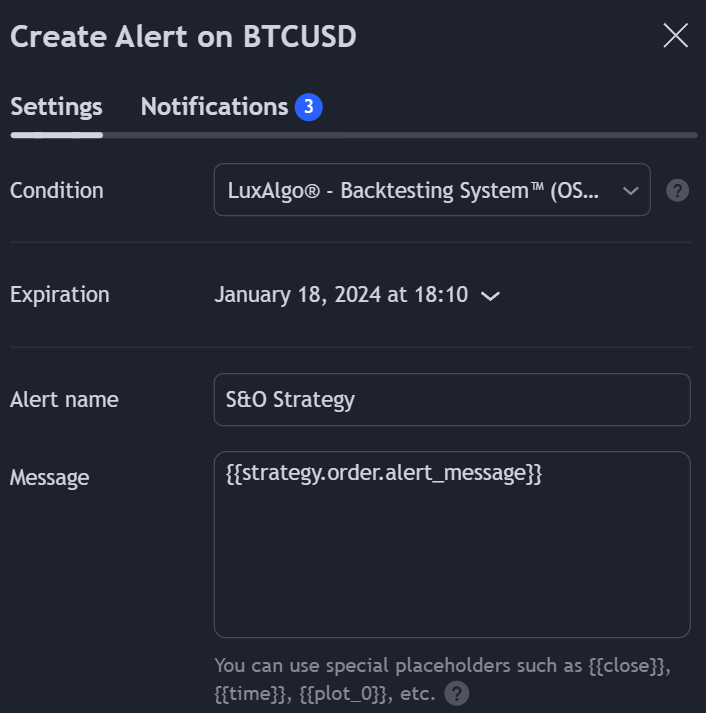
Backtester (PAC) does not have Exit Long/Short TP/SL alerts, instead only having Exit Long/Short
## Alerts Placeholders [#alerts-placeholders]
Users can use placeholders in the messages set from the **Alert Messages** setting section to return market data, take profit/stop losses values, chart ticker and timeframe...etc.
| Placeholder | Description |
| :----------------------------------------------------: | :------------------------------------------------------------------------------------------------------------: |
|
`{open}`
|
Current opening price
|
|
`{high}`
|
Current high price
|
|
`{low}`
|
Current low price
|
|
`{close}`
|
Current closing price
|
|
`{volume}`
|
Current volume
|
|
`{time}`
|
UNIX timestamp (in milliseconds) of the bar opening time
|
|
`{timenow}`
|
UNIX timestamp (in milliseconds) of the current bar time
|
|
`{ticker}`
|
Chart ticker (e.g: for BINANCE:BTCUSDT the ticker name is BTCUSDT)
|
|
`{prefix}`
|
Ticker prefix (e.g: for BINANCE:BTCUSDT the ticker prefix is BINANCE)
|
|
`{timeframe}`
|
Chart timeframe
|
|
`{tp}`
|
Take profit value
|
|
`{sl}`
|
Stop loss value
|
In order to function properly, `{timenow}` requires the strategy to recalculate on everytick.
This can be enabled from the strategy settings -> Properties -> RECALCULATE
If not enabled `{timenow}` will act like `{time}`.
Example:
New long entry generated at `{time}` and price `{close}` on `{ticker}{timeframe}` with take profit `{tp}` and stop loss `{sl}`
# Forecasting (/docs/ai-backtesting/backtesters/forecasting)
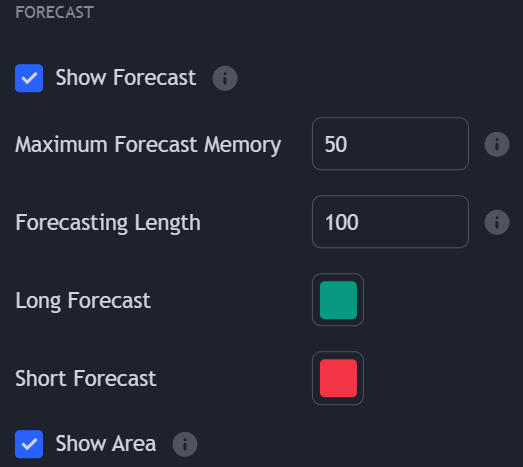
Being able to anticipate where price might evolve after a trade can be useful to plan potential exit points, set take profits/stop loss as well as knowing when user set ones might get hit...etc.
All Backtesters include a forecasting tool able to provide forecasts from the most recent trade executed by the backtester.
## Using Forecasts [#using-forecasts]
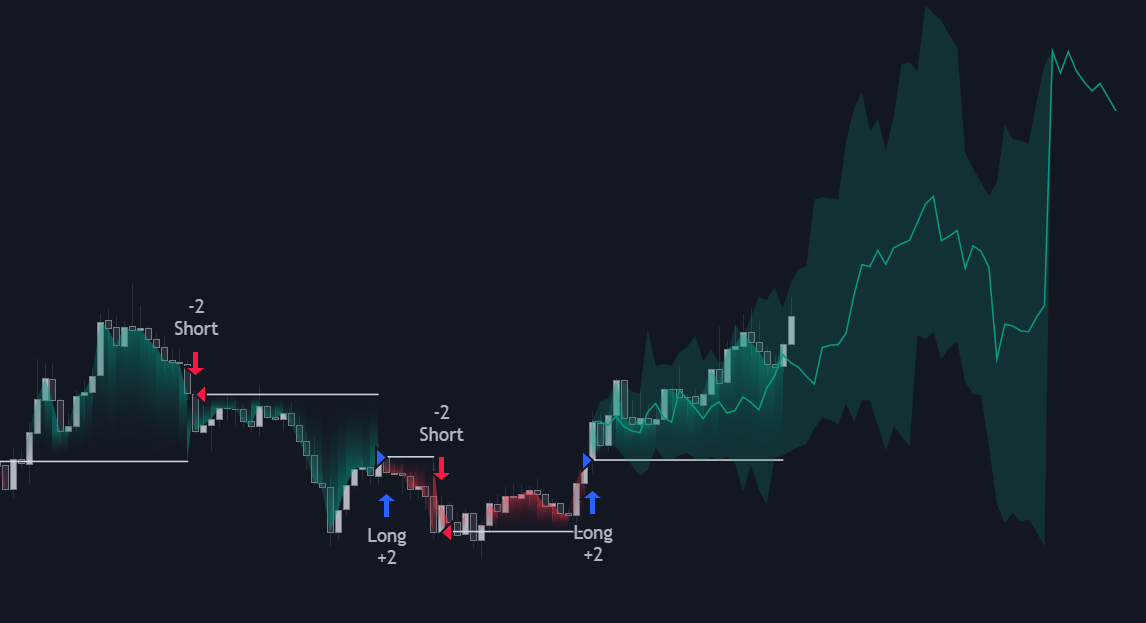
Forecasts can be enabled from the "FORECAST" settings group by enabling the "Show Forecast" toggle.
Each forecast is influenced by the price evolution made during previous respective long and short trades, as such forecasts for long positions are different from the ones of short positions.
Users can select the maximum length of forecast using the "Forecasting Length" setting.
Because of the forecasting algorithm used, forecasts can have a lower length than the one selected by the user depending on the average bars in trade.
Very frequent trades will generally return short price forecasts due to the lack of available data.
### Forecasting Area [#forecasting-area]
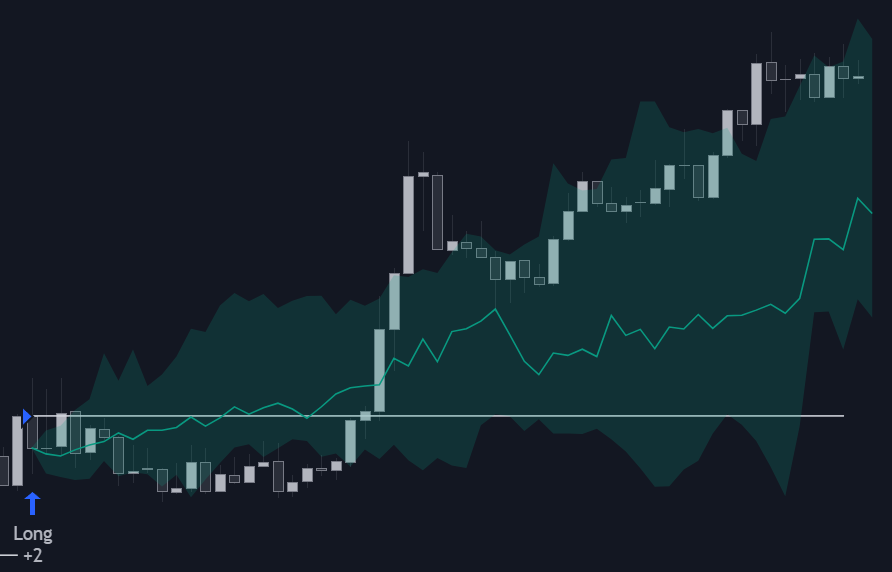
By default, forecasts are displayed alongside an area, indicating where future prices might evolve. The area extremities can help users potentially determines exit points with there interaction with the price, but can also help reference the performance of a current trade relative to past trades.
Areas extremities are representative of past trades performances. For example:
* For long positions: A lower extremity not significantly going below the entry price can indicate good past performance for long positions.
* For short positions: An upper extremity not significantly going above the entry price can indicate good past performance for short positions.
If an area is no longer visible in a point in time of the forecast it means that there is not enough data for that point in time.
### Forecasting Memory [#forecasting-memory]
Users can control the influence older trades have on the forecast using the "Maximum Forecast Memory" setting, with lower values using a shorter term memory, discarding older information more quickly.
Low values of this setting allow obtaining more diverse forecasts for new trades, while higher values will return forecasts less subject to change over time.
### Take Profits Levels From Forecast [#take-profits-levels-from-forecast]
When forecasts are displayed, users can set take profits using the **nth** percentile of a returned forecast. This can be done from the "TPS & SLS" settings, by selecting "Forecast" in the "Long TP" and/or "Short TP".
The numerical setting selected at the right of the drop-down menus determines the percentile used, and should be set within the range \[0, 100] in order to work. Percentiles values can affect the returned levels as follows:
* In case of a long trade, a lower set percentile will return take profits closer to the entry price, potentially triggering sooner.
* In case of a short trade, a lower set percentile will return take profits further away from the entry price, potentially triggering later.
Do note that because forecasts are based on the strategy entries, take profits levels based on it can be subject to repainting, except when using a backtesting window based on a date.
# Actions & Methods (/docs/algos/alert-scripting/actions-methods)
Actions are elements tied to a user set condition producing a specific effect when the assigned condition is true. These allow users to have more control over their scripted alert, from invalidating sequences, to plotting graphical elements on the chart.
Actions have the structure `@keyword()`, starting with `@`, with an identifier, and `()`.
Some actions can have a condition assigned to them using `=`. When the assigned condition is true the action will be executed.
Like functions in classical programing languages, actions can have arguments located within `()`, adding further degrees of control over the action.
On the other hand, **methods** work similarily but are tied to a UDP, changing its properties.
This page lists out the available actions and methods syntax as well as their utility.
***
## @alert [#alert]
The `@alert` action allows users to get alerted when the associated condition is true.
### Syntax [#syntax]
```js
@alert("message")
```
### Arguments [#arguments]
**message** (string): Optional. Alert message used by the alert. Data placeholders can be used, these will be replaced by their corresponding value when the alert triggers. If not provided will use the associated condition.
### Examples [#examples]
```js
// Send an alert when close > open
@alert("close is greater than open") = {close} > {open}
```
```js
// Send an alert when close > open, with alert message returning the closing price value
@alert("price is {close}") = {close} > {open}
```
### Remarks [#remarks]
In order for the alert to trigger, users must create an alert using as condition "any alert() function call".
***
## @label [#label]
The `@label` action allows users to draw labels on the toolkit pane when the associated condition is true.
### Syntax [#syntax-1]
```js
@label(y, text, text_color, color, style, size)
```
### Arguments [#arguments-1]
**y** (placeholder or value): Optional. Location of the label. Accepts data placeholders as values. Default is `{close}` for toolkits appearing on the chart, and 50 for the **Oscillator Matrix®** toolkit.
**text** (string): Optional. text displayed on the label. Default text is the condition.
Placeholders can be used within the text, these will be replaced with the corresponding value. For example:
```
@label(text="closing price: {close}")
```
**text\_color** (color): color of the text displayed on the label. Possible values include:
```
"black", "silver", "gray", "white", "maroon", "purple", "fuchsia", "green", "red", "lime", "olive", "yellow", "navy", "blue", "teal", "aqua", "orange", "transparent", "chart.bg_color", "chart.fg_color"
```
Default is the chart background color `"chart.bg_color"`.
**color** (color): Optional. color of the label. Possible values include:
```
"black", "silver", "gray", "white", "maroon", "purple", "fuchsia", "green", "red", "lime", "olive", "yellow", "navy", "blue", "teal", "aqua", "orange", "transparent", "chart.bg_color", "chart.fg_color"
```
Default is the color to the chart background `"chart.fg_color"`.
**style** (string): Optional. Shape of the displayed label, possible values include:
* `"none"`
* `"xcross"`
* `"cross"`
* `"triangleup"`
* `"triangledown"`
* `"flag"`
* `"circle"`
* `"arrowup"`
* `"arrowdown"`
* `"label_up"`
* `"label_down"`
* `"label_left"`
* `"label_right"`
* `"label_lower_left"`
* `"label_lower_right"`
* `"label_upper_left"`
* `"label_upper_right"`
* `"label_center"`
* `"square"`
* `"diamond"`
Default is `"label_down"`
**size** (string): Optional. Size of the displayed label. Possible values include:
* `"auto"` (automatically size the label based on the screen resolution)
* `"tiny"`
* `"small"`
* `"normal"`
* `"large"`
* `"huge"`
### Examples [#examples-1]
```js
// Draw a label when close > open
@label(y={close}, text="Up", text_color="white", color="green", style="label_up", size="small") = {close} > {open}
```
***
## @line [#line]
The `@line` action allows users to draw lines on the toolkit pane when the associated condition is true.
### Syntax [#syntax-2]
```js
@line(x1, y1, x2, y2, color)
```
### Arguments [#arguments-2]
**x1** (integer): Optional. Data placeholder of the x1 coordinate of the line or a constant integer determining how far ahead/behind from the current bar the x1 coordinate is located. Accepts negative values. Default is `0`.
**y1** (placeholder): Optional. y1 coordinate value of the line. Accepts data placeholders as values. Default is `"{close}"` except for the **Oscillator Matrix®** which uses 50.
**x2** (integer): Optional. Data placeholder of the x2 coordinate of the line or a constant integer determining how far ahead/behind from the current bar the x2 coordinate is located. Default is `0`.
**y2** (placeholder): Optional. y2 coordinate value of the line. Accepts data placeholders as values. Default is `"{close}"` except for the **Oscillator Matrix®** which uses 50.
**color** (color): Optional. color of the label. Possible values include:
```
"black", "silver", "gray", "white", "maroon", "purple", "fuchsia", "green", "red", "lime", "olive", "yellow", "navy", "blue", "teal", "aqua", "orange", "chart.bg_color", "chart.fg_color"
```
Default is `"blue"`.
### Examples [#examples-2]
```js
// Draw line if closing price cross over closing price 10 bars ago
@line(x1= -10, y1= {low}, x2= 10, y2= {high}, color= "green") = {close} crossover {close[10]}
```
```js
// Draw line if closing price cross over closing price 10 bars ago
@line(x1={barindex[10]}, y1={low}, x2={barindex}, y2={high}, color="green") = {close} crossover {close[10]}
```
***
## @valuewhen [#valuewhen]
Plot a user set value on the chart when the assigned condition is true.
### Syntax [#syntax-3]
```js
@valuewhen(source, reference)
```
### Arguments [#arguments-3]
**source** (placeholder): Optional. Value to plot when the assigned condition is true. Default is `{close}` except for the **Oscillator Matrix®** which uses 50.
**reference** (string): Optional. Placeholder string used to reference the value in the script.
### Examples [#examples-3]
```js
// Plot {high} when close crossover open
@valuewhen({high}) = {close} crossover {open}
```
```js
// Record the value of {high} when close crossover open
// Reuse the value as y coordinate for label
@valuewhen({high}, "{cross_high}") = {close} crossover {open}
@label({cross_high}) = {close} > {open}
```
### Remarks [#remarks-1]
The plot for `@valuewhen` is accessible as input for other scripts with name "@Valuewhen", also allowing users to create alerts using it.
When multiple `@valuewhen` actions are defined the last one in the script will be ploted.
When specifying a reference placeholder in `@valuewhen`, the value will not be ploted.
## Methods [#methods]
Methods are similar to actions however they directly affect specific user set UDP's, changing their properties. We say that methods are **attached** to UDP's.
Methods have the structure `{udp}.keyword()`, with an UDP followed by `.` then an identifier `keyword`, and `()`.
Some methods can have a condition assigned to them using `=`. When the assigned condition is true the method will be executed.
### `invalidate` [#invalidate]
Invalidate the UDP when the trigger condition is true.
#### Syntax [#syntax-4]
```js
{udp}.invalidate(step)
```
#### Arguments [#arguments-4]
**step** (integer, integer list): Optional. Step to consider for invalidation, supports multiple values. If no steps are provided all steps will be considered for invalidation.
#### Examples [#examples-4]
```js
// Invalidate sequence if opening price is lower than previous low
{my_sequence}.invalidate() = {open} < {low[1]}
// Define sequence:
// step 1: closing price is above opening price
// step 2: closing price is above previous high
{my_sequence} = {close} > {open} then {close} > {high[1]}
```
Example evaluating our invalidation condition on a specific step:
```js
// Invalidate sequence if closing price is lower than opening price
// when we are evaluating the second step (step=1)
{my_sequence}.invalidate(step=1) = {close} < {open}
// Define sequence:
// step 1: closing price is above opening price and volume is above 500
// step 2: closing price is above opening price and volume is above 1000
// step 3: closing price is under opening price
{my_sequence} = {close} > {open} and {volume} > 500 then {close} > {open} and {volume} > 1000 then {close} < {open}
```
Example evaluating our invalidation condition on multiple step:
```js
// Invalidate sequence if closing price is lower than opening price
// when we are evaluating the second, third, and fourth step (step=1,2,3)
{my_sequence}.invalidate(step=1,2,3) = {close} < {open}
// Define sequence:
// step 1: closing price is above opening price and volume is above 500
// step 2: closing price is above opening price and volume is above 1000
// step 3: closing price is above opening price and volume is above 1500
// step 4: closing price is above opening price and volume is above 2000
// step 5: closing price is under opening price
{my_sequence} = {close} > {open} and {volume} > 500 then {close} > {open} and {volume} > 1000 then {close} > {open} and {volume} > 1500 then {close} > {open} and {volume} > 2000 then {close} < {open}
```
#### Remarks [#remarks-2]
The `invalidate` method can work similarily to inline invalidation using the operator `!`.
Consider that the order at which the `invalidate` method is used matters, for example if the method is defined after the UDP it affects then the sequence can complete before invalidation takes place. On the other if you want invalidation to take place first the `invalidate` method should be defined before the affected UDP.
***
### `set_step` [#set_step]
Set the UDP sequence step to a user defined value, or increase/decrease the current set by a user set increment/decrement.
#### Syntax [#syntax-5]
```js
{udp}.set_step(value)
```
#### Arguments [#arguments-5]
**value** (integer): New value of the step. Users can also increase the current step value using `+` as prefix, e.g: `+1`, or decrease it using `-` as prefix, e.g: `-1`.
#### Example [#example]
```js
// Define UDPs
{bull} = {close} > {open}
{bear} = {close} < {open}
{bull+} = {close} > {high[1]} and {bull}
{bear+} = {close} < {low[1]} and {bear}
// Define sequence
{my_sequence} = {bull} then {bear} then {bull+} then {bear+}
// Reset sequence to corresponding step
{my_sequence}.set_value(0) = {bull} // Reset to step 1
{my_sequence}.set_value(1) = {bear} // Reset to step 2
{my_sequence}.set_value(2) = {bull+} // Reset to step 3
```
#### Remarks [#remarks-3]
Users cannot set a negative value for a step (e.g: `{udp}.set_step(-1)`), which would instead set the step to 0.
Consider that the order at which the `set_step` method is used matters, if you want to set a step value before the sequence evaluation the `set_step` method should be defined before the affected UDP.
# Alert Scripting (/docs/algos/alert-scripting/introduction)
Alert Scripting is a feature within each of our 3 exclusive toolkits that allows users to create extremely advanced alert conditions using our own scripting language. Alert Scripting is available near the bottom of the settings of each LuxAlgo toolkit, and allows using most of the features from the respective toolkits for creating alert combinations.
This feature is useful for users that feel limited by the custom alert creator.
To learn more about Alert Scripting, see the following pages:
Learn how to reference market data and toolkit features when scripting alerts.
Learn about the operators you can use to compare data with each other.
Learn how to enhance scripted alerts trough actions and methods.
Learn how to create simple and complex alerts.
## Migrations [#migrations]
In order to migrate from older versions to more recent versions see the following page:
Migrate your script to newer version of our scripting language.
# Scripting Migrations (/docs/algos/alert-scripting/migrations)
## v1 to v2 [#v1-to-v2]
The version 2 of our scripting language comes with the following changes:
* Multiple sequences can now be defined.
* Sequences can now be used with strategy scripting.
* Sequences are no longer constructed from one condition per line, instead the new `then` operator should be used.
* New `{any_inactive_step}` placeholder returning true if any step but the active one is true, can only be used for invalidation
* Actions `@invalidate` and `@set_step` have been replaced with their corresponding [methods](./methods).
* Actions no longer require to have the argument name specified:
before: `@label(y = "{close}", text = "hello")`
now: `@label({close}, "hello")`
Do note that the order of arguments needs to be respected. It is still good practice to specify action arguments names to avoid confusion.
* Actions argument values no longer requires to be in between quotes/double quotes.
It is still good practice to use quotes for strings.
* y argument for `@label` and `@line` actions now support historical referencing.
* Action `@valuewhen` now accepts a new `reference` argument allowing to reuse the captured value in other conditions/actions.
* Removed `@filter` action.
### Migrating from v1 to v2 [#migrating-from-v1-to-v2]
#### Defining Sequences [#defining-sequences]
Scripted alerts using a sequence previously separated steps by linebreaks:
```
{close} > {open} // Step 1
{close} crossover {close[9]} // Step 2
{volume} crossover 10000 // Step 3
```
Now sequences can be defined inline using the new `then` operator as follows:
```
{close} > {open} then {close} crossover {close[9]} then {volume} crossover 10000
```
#### Invalidating Sequences [#invalidating-sequences]
Previously sequences were invalidated using the `@invalidate` action:
```
{close} > {open} // Step 1
{close} crossover {close[9]} // Step 2
{volume} crossover 10000 // Step 3
@invalidate() = {close} < {open} // invalidate if closing price is lower than open
```
This can now be done inline using the new operator `!`:
```
{close} > {open} then {close} crossover {close[9]} then {volume} crossover 10000 ! {close} < {open}
```
Or using the new method `invalidate` as long as an udp is defined for the sequence:
```
{my_sequence}.invalidate() = {close} < {open} // Invalidation of {my_sequence}
{my_sequence} = {close} > {open} then {close} crossover {close[9]} then {volume} crossover 10000
```
In V1 invalidation always took place first, as such we want `{my_sequence}.invalidate()` to appear first in the script.
If your invalidation setup only affected specific steps such that you had:
```
@invalidate(step= 1,2) = {close} < {open} // invalidate if closing price is lower than open and active steps are the second one or third one
```
Then you can reuse a similar setup:
```
{my_sequence}.invalidate(step= 1,2) = {close} < {open} // Invalidation of {my_sequence}
```
#### Changing Step [#changing-step]
Previously users could change the active step of a sequence using the `@set_step` action:
```
{close} > {open} // Step 1
{close} crossover {close[9]} // Step 2
{volume} crossover 10000 // Step 3
@set_step(0) = {close} < {open} // Set step to 0 if closing price is lower than open
```
Now this can be done with the `set_step` action:
```
{my_sequence}.set_step(0) = {close} < {open} // Set step to 0 if closing price is lower than open
{my_sequence} = {close} > {open} then {close} crossover {close[9]} then {volume} crossover 10000
```
In V1 setting a sequence step always took place first, as such we want `{my_sequence}.set_step(0)` to appear first in the script.
The value argument still accept increments and decrements.
#### Accessing a sequence active step [#accessing-a-sequence-active-step]
Previously users could access the active step of a sequence (the step subject to evaluation) using the `{step}` placeholder.
Due to the possibility with version 2 of hacing multipe sequences in a single script, the active step can be obtained from a defined UDP for the sequence:
```
{my_sequence} = {close} > {open} then {close} crossover {close[9]} then {volume} crossover 10000
// Get the active step for {my_sequence}
{my_sequence.step}.
```
#### Accessing a sequence elapsed bars since new step [#accessing-a-sequence-elapsed-bars-since-new-step]
Previously users could access the numbers of bars elapsed since a last step was true or invalidation of the sequence using the `{barssince_step}` placeholder.
Due to the possibility with version 2 of hacing multipe sequences in a single script, the active step can be obtained from a defined UDP for the sequence:
```
{my_sequence} = {close} > {open} then {close} crossover {close[9]} then {volume} crossover 10000
// Get the number of bars ellapsed since a last step was true or invalidation for {my_sequence}
{my_sequence.barssince_step}
```
#### Filtering each steps with @filter [#filtering-each-steps-with-filter]
Previously users could apply a condition to all steps of a sequence with a single usage of the `@filter` action as follows:
```
{close} > {open} // Step 1
{close} crossover {close[9]} // Step 2
{volume} crossover 10000 // Step 3
@filter() = {volume} > 5000 // Test for all steps if volume is above 5000
```
This can be done by having a UDP associated to this filter condition and using the and operators with it:
```
{vol_filter} = {volume} > 5000
{my_sequence} = {close} > {open} and {vol_filter} then {close} crossover {close[9]} and {vol_filter} then {volume} crossover 10000 and {vol_filter}
```
# Operators (/docs/algos/alert-scripting/operators)
Operators are specific tokens (characters) performing an operation over multiple defined elements. Alert scripting supports three types of operators described below.
### Comparison Operators [#comparison-operators]
Comparison operators are used to compare two numerical values with each other.
#### `>` (Greater Than) [#-greater-than]
***
`True` if value to the left of `>` is greater than the value to its right.
```js Example
{close} > {open}
```
#### `<` (Less Than) [#-less-than]
***
`True` if value to the left of `<` is less than the value to its right.
```js Example
{close} < {open}
```
#### `>=` (Greater Than or Equal) [#-greater-than-or-equal]
***
`True` if value to the left of `>=` is greater or equal to the value to its right.
```js Example
{close} >= {open}
```
#### `<=` (Less Than or Equal) [#-less-than-or-equal]
***
`True` if value to the left of `<=` is greater or equal to the value to its right.
```js Example
{close} <= {open}
```
#### `==` (Equal) [#-equal]
***
`True` if value to the left of `==` is equal to the value to its right.
```js Example
{close} == {open}
```
#### `!=` (Not Equal) [#-not-equal]
***
`True` if value to the left of `!=` is not equal to the value to its right.
```js Example
{close} != {open}
```
#### `crossover` [#crossover]
***
`True` if series to the left of `crossover` is crossing over the series to its right. Also expressed as:
* `A crossover B = A > B and A[1] < B[1]`
```js Example
{close} crossover {open}
```
`crossover` is not a traditional operator but serves a comparative purpose for alert scripting.
#### `crossunder` [#crossunder]
***
`True` if the series to the left of `crossunder` is crossing under the series to its right. Also expressed as:
* `A crossunder B = A < B and A[1] > B[1]`
```js Example
{close} crossunder {open}
```
`crossunder` is not a traditional operator but serves a comparative purpose for alert scripting.
#### `cross` [#cross]
***
`True` if the series to the left of `cross` is crossing (either over or under) the series to its right. Also expressed as:
* `A cross B = A crossover B or A crossunder B`
* `A cross B = (A - B) * (A[1] - B[1]) < 0`
```js Example
{close} cross {open}
```
`cross` is not a traditional operator but serves a comparative purpose for alert scripting.
### Logical Operators [#logical-operators]
Logical operators link two expressions together forming a more complex condition being either `True` or `False`.
#### `and` [#and]
***
The `and` operator return true if both expressions to its side are `True`.
```js Example
{close} > {open} and {volume} > 1000
```
The above return `True` if the closing price is greater than the opening price while the volume is greater than 1000.
#### `or` [#or]
***
The `or` operator return true if either one of the expressions to its side are `True`.
```js Example
{close} > {open} or {close} > {hl2}
```
The above return `True` if the closing price is greater than the opening price or if the closing price is greater than the median price `hl2`.
It is important to note that `or` takes precedence over `and`, for example:
```js
{close} > {open} and {volume} > 1000 or {close} > {hl2} and {volume} > 1000
```
In the above condition `{close} > {open} and {volume} > 1000` and `{close} > {hl2} and {volume} > 1000` would be evaluated first.
#### `not` [#not]
The `not` operator test if a following condition is true or false, returning `True` if the condition is `False`.
```js
not {close} > {open}
```
The above return `True` if the closing price is not greater than the opening price.
### History Referencing Operator `[]` [#history-referencing-operator-]
Users can refer to previous values of a series using the historical referencing operator `[]`. This operator is placed to the right of a placeholder within the curly brackets:
```python Syntax
{A[n]}
```
Where `n` is a numerical value determining the number of bars back to go fetching `{A}`.
For example, if we want to get the previous value of the closing price we can use `{close[1]}`.
```python Example
{close} > {close[1]}
```
The above example return `True` if the current closing price is greater than value of the closing price one bar back.
### Sequence Operators [#sequence-operators]
Sequence related operators allow defining and controling sequences.
A sequence is a structure made of steps. When one step is triggered we switch to the next step on the next bar.
If there are no more steps to evaluate we say that the sequence is complete and start from the first step again.
#### `then` [#then]
***
Operator defining a sequence. Each condition in between `then` is a step, with the first step being the leftmost condition before `then`.
```python Syntax
{a} then {b} then {c}
```
Where `{a}`, `{b}`, `{c}` are the step conditions.
```js Example
{close} > {open} then {close} < {open} then {close} > {open} and {volume} > 1000
```
In the above example we have a sequence with 3 steps:
* Step 1: `{close} > {open}` *(is the closing price greater than the open price)*
* Step 2: `{close} < {open}` *(is the closing price lower than the open price)*
* Step 3: `{close} > {open} and {volume} > 1000` *(is the closing price greater than the open price and volume above 1000)*
We first evaluate step 1, if it is true we will start evaluating step 2 starting at the next bar.
Once step 2 is true, we will finally start evaluating step 3 sarting at the next bar.
Step 3 is the last step of our sequence, once it is true the sequence will be complete and will restart evaluating from step 1 at the next bar.
#### `!` (Inline Invalidation) [#-inline-invalidation]
***
Operator invalidating a sequence if the assocated condition is true. Inline invalidation always takes place **before** the evaluation of a sequence step.
Invalidation reffer to restarting a sequence prematurely before it is complete.
```python Syntax
{a} then {b} then {c} ! {d}
```
Where `{a}`, `{b}`, `{c}` are the step conditions and `{d}` is the invalidation condition.
```js Example
{close} > {open} then {close} > {open} then {close} > {open} ! {close} < {open}
```
In the above example we have a 3 step sequence using the same conditions (closing price greater than the opening price), and an inline invalidation condition defined after the invalidation operator `!`.
Before evaluating any step from the sequence, the invalidation condition will be checked first, if it is true then we reset the sequence to step 1, after this we immediately evaluate the sequence from step 1.
# Placeholders (/docs/algos/alert-scripting/placeholders)
Placeholders are strings that refer to a specific series of values or events, and have the form `{placeholder_title}`, where `placeholder_title` is the name of the placeholder to access and `{}` makes sure the string is recognized as a placeholder.
Placeholders allow accessing market data such as ohlc prices, volume, but also specific features from their respective toolkit such as signals, indicators...etc.
## Common Placeholders [#common-placeholders]
The placeholders below can be used in all the toolkits.
### Market Data Placeholders [#market-data-placeholders]
Market data placeholder allows referencing typical market data such as ohlc prices and volume.
These placeholders are available for all toolkits.
| Placeholder | Description |
| ----------- | ------------------------------------------------------------- |
| `{open}` | Open price of the bar |
| `{high}` | High price of the bar |
| `{low}` | Low price of the bar |
| `{close}` | Close price of the bar |
| `{hl2}` | Median price `(high + low) / 2` |
| `{ohlc4}` | Average price `(open + high + low + close) / 4` |
| `{hlc3}` | Typical price `(high + low + close) / 3` |
| `{hlcc4}` | Weighted average of hlc prices `(high + low + 2 * close) / 4` |
| `{volume}` | Volume for the bar |
| `{range}` | Difference between High and Low prices |
| `{tr}` | True Range |
### Time Related Placeholders [#time-related-placeholders]
Time placeholder allows referencing time related information such as the bar hour and minute, day, bar index...etc.
These placeholders are available for all toolkits.
| Placeholder | Description |
| ----------------------------- | ------------------------------------------------------------------------------------------------------------------------------------------------------------- |
| `{barindex}` | Index of the current bar |
| `{last_barindex}` | Index of the most recent bar |
| `{second}` | Current bar second |
| `{minute}` | Current bar minute |
| `{hour}` | Current bar hour |
| `{dayofweek}` | Current bar day of the week ranging from 1 to 7, with 1 for sunday |
| `{dayofmonth}` | Current bar day of the month |
| `{weekofyear}` | Current bar week of the year |
| `{month}` | Current bar month of the year |
| `{year}` | Current bar year (with timezone) |
| `{time}` | Unix timestamp of the bar |
| `{unix_ts}` | Unix timestamp of the bar (Deprecated, use `{time}`) |
| `{timeframe}` | Chart timeframe in minutes |
| `{hhmm-hhmm}` | Session placeholder, `True` when the bar is located within the specific session interval, see [here](./placeholders#session-placeholder) for more information |
| `{YYYY-MM-DDThh:mm:ss±hh:mm}` | Datestring placeholder, equal to the timestamp of the specified date, see [here](./placeholders#datestring-placeholder) for more information |
Note that `{dayofweek}` returns the day based on the time of the bar's open. For overnight sessions (e.g. EURUSD, where Monday session starts on Sunday, 17:00) this value can be lower by 1 than the day of the trading day.
The timezone for the time related placeholders (with the exception of `time`, and the datestring placeholder) is defined by the `Timezone` dropdown setting, defining the timezone using UTC. Default value is `exchange`, which uses the exchange timezones to get the value of the time related placeholders.
#### Datestring Placeholder [#datestring-placeholder]
You can easily define dates and optionally th time and timezone using the **Datestring** placeholder, following the ISO 8601 standard. The syntax of the placeholder is as follows:
```text Example
{YYYY-MM-DDThh:mm:ss±hh:mm}
```
* `YYYY`: Year
* `MM`: Month
* `DD`: Day
* `hh`: Hour
* `mm`: Minute
* `±hh:mm`: Timezone offset, default timezone is UTC-0 (optional)
The **Datestring** placeholder is not affected by the **Timezone** setting
This placeholder can be useful alongside `{time}` to constraint the evaluation of conditions to a specific date interval. For example:
```text Example
{close} > {open} and {time} >= {2025-01-01}
```
The above script will only trigger if the closing price is above the opening price while the time is on or after January 1st, 2025.
Dates and times are separated by `T`, for example `{2025-01-01T04:00}`. `±hh:mm` can be used to offset the timezones, as such if the timezone of interest is the New York timezone (UTC-4), we would use:
```text Example
{2025-01-01T04:00-04:00}
```
#### Session Placeholder [#session-placeholder]
You can easily detect if the current bar is within a specific session (time interval) by using the session placeholder with pattern `{hhmm-hhmm}`, where `hh` is the hour and `mm` the minute.
The value of this placeholder will be `True` when the bar time is located between the start time `{hhmm-` and end time `-hhmm}`.
For example, if we want to detect when the bar is located in the session starting at 14:30 and ending at 16:45 we would simply use:
```python Example
{1430-1645}
```
### External Placeholders [#external-placeholders]
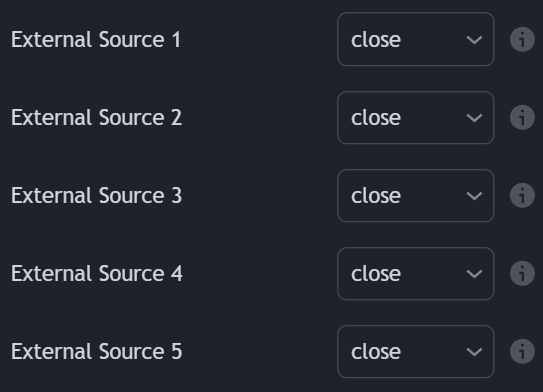
Users can refer to a series of values outside the toolkit by using external placeholder. A maximum of 5 external placeholders can be used:
* `{external1}`
* `{external2}`
* `{external3}`
* `{external4}`
* `{external5}`
In order to use external placeholders, users must first select the external source from the provided dropdowns located in the Alert Scripting settings. Once selected, external sources can be referred from their respective placeholders.
### Custom Alert Creator Placeholders [#custom-alert-creator-placeholders]
Placeholders referencing events from the custom alert creator in order to potentially create more complex alerts.
These can either be `True` or `False`.
| Placeholder | Description |
| --------------------- | -------------------------------------------------------- |
| `{custom_alert_step}` | Set conditions from the custom alert creator (except OR) |
| `{custom_alert_or}` | OR condition from the custom alert creator |
### Sequencing Placeholders [#sequencing-placeholders]
Alert scripting includes multiple placeholders helping user create and refine a sequence of conditions.
| Placeholder | Type | Description |
| ---------------------- | ------- | ---------------------------------------------------------------------------------------------------------- |
| `{udp.step}` | Data | Current active step in the ongoing sequence of conditions from udp `{udp}`, with 0 being the first step |
| `{udp.barssince_step}` | Data | Numbers of bars elapsed since last step or invalidation of the sequence associated to `{udp}` |
| `{any_active_step}` | Trigger | True if any of the inactive conditions from a sequence is true. Can only be used as invalidation condition |
For more information, see [here](./usage#sequencing-and-steps).
## User Defined Placeholders (UDP) [#user-defined-placeholders-udp]
User defined placeholders (UDPs) are custom placeholders defined by users and assigned to a specific condition set by the user. These placeholders can later be referenced as part of other conditions or UDPs.
We strongly recommend using UDPs to lower the complexity of conditions.
You can easily breakdown one complex condition into two simpler UDPs.
To define an UDP a line must start with a placeholder with a unique name, followed by an equal sign `=`, then followed by the condition we want to assign to this placeholder, for example `{my_placeholder} = {close} > {open}`
Let's take a more complex example and say we want to be alerted on a new bullish fair value gaps while we also had one on the previous bar.
Doing this could involve a long and messy script, to make things easier we can create an UDP that refers to the condition of a bullish fair value gaps, and reuse it for our alert condition:
```
{bull_fvg} = {low} > {high[2]} and {close[1]} > {high[2]}
{bull_fvg} and {bull_fvg[1]}
```
## Toolkit Placeholders [#toolkit-placeholders]
The placeholders below are unique to their respective toolkit, and refer to the toolkit features.
### Signals & Overlays Placeholders [#signals--overlays-placeholders]
#### Data Series Placeholders [#data-series-placeholders]
| Placeholder | Description |
| ------------------------- | ------------------------------------------------------------------------------------------------------ |
| `{barcolor}` | Bar color value for confirmation signals, with 1 for green, -1 for red, and 0 for purple |
| `{ml_classifier}` | ML Classifier value for signals, ranging from 1 to 4 |
| `{smart_trail}` | Smart Trail value |
| `{smart_trail_extremity}` | Smart Trail extremity value |
| `{rz_r3}` | Reversal Zones Resistance 3 value |
| `{rz_r2}` | Reversal Zones Resistance 2 value |
| `{rz_r1}` | Reversal Zones Resistance 1 value |
| `{rz_s1}` | Reversal Zones Support 1 value |
| `{rz_s2}` | Reversal Zones Support 2 value |
| `{rz_s3}` | Reversal Zones Support 3 value |
| `{catcher}` | Trend Catcher value |
| `{os_catcher}` | Value associated to the trend detected by the Trend Catcher, with 1 for uptrends, and 0 for downtrends |
| `{tracer}` | Trend Tracer value |
| `{os_tracer}` | Value associated to the trend detected by the Trend Tracer, with 1 for uptrends, and 0 for downtrends |
| `{neo_lead}` | Neo Cloud lead line value |
| `{neo_lag}` | Neo Cloud lagging line value |
| `{tp2}` | Take profit 2 level value |
| `{tp1}` | Take profit 1 level value |
| `{sl1}` | Stop loss 1 level value |
| `{sl2}` | Stop loss 2 level value |
| `{optimal_sensitivity}` | Optimal sensitivity value |
| `{trend_strength}` | Trend Strength percentage value |
| `{volatility}` | Lux Volatility percentage value |
| `{squeeze}` | Squeeze Index percentage value |
| `{volume_sentiment}` | Volume Sentiment percentage value |
#### Trigger Placeholders [#trigger-placeholders]
| Placeholder | Description |
| ------------------------------ | ---------------------------------------------------------------------------------- |
| `{bullish_confirmation}` | `True` on a new normal bullish confirmation signal |
| `{bullish_confirmation+}` | `True` on a new strong bullish confirmation signal |
| `{bullish_confirmation_any}` | `True` on a any new bullish confirmation signal |
| `{bullish_confirmation_turn+}` | `True` when a normal bullish confirmation signal turns strong |
| `{bearish_confirmation}` | `True` on a new normal bearish confirmation signal |
| `{bearish_confirmation+}` | `True` on a new strong bearish confirmation signal |
| `{bearish_confirmation_any}` | `True` on any new bearish confirmation signal |
| `{bearish_confirmation_turn+}` | `True` when a normal bearish confirmation signal turns strong |
| `{bullish_contrarian}` | `True` on a new normal bullish contrarian signal |
| `{bullish_contrarian+}` | `True` on a new strong bullish contrarian signal |
| `{bullish_contrarian_any}` | `True` on any new bullish contrarian signal |
| `{bearish_contrarian}` | `True` on a new normal bearish contrarian signal |
| `{bearish_contrarian+}` | `True` on a new strong bearish contrarian signal |
| `{bearish_contrarian_any}` | `True` on any new bearish contrarian signal |
| `{exit_buy}` | `True` on a new exit buy signal |
| `{exit_sell}` | `True` on a new exit sell signal |
| `{bullish_smart_trail}` | `True` if Smart Trail is up-trending |
| `{bearish_smart_trail}` | `True` if Smart Trail is down-trending |
| `{switch_bullish_smart_trail}` | `True` if Smart Trail switches to bullish |
| `{switch_bearish_smart_trail}` | `True` if Smart Trail switches to bearish |
| `{price_above_rzr1}` | `True` if the closing price is above the lower Reversal Zones resistance R1 |
| `{price_below_rzs1}` | `True` if the closing price is below the upper Reversal Zones support S1 |
| `{price_co_rzr1}` | `True` if the closing price cross over the lower Reversal Zones resistance R1 |
| `{price_cu_rzs1}` | `True` if the closing price cross under the upper Reversal Zones support S1 |
| `{bullish_catcher}` | `True` if Trend Catcher is up-trending |
| `{bearish_catcher}` | `True` if Trend Catcher is down-trending |
| `{switch_bullish_catcher}` | `True` if Trend Catcher switches to bullish |
| `{switch_bearish_catcher}` | `True` if Trend Catcher switches to bearish |
| `{bullish_tracer}` | `True` if Trend Tracer is up-trending |
| `{bearish_tracer}` | `True` if Trend Tracer is down-trending |
| `{switch_bullish_tracer}` | `True` if Trend Tracer switches to bullish |
| `{switch_bearish_tracer}` | `True` if Trend Tracer switches to bearish |
| `{bullish_neo}` | `True` if Neo Cloud is up-trending |
| `{bearish_neo}` | `True` if Neo Cloud is down-trending |
| `{switch_bullish_neo}` | `True` if Neo Cloud switches to bullish |
| `{switch_bearish_neo}` | `True` if Neo Cloud switches to bearish |
| `{trend_strength_trending}` | `True` if the Trend Strength indicates a trending market (Trend Strength above 50) |
| `{trend_strength_ranging}` | `True` if the Trend Strength indicates a ranging market (Trend Strength below 50) |
### Price Action Concepts Placeholders [#price-action-concepts-placeholders]
#### Data Series Placeholders [#data-series-placeholders-1]
| Placeholder | Description |
| --------------------- | --------------------------------------------------------------------------------------------------------------------------------------------------------------------------------------------------------------------------------------------------------------------------------------------------------------------------------------------------------------------------------------------- |
| `{internal_high}` | Internal high levels value |
| `{internal_low}` | Internal low levels value |
| `{swing_high}` | Swing high levels value |
| `{swing_low}` | Swing low levels value |
| `{itrend}` | The trend value is determined by internal market structures, with positive values for uptrends and negative values for downtrends. In an uptrend, an Internal Change of Character (I-CHoCH) has a value of +1, while an Internal Break of Structure (I-BOS) has a value of +2. The same logic applies to downtrends but uses negative values instead (−1 for an I-CHoCH and −2 for an I-BOS). |
| `{strend}` | The trend value is determined by swing market structures, with positive values for uptrends and negative values for downtrends. In an uptrend, a Swing Change of Character (S-CHoCH) has a value of +1, while a Swing Break of Structure (S-BOS) has a value of +2. The same logic applies to downtrends but uses negative values instead (−1 for an S-CHoCH and −2 for an S-BOS). |
| `{ob_buy_volume}` | Most recent order block buy volume |
| `{ob_sell_volume}` | Most recent order block sell volume |
| `{ob_total_volume}` | Most recent order block total volume |
| `{ob_per_volume}` | Most recent order block percentage volume |
| `{prev_day_high}` | Previous day high value |
| `{prev_day_low}` | Previous day low value |
| `{prev_week_high}` | Previous week high value |
| `{prev_week_low}` | Previous week low value |
| `{prev_month_high}` | Previous month high value |
| `{prev_month_low}` | Previous month low value |
| `{prev_quarter_high}` | Previous quarter high value |
| `{prev_quarter_low}` | Previous quarter low value |
#### Trigger Placeholders [#trigger-placeholders-1]
| Placeholder | Description |
| ------------------------------- | --------------------------------------------------- |
| `{bullish_ichoch}` | `True` on a new internal bullish CHoCH |
| `{bullish_ichoch+}` | `True` on a new internal bullish CHoCH+ |
| `{bullish_ibos}` | `True` on a new internal bullish BOS |
| `{bearish_ichoch}` | `True` on a new internal bearish CHoCH |
| `{bearish_ichoch+}` | `True` on a new internal bearish CHoCH+ |
| `{bearish_ibos}` | `True` on a new internal bearish BOS |
| `{bullish_schoch}` | `True` on a new swing bullish CHoCH |
| `{bullish_schoch+}` | `True` on a new swing bullish CHoCH+ |
| `{bullish_sbos}` | `True` on a new swing bullish BOS |
| `{bearish_schoch}` | `True` on a new swing bearish CHoCH |
| `{bearish_schoch+}` | `True` on a new swing bearish CHoCH+ |
| `{bearish_sbos}` | `True` on a new swing bearish BOS |
| `{bullish_ob}` | `True` on a new bullish order block |
| `{bearish_ob}` | `True` on a new bearish order block |
| `{bullish_bb}` | `True` on a new bullish breaker block |
| `{bearish_bb}` | `True` on a new bearish breaker block |
| `{bullish_ob_mitigated}` | `True` when a bullish order block is mitigated |
| `{bearish_ob_mitigated}` | `True` when a bearish order block is mitigated |
| `{bullish_ob_within}` | `True` when price is within a bullish order block |
| `{bearish_ob_within}` | `True` when price is within a bearish order block |
| `{bullish_ob_entered}` | `True` when price enters a bullish order block |
| `{bearish_ob_entered}` | `True` when price enters a bearish order block |
| `{bullish_ob_exit}` | `True` when price exits a bullish order block |
| `{bearish_ob_exit}` | `True` when price exits a bearish order block |
| `{bullish_imbalance}` | `True` on a new bullish imbalance |
| `{bearish_imbalance}` | `True` on a new bearish imbalance |
| `{bullish_imbalance_mitigated}` | `True` when a bullish imbalance is mitigated |
| `{bearish_imbalance_mitigated}` | `True` when a bearish imbalance is mitigated |
| `{bullish_imbalance_within}` | `True` when price is within a bullish imbalance |
| `{bearish_imbalance_within}` | `True` when price is within a bearish imbalance |
| `{bullish_imbalance_entered}` | `True` when price enters a bullish imbalance |
| `{bearish_imbalance_entered}` | `True` when price enters a bearish imbalance |
| `{bullish_imbalance_exit}` | `True` when price exits a bullish imbalance |
| `{bearish_imbalance_exit}` | `True` when price exits a bearish imbalance |
| `{bullish_trendline_new}` | `True` on a new bullish trendline |
| `{bullish_trendline_update}` | `True` on a bullish trendline update |
| `{bullish_trendline_break}` | `True` on a bullish trendline break |
| `{bearish_trendline_new}` | `True` on a new bearish trendline |
| `{bearish_trendline_update}` | `True` on a bearish trendline update |
| `{bearish_trendline_break}` | `True` on a bearish trendline break |
| `{bullish_grab}` | `True` on a new bullish liquidity grab |
| `{bearish_grab}` | `True` on a new bearish liquidity grab |
| `{premium}` | `True` when price is located within a premium zone |
| `{discount}` | `True` when price is located within a discount zone |
| `{custom_alert_step}` | `True` on a custom alert step completion |
| `{custom_alert_or}` | `True` on a custom alert OR condition completion |
### Oscillator Matrix Placeholders [#oscillator-matrix-placeholders]
#### Data Series Placeholders [#data-series-placeholders-2]
| Placeholder | Description |
| ---------------------- | ------------------------------------------------------------------------------------------------------ |
| `{moneyflow}` | Money Flow oscillator value |
| `{overflow}` | Overflow value |
| `{upper_mf_threshold}` | Upper Money Flow threshold |
| `{lower_mf_threshold}` | Lower Money Flow threshold |
| `{hyperwave}` | HyperWave oscillator value |
| `{hyperwave_signal}` | HyperWave signal line value |
| `{bullish_confluence}` | Bullish confluence numerical value, 0 for no confluence, 1 for low confluence, 2 for strong confluence |
| `{bearish_confluence}` | Bearish confluence numerical value, 0 for no confluence, 1 for low confluence, 2 for strong confluence |
| `{confluence_meter}` | Confluence meter value |
#### Trigger Placeholders [#trigger-placeholders-2]
| Placeholder | Description |
| --------------------------------------- | --------------------------------------------------- |
| `{regular_bullish_hyperwave_signal}` | `True` on a new regular bullish HyperWave signal |
| `{regular_bearish_hyperwave_signal}` | `True` on a new regular bearish HyperWave signal |
| `{oversold_bullish_hyperwave_signal}` | `True` on a new oversold bullish HyperWave signal |
| `{overbought_bearish_hyperwave_signal}` | `True` on a new overbought bearish HyperWave signal |
| `{hyperwave_co_80}` | `True` when HyperWave crosses over 80 |
| `{hyperwave_cu_20}` | `True` when HyperWave crosses under 20 |
| `{hyperwave_co_50}` | `True` when HyperWave crosses over 50 |
| `{hyperwave_cu_50}` | `True` when HyperWave crosses under 50 |
| `{hyperwave_above_80}` | `True` when HyperWave is above 80 |
| `{hyperwave_below_20}` | `True` when HyperWave is below 20 |
| `{hyperwave_above_50}` | `True` when HyperWave is above 50 |
| `{hyperwave_below_50}` | `True` when HyperWave is below 50 |
| `{moneyflow_co_50}` | `True` when Money Flow crosses over 50 |
| `{moneyflow_cu_50}` | `True` when Money Flow crosses under 50 |
| `{moneyflow_above_50}` | `True` when Money Flow is above 50 |
| `{moneyflow_below_50}` | `True` when Money Flow is below 50 |
| `{new_bullish_overflow}` | `True` on a new bullish Overflow signal |
| `{new_bearish_overflow}` | `True` on a new bearish Overflow signal |
| `{bullish_overflow}` | `True` if bullish Overflow is active |
| `{bearish_overflow}` | `True` if bearish Overflow is active |
| `{reversal_up-}` | `True` on a new minor bullish reversal signal |
| `{reversal_up+}` | `True` on a new major bullish reversal signal |
| `{reversal_down-}` | `True` on a new minor bearish reversal signal |
| `{reversal_down+}` | `True` on a new major bearish reversal signal |
| `{reversal_any_up}` | `True` on any new bullish reversal signal |
| `{reversal_any_down}` | `True` on any new bearish reversal signal |
| `{bullish_divergence}` | `True` on a new bullish divergence |
| `{bearish_divergence}` | `True` on a new bearish divergence |
| `{weak_bullish_confluence}` | `True` on a new weak bullish confluence |
| `{weak_bearish_confluence}` | `True` on a new weak bearish confluence |
| `{strong_bullish_confluence}` | `True` on a new strong bullish confluence |
| `{strong_bearish_confluence}` | `True` on a new strong bearish confluence |
| `{custom_alert_step}` | `True` on a custom alert step completion |
| `{custom_alert_or}` | `True` on a custom alert OR condition completion |
# Pre-made Templates (/docs/algos/alert-scripting/readymade-scripts)
You can find the pre-configured scripts below adapted for various use cases. To use them, simply copy the script code and paste them in the "Condition Input Field" setting.
## S\&O Toolkit [#so-toolkit]
### Confirmation Signals during New York Session [#confirmation-signals-during-new-york-session]
```
{bullish_confirmation_any} and {0900-1700} or {bearish_confirmation_any} and {0900-1700}
```
Use UTC-5 as timezone.
### Optimal Sensitivity Change [#optimal-sensitivity-change]
```
{optimal_sensitivity} != {optimal_sensitivity[1]}
```
### Early short signal, weak trend confirmation above smart trail [#early-short-signal-weak-trend-confirmation-above-smart-trail]
```
{bearish_confirmation_any} and {ml_classifier} < 3 and {bullish_smart_trail}
```
### Reversal setup, Confirmation exit into strong trend change [#reversal-setup-confirmation-exit-into-strong-trend-change]
```
{confirmation_exits} then {bearish_confirmation_any} then {barcolor} == -1
```
### Contrarian inside upper Reversal Zone [#contrarian-inside-upper-reversal-zone]
```
{bearish_contrarian_any} and {close} > {rz_r2} and {close} < {rz_r3}
```
### Price Retesting Smart Trail with bearish confirmation [#price-retesting-smart-trail-with-bearish-confirmation]
```
{bearish_confirmation_any} and {bearish_smart_trail} or {high} crossover {smart_trail_extremity} and {bearish_smart_trail}
```
### Strong Buy Signal with Volume Confirmation [#strong-buy-signal-with-volume-confirmation]
```
{bullish_confirmation+} and {volume} > {volume[1]} and {trend_strength} > 60
```
### Smart Trail Trend Change with Confirmation [#smart-trail-trend-change-with-confirmation]
```
{bullish_smart_trail} and not {bullish_smart_trail[1]} and {bullish_confirmation_any}
```
### Exit During High Volatility & Squeeze [#exit-during-high-volatility--squeeze]
```
{exit_sell} and {volatility} > 75 and {squeeze} > 80
```
### Strong Trend with Multiple Indicators [#strong-trend-with-multiple-indicators]
```
{bullish_catcher} and {bullish_tracer} and {bullish_neo} and {trend_strength} > 70
```
### Neo Cloud Breakout with Volume [#neo-cloud-breakout-with-volume]
```
{close} cross {neo_lead} and {volume} > {volume[1]}
```
### Take Profit Reached [#take-profit-reached]
```
{close} cross {tp1} or {close} cross {tp2}
```
### Stop Loss Reached [#stop-loss-reached]
```
{close} cross {sl1} or {close} cross {sl2}
```
### Strong Trend Shift [#strong-trend-shift]
```
{bullish} = {bullish_confirmation_any} and {bearish_smart_trail[1]} and {volatility} > 50
{bearish} = {bearish_confirmation_any} and {bullish_smart_trail[1]} and {volatility} > 50
{bullish} or {bearish}
```
## PAC Toolkit [#pac-toolkit]
### Bearish Order Block Creation with Bullish Volume [#bearish-order-block-creation-with-bullish-volume]
```
{bear_ob} and {ob_buy_volume} > {ob_sell_volume}
```
### Swing / Internal CHOCH Confluence [#swing--internal-choch-confluence]
```
{bull_schoch} and {bull_ichoch} or {bull_schoch+} and {bull_ichoch+}
```
### Order Block Mitigation Setup [#order-block-mitigation-setup]
```
{bull_ob_mitigated} and {bullish_grab}
```
### Premium Zone Trading [#premium-zone-trading]
```
{premium} and {bull_imbalance} and {swing_high} < {close}
```
### Multiple Block Confluence [#multiple-block-confluence]
```
{bull_ob_within} and {bull_imbalance_within}
```
### Trendline Break with Structure [#trendline-break-with-structure]
```
{trendline_up_break} and {bear_ichoch}
```
### High-Probability Reversal [#high-probability-reversal]
```
{bear_ob_entered} and {bearish_grab} and {prev_week_high} < {close}
```
### Key Bullish Level Break [#key-bullish-level-break]
```
{any_choch} = {bullish_ichoch} or {bullish_ichoch+} or {bullish_schoch} or {bullish_schoch+}
{close} > {prev_day_high} and {any_choch}
```
### Complex Structure Analysis [#complex-structure-analysis]
```
{bull_bb} and {bull_imbalance_entered} and {trendline_up_new}
```
## Oscillator Matrix Toolkit [#oscillator-matrix-toolkit]
### Strong Reversal Signal [#strong-reversal-signal]
```
{reversal_up+} and {bullish_divergence} and {hyperwave} > {hyperwave_signal}
```
### High Confluence Setup [#high-confluence-setup]
```
{bullish_confluence} == 2 and {moneyflow} > 60 and {overflow} > 70
```
### Oversold Bounce [#oversold-bounce]
```
{oversold_bullish_hyperwave_signal} and {bullish_divergence} and {confluence_meter} > 70
```
### Multiple Indicator Confirmation [#multiple-indicator-confirmation]
```
{regular_bullish_hyperwave_signal} and {reversal_up+} and {moneyflow} crossover 50
```
### Divergence with Momentum [#divergence-with-momentum]
```
{bullish_divergence} and {hyperwave} crossover {hyperwave_signal} and {moneyflow} > 50
```
### Strong Trend Confirmation [#strong-trend-confirmation]
```
{bullish_confluence} > 0 and {overflow} > 60 and {moneyflow} > {moneyflow[1]}
```
### HyperWave Signal with Confluence [#hyperwave-signal-with-confluence]
```
{regular_bullish_hyperwave_signal} and {bullish_confluence} == 2 and {confluence_meter} > 80
```
### Major Reversal Pattern [#major-reversal-pattern]
```
{reversal_up+} and {moneyflow} > 70 and {hyperwave} > {hyperwave[1]}
```
### Early Trend Detection [#early-trend-detection]
```
{regular_bullish_hyperwave_signal} and {moneyflow} crossover 30 and {overflow} > 50
```
### High Probability Setup [#high-probability-setup]
```
{bullish_divergence} and {reversal_up+} and {bullish_confluence} == 2 and {confluence_meter} > 75
```
# Usage (/docs/algos/alert-scripting/usage)
Alert scripting is a good way to create more complex alerts without feeling limited by the number of conditions or their limited reusability.
This page covers the syntax of scripted alerts as well as showcasing typical use cases for alert scripting.
## Building Simple Conditions [#building-simple-conditions]
Users can define a simple condition over a single line in the text area "Condition Input Field".
In order to build effective conditions, we will need to reference specific data using [placeholders](./placeholders) and compare this data with each other using [operators](./operators).
For example, we could define the following condition:
```
{close} > {close[14]}
```
Here we have the following elements:
* `{close}` placeholder, referencing the current closing price value
* Greater than operator `>`, testing if the value to its left is greater than the value to its right
* `{close[14]}` refer to the value of the closing price (`{close}`) 14 bars ago (defined by the historical referencing operator `[14]`)
This simple condition is `True` if the current closing price is higher than the closing price 14 bars ago.
### Combining Conditions [#combining-conditions]
Creating slightly more complex conditions can involve combining individual ones into a single one, allowing us to retain more precise events or on the contrary, loosen our condition rules.
#### Combination using `and` [#combination-using-and]
Using the operator `and` allows to require more than one "sub-conditions" to be valid for the whole to be true.
For example, we could reuse our previous condition but be more strict such that we only want to know when the current closing price is greater than the closing price 14 bars ago when it is between 1pm and 3pm (exchange timezone). To do this we can simply add another sub-condition leading to:
```
{close} > {close[14]} and {hour} >= 13 and {hour} <= 15
```
`and` is similar to using the custom alert creator and having multiple enabled conditions using the same step number.
Another example where we can combine multiple conditions is to detect FVG's, for the case of a bullish FVG we have the following requirements:
* current low price is higher than the high price two bars ago
* previous closing price is higher than the high price two bars ago
We can use alert scripting to detect bullish FVG's from this combination of conditions as follows:
```
{low} > {high[2]} and {close[1]} > {high[2]}
```
#### Combination using `or` [#combination-using-or]
Sometimes we might be interested in getting alerted about two specific different conditions, without having to create two specific alerts. This is where `or` can be useful, requiring only one of the defined sub-conditions to be true in order for the alert to trigger.
For example, we could want to be alerted either on a strong bullish confirmation signal, or when the Smart Trail turns bullish, this could be easily achieved using the following script:
```
{bullish_confirmation+} or {bullish_smart_trail} and not {bullish_smart_trail[1]}
```
Here `{bullish_confirmation+}` is true when we have a strong bullish confirmation signal.
`{bullish_smart_trail}` when the Smart Trail is bullish, with the whole `{bullish_smart_trail} and not {bullish_smart_trail[1]}` being true when the Smart Trail is currently bullish while the previous Smart trail is **not** bullish.
`or` takes precedence over `and`. You can think of this as a way to split a whole condition into multiple sub-conditions.
For example if we have `{A} and {B} or {C} > 0 or {D} and {E}`, the precedence of or would split this conditions leading to `{A} and {B}`, `{C} > 0`, and `{D} and {E}`.
Each of these individual sub-conditions would be evaluated individually, if one of them is true, then our whole condition is true.
## Sequencing and Steps [#sequencing-and-steps]
Users can create sequences of conditions, triggering an alert when the last step in a sequence is true.
Sequences are constructed using the `then` operator, with each conditions seperated by `then` being a step. The first step is the leftmost one before `then`. When a step is valid, the next step condition will be evaluated at the next bar.
Once the last step is evaluated and is true, the sequence is completed which can trigger an alert (if set) and will switch to the first defined step on the next bar.
This is similar in practice to how the custom alert creator works.
For example, we can define a sequence consisting of the following conditions:
* Step 1: High price is lower than the previous high price
* Step 2: Low price is lower than the previous low price
* Step 3: Closing price is lower than the opening price
Leading to the following script:
```
{my_sequence} = {high} < {high[1]} then {low} < {low[1]} then {close} < {open}
```
For clarity you can assign conditions over a single line to a UDP defined at the start.
```
{condition1} = ...
{condition2} = ...
{condition3} = ...
{my_sequence} = {condition1} then {condition2} then {condition3}
```
### Invalidation [#invalidation]
Invalidation refers to re-evaluating from the first step of a sequence of conditions when one or more specific conditions are true.
Invalidation takes place prior to evaluating steps.
Invalidation conditions can be defined for a sequence using the inline invalidation operator `!`:
```
// Invalidate sequence when {close} is above {open}
{my_sequence} = {high} < {high[1]} then {low} < {low[1]} then {close} < {open} ! {close} > {open}
```
If the condition after `!` is true, we go back to evaluating the sequence of conditions from step 1.
Another way to perform invalidation is using the method `invalidate()`:
```
// Invalidate sequence when {close} is above {open}, evaluate invalidation first
{my_sequence}.invalidate() = {close} > {open}
// Define sequence
{my_sequence} = {high} < {high[1]} then {low} < {low[1]} then {close} < {open}
```
#### Step Specific Invalidation [#step-specific-invalidation]
It is possible to apply invalidation conditions to specific steps, this is done using the `step` parameter in the `@invalidate` action.
To illustrate this, we can reuse our previous sequence of conditions:
```
{my_sequence} = {high} < {high[1]} then {low} < {low[1]} then {close} < {open}
```
Maybe that we don't want the closing price to be greater than the opening price as long as the second step is the one being evaluated, this can be achieved as follows:
```
{my_sequence} = {high} < {high[1]} then {low} < {low[1]} then {close} < {open} ! {close} > {open} and {my_sequence.step} == 1
```
Here `{my_sequence.step} == 1` refer to the second step of \{my\_sequence} needing to be the one being evaluated in the sequence to apply the invalidation condition `{close} > {open}`.
With steps, 0 refers to the first step because it is 0 indexed.
Another way of doing this using the `invalidate` method can be done as follows:
```
// Invalidate sequence
{my_sequence}.invalidate(step=1) = {close} > {open}
// Define sequence
{my_sequence} = {high} < {high[1]} then {low} < {low[1]} then {close} < {open}
```
Here `invalidate(step=1)` indicates that invalidation only takes place if the active step is the second one.
#### Invalidate on Step Evaluation Duration [#invalidate-on-step-evaluation-duration]
Sometimes we might not want to keep evaluating one or multiple steps for an excessive number of bars, and instead prefer having each step being triggered with a short interval in between.
This can easily be done using invalidation and the placeholder `barssince_step`, which quantify the number of bars that elapsed since a step has started being evaluated or since invalidation took place.
For example, we can invalidate a sequence of conditions if the amount elapsed since a step is greater than 5 bars:
```
{my_sequence} = {high} < {high[1]} then {low} < {low[1]} then {close} < {open} ! {my_sequence.barssince_step} > 5
```
## Visualizing Scripted Alerts Conditions [#visualizing-scripted-alerts-conditions]
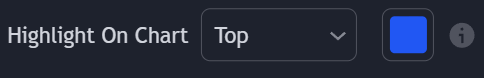
In order to make sure the scripted alert corresponds to the desired result and that it triggers as expected, users can visualize when the alert would have triggered using the "Highlight On Chart" setting.
Enabling this setting will display a series of squares located at the top or bottom of the chart. When the last UDP condition specified in the script is true, the square will be colored in blue or the selected color from the setting.
Users can control the location of this highlighter on the chart trough the dropdown menu.
"Top" and "Bottom" locations are available, while the Oscillator Matrix toolkit also includes a "Center" option.
"None" will hide the scripted alert highlighting.
## Setting Scripted Alerts [#setting-scripted-alerts]
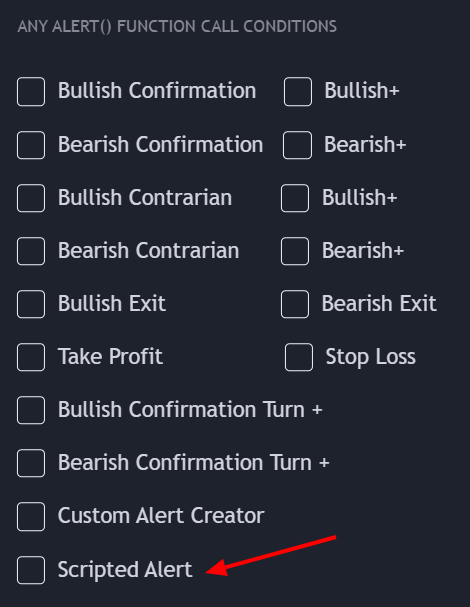
Once a scripted alert is defined, we can create an alert using it as a condition by enabling the "Scripted Alert" setting in the "Any alert() Function Call" settings group located at the bottom of the toolkit settings.
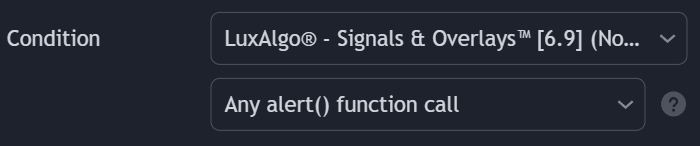
Then we can create the alert by clicking on the alert menu, selecting the toolkit in the condition dropdown, and making sure the dropdown below has "any alert() function call" selected.
The alert will trigger whenever the last defined UDP condition is true.
More alerts can be created via scripting using the `@alert()` action, see [here](./actions#@alert) for more information.
## Comments [#comments]
To make a scripted alert easier to read, users can add comments by starting a line with `//`.
Comments will be ignored when a scripted alert is evaluated.
For example:
```
// Step 1: candle color becomes green
{barcolor} > 0 and not {barcolor[1]} > 0
// Step 2: candle color is red
{barcolor} < 0
```
Comments can also be set inline:
```
// Step 1: candle color becomes green
{green_color} = {barcolor} > 0 and not {barcolor[1]} > 0
@label() = {green_color} // Label when candle color becomes green
```
# Alerts (/docs/algos/oscillator-matrix/alerts)
The Oscillator Matrix® can alert users for multiple events relevant to the existing features in the toolkit. To learn more about how to set alerts in general see [how to create alerts on tradingview](/docs/getting-started/tradingview-alerts).
In order for an alert to work in the toolkit make sure the related feature is enabled
## Any alert() function call [#any-alert-function-call]
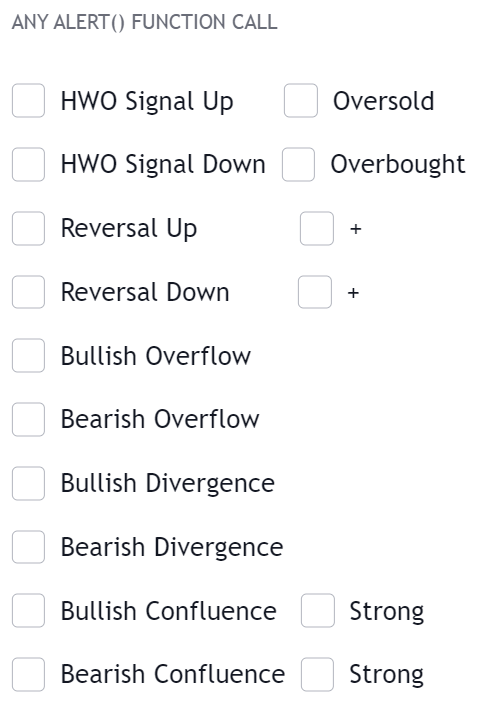
It possible to set only one alert alerting for multiple selected conditions by the users.
Conditions can be selected in the **Any alert() function call** group in the indicator settings. Then the user can set an alert by selecting "any alert() function call" as condition.
Alert conditions for the "any alert() function call" use a `once per bar close` frequency
### Any Alert() Function Call Message [#any-alert-function-call-message]
Users can set a custom message that will be used when an any alert() function call condition is triggered in the message field below the list of conditions. Users can use placeholders to customize messages and return useful information, the following placeholders are supported:
#### Symbol Placeholders [#symbol-placeholders]
| Placeholder | Description | Example |
| ------------ | ------------------------------------------------------- | ----------------------- |
| `{default}` | Default message associated with the trigerred condition | `"Bullish Divergence"` |
| `{ticker}` | Symbol ticker without the exchange prefix | `"MSFT"` |
| `{exchange}` | Symbol exchange/data source | `"COINBASE"` |
| `{sector}` | Sector of the symbol, `na` if the symbol has no sector | `"Technology Services"` |
| `{market}` | Symbol market type | `"Stocks"` |
#### Time Placeholders [#time-placeholders]
| Placeholder | Description | Example |
| ----------- | -------------------------------------------------------------------------------------- | ----------------- |
| `{tf}` | Chart timeframe, includes "S" for seconds, "D" for days, "W" for weeks, "M" for months | `"15"` |
| `{time}` | Unix time in milliseconds in exchange timezone | `"1705331385158"` |
| `{year}` | Current year in exchange timezone | `"2024"` |
| `{month}` | Current month in exchange timezone | `"7"` |
| `{day}` | Current day of the month in exchange timezone | `"21"` |
#### Data Placeholders [#data-placeholders]
| Placeholder | Description | Example |
| ----------- | -------------- | ---------- |
| `{open}` | Opening price | `"1.2145"` |
| `{high}` | High price | `"1.2357"` |
| `{low}` | Low price | `"1.1983"` |
| `{close}` | Closing price | `"1.0569"` |
| `{volume}` | Current volume | `"45216"` |
#### Indicators Placeholders [#indicators-placeholders]
| Placeholder | Description | Example |
| -------------------- | ---------------------------------------------------------------------------------------------------------------- | --------- |
| `{moneyflow}` | Money Flow oscillator value | `"56.89"` |
| `{bull_overflow}` | Bullish Overflow value | `"51.63"` |
| `{bear_overflow}` | Bearish Overflow value | `"46.52"` |
| `{hyperwave}` | HyperWave oscillator value | `"78.44"` |
| `{hyperwave_signal}` | HyperWave oscillator signal line value | `"72.61"` |
| `{bull_confluence}` | Bullish confluence zone value. 2 if exhibiting strong confluence, 1 for weak confluence, and 0 for no confluence | `"2"` |
| `{bear_confluence}` | Bearish confluence zone value. 2 if exhibiting strong confluence, 1 for weak confluence, and 0 for no confluence | `"0"` |
| `{confluence_meter}` | Confluence meter value | `"89.73"` |
### Format as JSON [#format-as-json]
Use the following message template to receive "any alert() function call" messages in the JSON format:
```json
{
"alert": "{default}",
"ticker": "{ticker}",
"tf": "{tf}",
"ohlcv":{
"open": {open},
"high": {high},
"low": {low},
"close": {close},
"volume": {volume}
},
"bartime": {time}
}
```
## Custom Alert Creator [#custom-alert-creator]
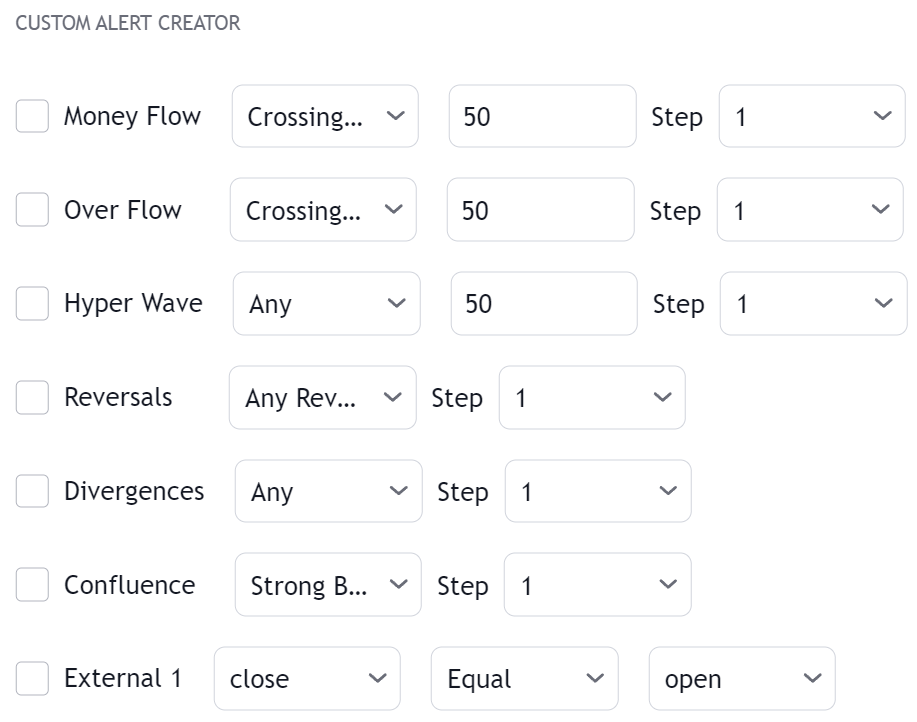
Users wishing to construct more complex alerts using features within the toolkit and/or external indicators can use the **Custom Alert Creator**.
The custom alert creator allows alerting when various user set conditions are met or when a sequence of conditions is complete.
A user wishing to be alerted when the money flow is bullish (above 50) while the HyperWave is overbought (above 80) could do it as follows:
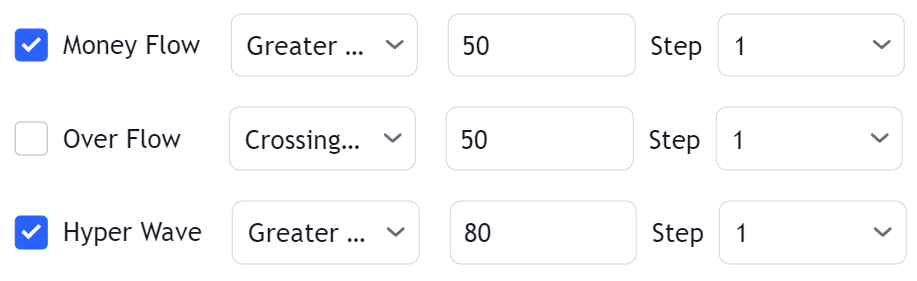
A custom alert can be triggered as an *any alert() function call* if the setting is selected or as a regular alert when selected in the Tradingview alert creator menu.
### Steps [#steps]
Steps allow creating a sequence of conditions, which when met trigger an alert. When a condition with a step equal to 1 is met the next condition associated with step 2 will be evaluated (if enabled) and so on for higher steps (if any).
Conditions with the same associated step will require for both conditions to be true in order for the condition associated to a higher step (if any) to be evaluated. This allows certain conditions to act as filters.
A user wishing to be alerted when the HyperWave cross under 80 after any bearish reversal signal could do it as follows:
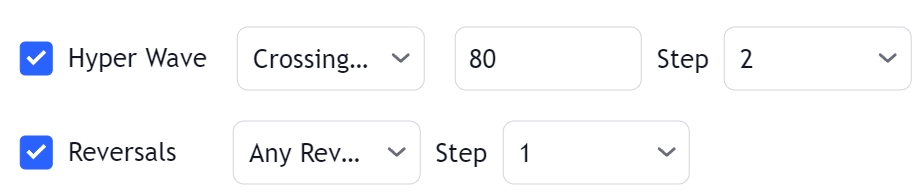
Make sure steps are set such that they form a linear sequence. For example if the lowest step is 2 or if the set steps are only 1 and 3 an error will be returned.
#### OR Step Operator [#or-step-operator]
The "OR" step operator can be used to get alerted for any additional condition using "OR" as step, in addition to other set custom alert conditions.
Conditions using the "OR" step can be highlighted using a different color, which can be set from the Custom Alert Creator settings.
#### All Step Operator [#all-step-operator]
The "All" step operator can be used to filter any set "Step" condition, including "OR" and "Invalidate".
This step operator can be useful if all the steps in a sequence needs to obey a specific rule.
If a user has 2 steps set, and requires both of these to occur at a specific time interval such as 9am to 1pm, then we can use a "Session" condition using the "All" step, requiring our step 1 and step 2 to be occur between 9am and 1pm.
#### Invalidate Step [#invalidate-step]
The "Invalidate" step allows to set a condition as an "invalidation condition". When this condition is triggered while a sequence of conditions is incomplete, the sequence will restart at step 1.
If multiple steps are set as "Invalidate" any of the conditions being true will reset the sequence of conditions, as such not all of them are required to be true for the sequence of conditions to reset.
Let's take an example where we use 2 regular steps and one "Invalidate" step. The alert will trigger when step 2 trigger after step 1 has been triggered.
Step 1 condition trigger, we will now evaluate step 2 from now on.
Invalidation step condition trigger, we reset the sequence and evaluate step 1 just after.
### Invalidation Behaviors [#invalidation-behaviors]
Invalidation behaviors allows adding more restrictions to a sequence of conditions, users can use two different invalidation behaviors described below:
#### Invalidate On Step 1 [#invalidate-on-step-1]
The "Invalidate On Step 1" behavior allows to reset an incomplete sequence of conditions when the condition on step 1 trigger. This prevents the first step condition from happening in between other steps of the condition sequence.
This behavior is useful when the first step of our sequence of conditions needs to never be repeated during the sequence.
Let's take an example where we use 3 regular steps.
Step 1 condition trigger, we will now evaluate step 2 from now on.
Step 2 condition trigger, we will now evaluate step 3 from now on.
Step 1 condition trigger, we start evaluating step 2 from now.
#### Invalidate On Any Repeated Step [#invalidate-on-any-repeated-step]
The "Invalidate On Any Repeated Step" behavior allows to reset an incomplete sequence of conditions when a step is triggered such that it does not respect the set order of conditions.
This behavior is useful when we want a perfectly ordered sequence of conditions to complete, without any step repeating itself.
Let's take an example where we use 3 regular steps.
Step 1 condition trigger, we will now evaluate step 2 from now on.
Step 2 condition trigger, we will now evaluate step 3 from now on.
Step 1 or 2 conditions trigger, we start evaluating step 1 from now.
### Maximum Step Interval [#maximum-step-interval]
Users can determine what is the maximum allowed horizontal distance (in bars) between two steps by enabling the "Maximum Step Interval" setting. This allows restricting steps separated by a large amount of bars.
If the amount of bars since a step exceed the set threshold, then the conditions sequence is reset, and we start evaluating from step 1 again.
### Highlight On Chart [#highlight-on-chart]
When a custom alert condition is set, a visual element is displayed at the bottom of the chart in order to more easily visualize when the custom alert conditions occur (displayed by default). Users can choose the location of this visual element (top, bottom of the oscillator or centered).
## Alerts Reference [#alerts-reference]
***
### Pre-Set Alerts [#pre-set-alerts]
| Alert | Description |
| ------------------------- | --------------------------------------------------------------------- |
| HyperWave Signal Up | Triggers on the event of an HyperWave signal up |
| HyperWave OS Signal Up | Triggers on the event of an HyperWave oversold signal up |
| HyperWave Signal Down | Triggers on the event of an HyperWave signal down |
| HyperWave OB Signal Down | Triggers on the event of an HyperWave overbought signal down |
| Reversal Up | Triggers on the event of a detected reversal up signal |
| Reversal Up + | Triggers on the event of a detected reversal up + signal |
| Reversal Down | Triggers on the event of a detected reversal down signal |
| Reversal Down + | Triggers on the event of a detected reversal down + signal |
| Bullish Divergence | Triggers on the event of a detected bullish divergence |
| Bearish Divergence | Triggers on the event of a detected bearish divergence |
| Strong Bullish Confluence | Triggers when a strong bullish confluence is detected |
| Weak Bullish Confluence | Triggers when a weak bullish confluence is detected |
| Strong Bearish Confluence | Triggers when a strong bearish confluence is detected |
| Weak Bearish Confluence | Triggers when a weak bearish confluence is detected |
| Bullish Overflow | Triggers when bullish overflow is detected |
| Bearish Overflow | Triggers when bearish overflow is detected |
| Custom Alert Condition | Triggers on the event of a user set custom alert condition being true |
### Any alert() Function Call [#any-alert-function-call-1]
| Alert | Description | Default |
| -------------------- | --------------------------------------------------------------------- | -------------------------------------------------------------------------- |
| HWO Signal Up | Triggers on the event of an HyperWave signal up | |
| Oversold | Triggers on the event of an HyperWave oversold signal up | |
| HWO Signal Down | Triggers on the event of an HyperWave signal down | |
| Overbought | Triggers on the event of an HyperWave overbought signal down | |
| Reversal Up | Triggers on the event of a detected reversal up signal | |
| + | Triggers on the event of a detected reversal up + signal | |
| Reversal Down | Triggers on the event of a detected reversal down signal | |
| + | Triggers on the event of a detected reversal down + signal | |
| Bullish Overflow | Triggers when bullish overflow is detected | |
| Bearish Overflow | Triggers when bearish overflow is detected | |
| Bullish Divergence | Triggers on the event of a detected bullish divergence | |
| Bearish Divergence | Triggers on the event of a detected bearish divergence | |
| Bullish Confluence | Triggers when a weak bullish confluence is detected | |
| Strong | Triggers when a strong bullish confluence is detected | |
| Bearish Confluence | Triggers when a weak bearish confluence is detected | |
| Strong | Triggers when a strong bearish confluence is detected | |
| Custom Alert Creator | Triggers on the event of a user set custom alert condition being true | |
# Confluence (/docs/algos/oscillator-matrix/confluence)
Confluence is an important aspect when dealing with multiple indicators. In this toolkit two features allows the users to easily assess if the confluence between each toolkit element in high or low.
## Confluence Zones [#confluence-zones]
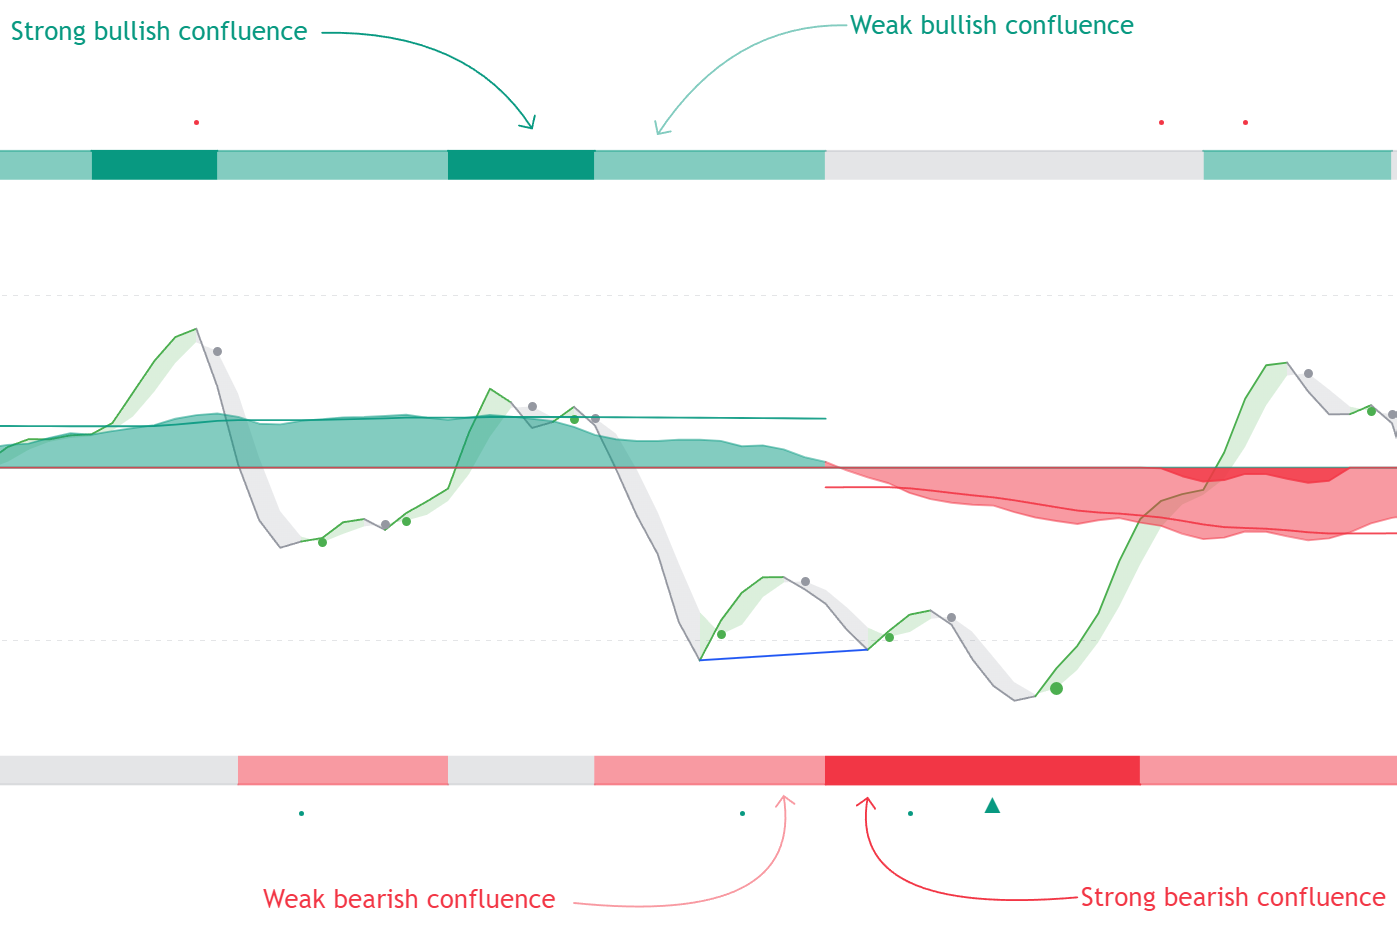
Users can see on the oscillators pane one upper (above 100) and lower (under 0) zone, measuring the bullish/bearish confluence between the Hyper Wave and Money Flow oscillators.
When both the Hyper Wave and Money Flow oscillators are indicating an uptrend the upper zone is colored with a darker green. If only one of the oscillators is indicating an uptrend then the confluence zone will have a brighter green. This logic applies to the lower zone in the case of a downtrend.
Confluence zones have an associated numerical that can be used in external scripts using the output "Upper Confluence Value" for the upper confluence zone and "Lower Confluence Value" for the lower confluence zone, returned values include:
* 2: Strong confluence
* 1: Weak confluence
* 0: No confluence
## Confluence Meter [#confluence-meter]
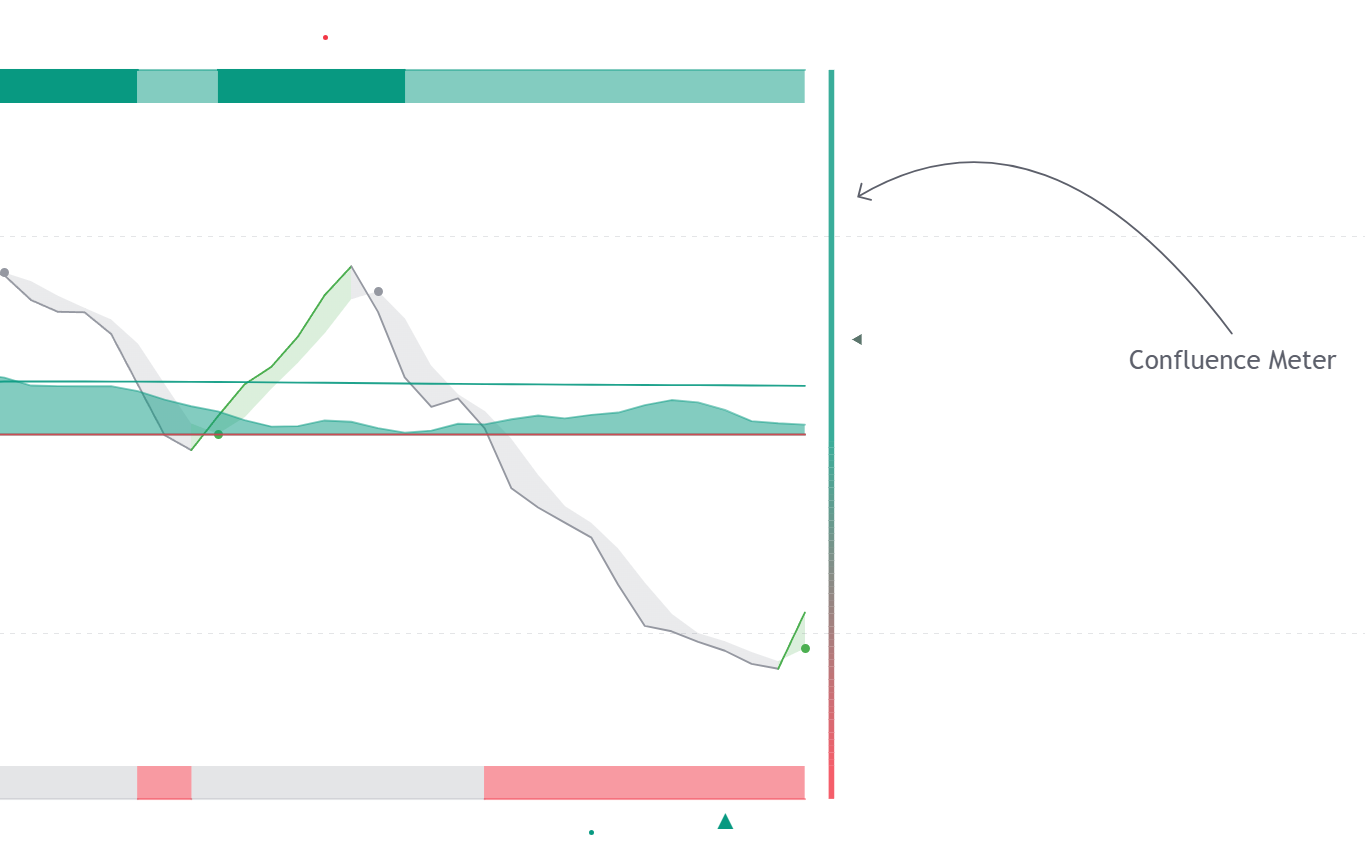
The confluence meter quantifies the amount of confluence between each indication returned by the oscillator, elements taken into account are:
* Trend indicated by the Hyper Wave relative to its signal line
* Trend indicated by the Hyper Wave
* Trend indicated by the Money Flow
* Overflow
* Divergences
The meter giving a higher measurement would be indicative of a more significant bullish confluence, that is most elements are indicative of a bullish trend, while a lower measurement would be indicative of a more significant bearish confluence.
The confluence meter had an associated numerical that can be used in external scripts using the output "Confluence Meter Value"
# HyperWave (/docs/algos/oscillator-matrix/hyperwave)
The HyperWave is a normalized adaptive oscillator aiming to precisely reflect price trends without returning a high amount of noise.
It is the primary oscillator used to detect trends/reversals within the LuxAlgo Oscillator Matrix®.
This oscillator is directly controlled by the **Main Length** setting, with higher values returning a smoother result reflecting longer term trends.
The HyperWave and every associated components (Signal line, turning points, divergences) can be disabled by toggling off "Show HyperWave"
## Signal Line [#signal-line]
The Hyper Wave includes a signal line allowing to reactively detect trend directions. The area between the Hyper Wave and its signal line is displayed to easily assess the current trend direction, with a color determined by the position of the Hyper Wave relative to its signal line.
Users can use two different algorithms for computing the signal line:
* SMA : A simple moving average of the Hyper Wave is used as signal line.
* TS : A trailing stop of the Hyper Wave is used as signal line. This algorithm makes the signal line less sensitive to noisy variations of the Hyper Wave.
| SMA | TS |
| ---------------------------------------------- | --------------------------------------------- |
|  |  |
The users can select the length of the signal line using the numerical input at the right of the **Signal** drop-down menu.
It can be more interesting to use a higher signal line length when the **Main Length** setting is high.
## Turning Points [#turning-points]
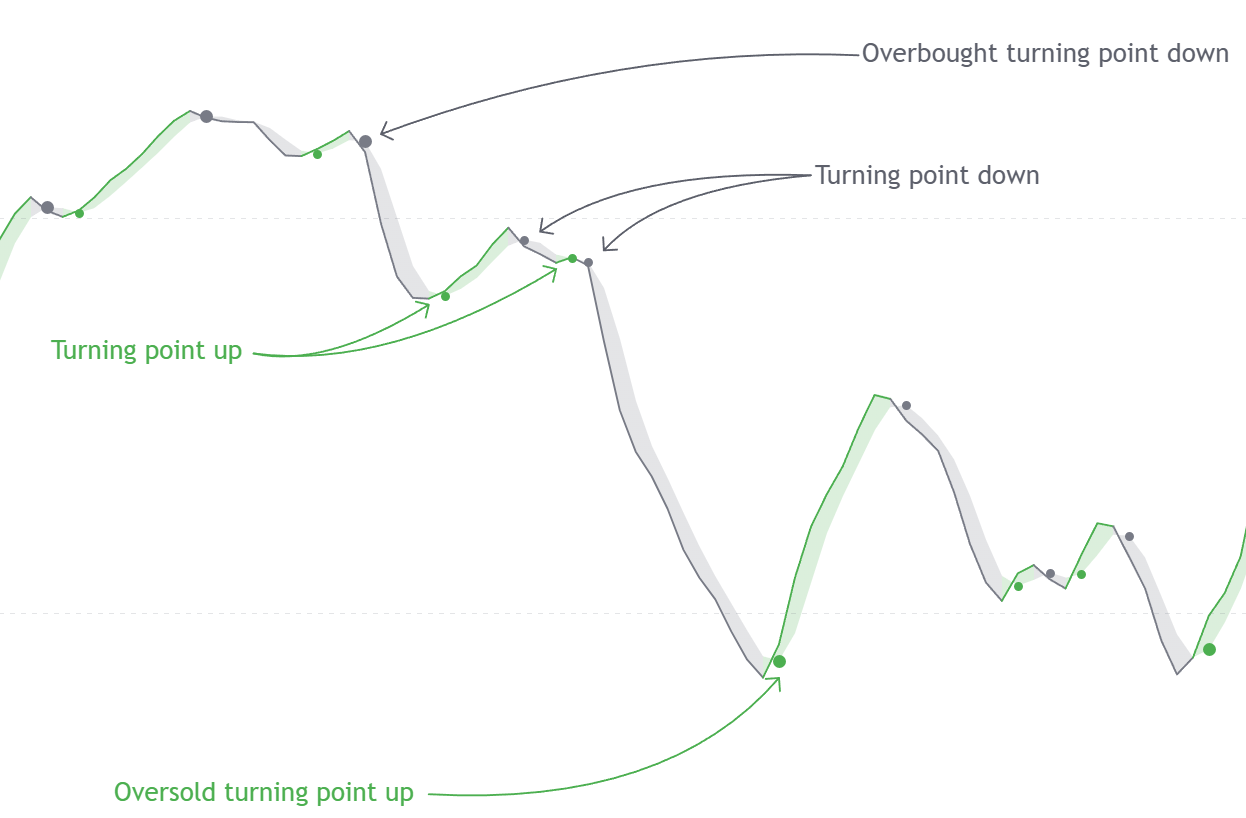
Crosses made between the HyperWave and its signal line are highlighted by dots on the oscillators pane, these are **turning points**.
By default, a Hyper Wave crossing over the signal line is highlighted in green while a Hyper Wave crossing under the signal line is highlighted in red.
### Overbought/Oversold Turning Points [#overboughtoversold-turning-points]
The displayed turning points exist in different sizes, with bigger dots occurring when the crosses are made within an overbought/oversold area.
* Oversold Turning Point : Occurs when the Hyper Wave cross over its signal line while the Hyper Wave is under 20
* Overbought Turning Point : Occurs when the Hyper Wave cross under its signal line while the Hyper Wave is over 80
## Real Time Divergences [#real-time-divergences]
Divergences between the price and the HyperWave oscillator are detected in real-time. The users can return longer term divergences by decreasing the **Divergence Sensitivity %**, with lower values of this setting making divergence detection more sensitive to noisy variations of the Hyper Wave.
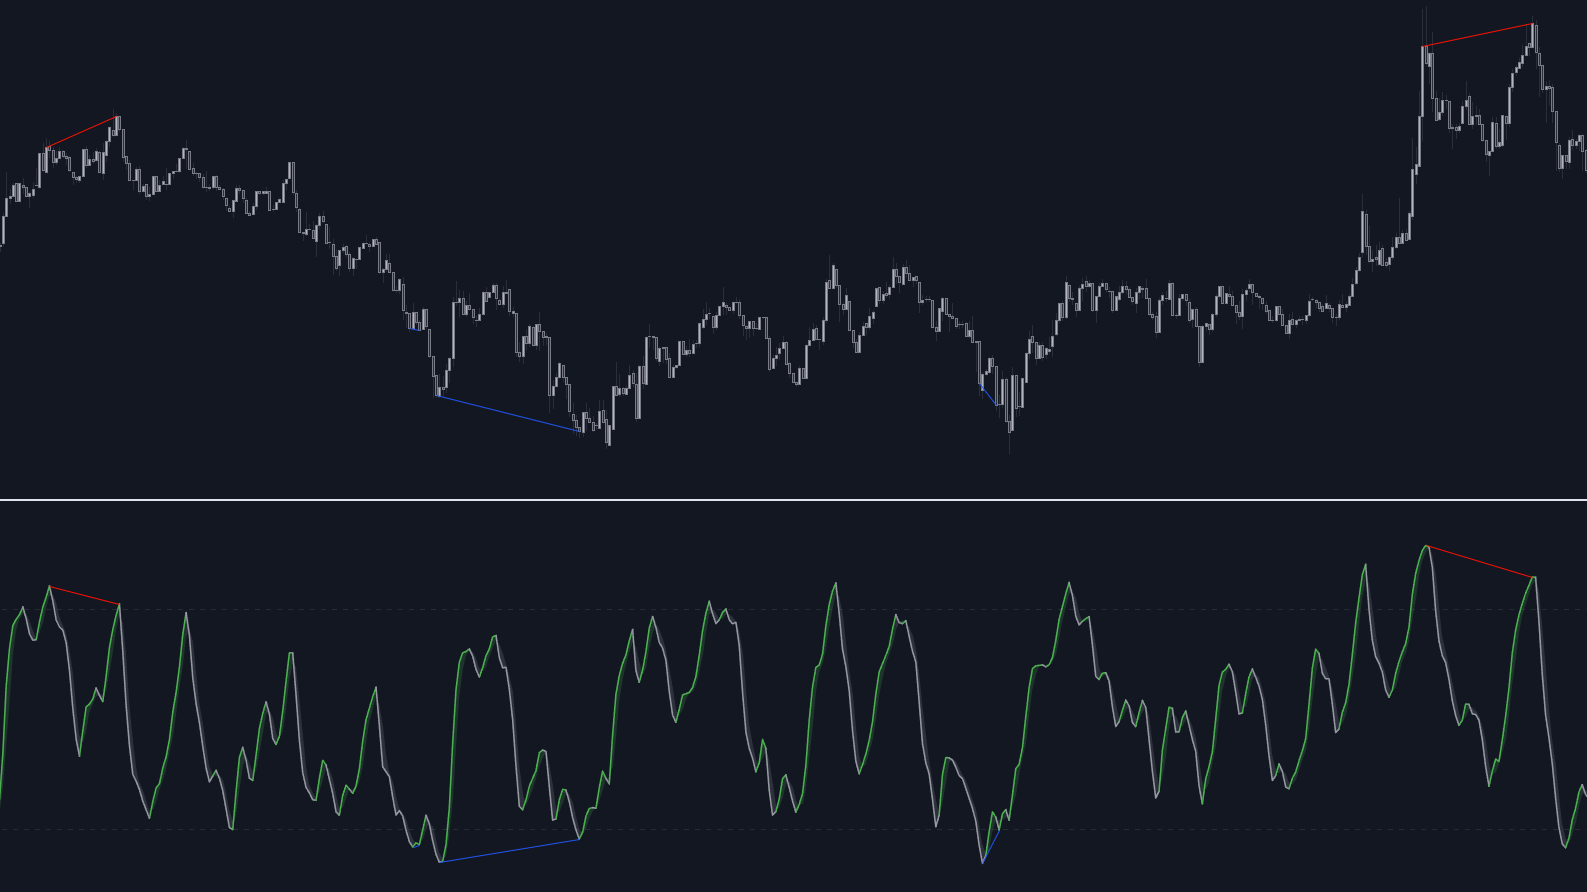
Divergences are highlighted by a blue line for bullish divergences and by a red line for bearish divergences.
### Divergences On Price Chart [#divergences-on-price-chart]
In order to reference the price points returning the divergence with the HyperWave, divergences lines are directly displayed on the user price chart thanks to "Show Divergences On Chart".
It is important to note that, unlike the divergence lines that appear in the oscillator pane, the divergence lines on the user chart do not appear exactly where the divergences are detected; rather, they are set retrospectively.
Because the amount of lines is limited to a maximum of 500, disabling "Show Divergences On Chart" can increase the amount of historical divergences highlighted on the oscillator pane.
# Introduction (/docs/algos/oscillator-matrix/introduction)
Oscillator Matrix® is an all-in-one indicator that incorporates 6+ unique components designed for interoperability & confluence with one another to provide a powerful trend following & reversal detection experience.
Users can create various ways to utilize the indicator's features together such as looking for excess money flowing into the market alongside strong reversal signals appearing, or getting real-time divergence signals alongside a lack of money flowing into the market to predict upcoming trends.
This indicator is described as an 'Oscillator Matrix' as it's made up of many different components that can create a systematic approach to analyzing markets alone, however, the indicator also can serve as a great secondary piece to a user's primary analysis with or without our other LuxAlgo Premium indicators.
## Features [#features]
Oscillator Matrix® toolkit includes the following features:
## Alerts [#alerts]
Oscillator Matrix® can alert the user for multiple conditions, learn more about the provided alert conditions/setups here:
## Settings Reference [#settings-reference]
Oscillator Matrix® includes various settings affecting the appearance and behavior of the toolkit, most of which are specific to the feature they affect.
Users can access the list of user settings and their descriptions in the following page:
# Reversal Signals (/docs/algos/oscillator-matrix/reversal-signals)
Oscillator Matrix® comes with a complete trend reversals detection system, allowing users to timely assess when a trend is changing direction.
## Classification [#classification]
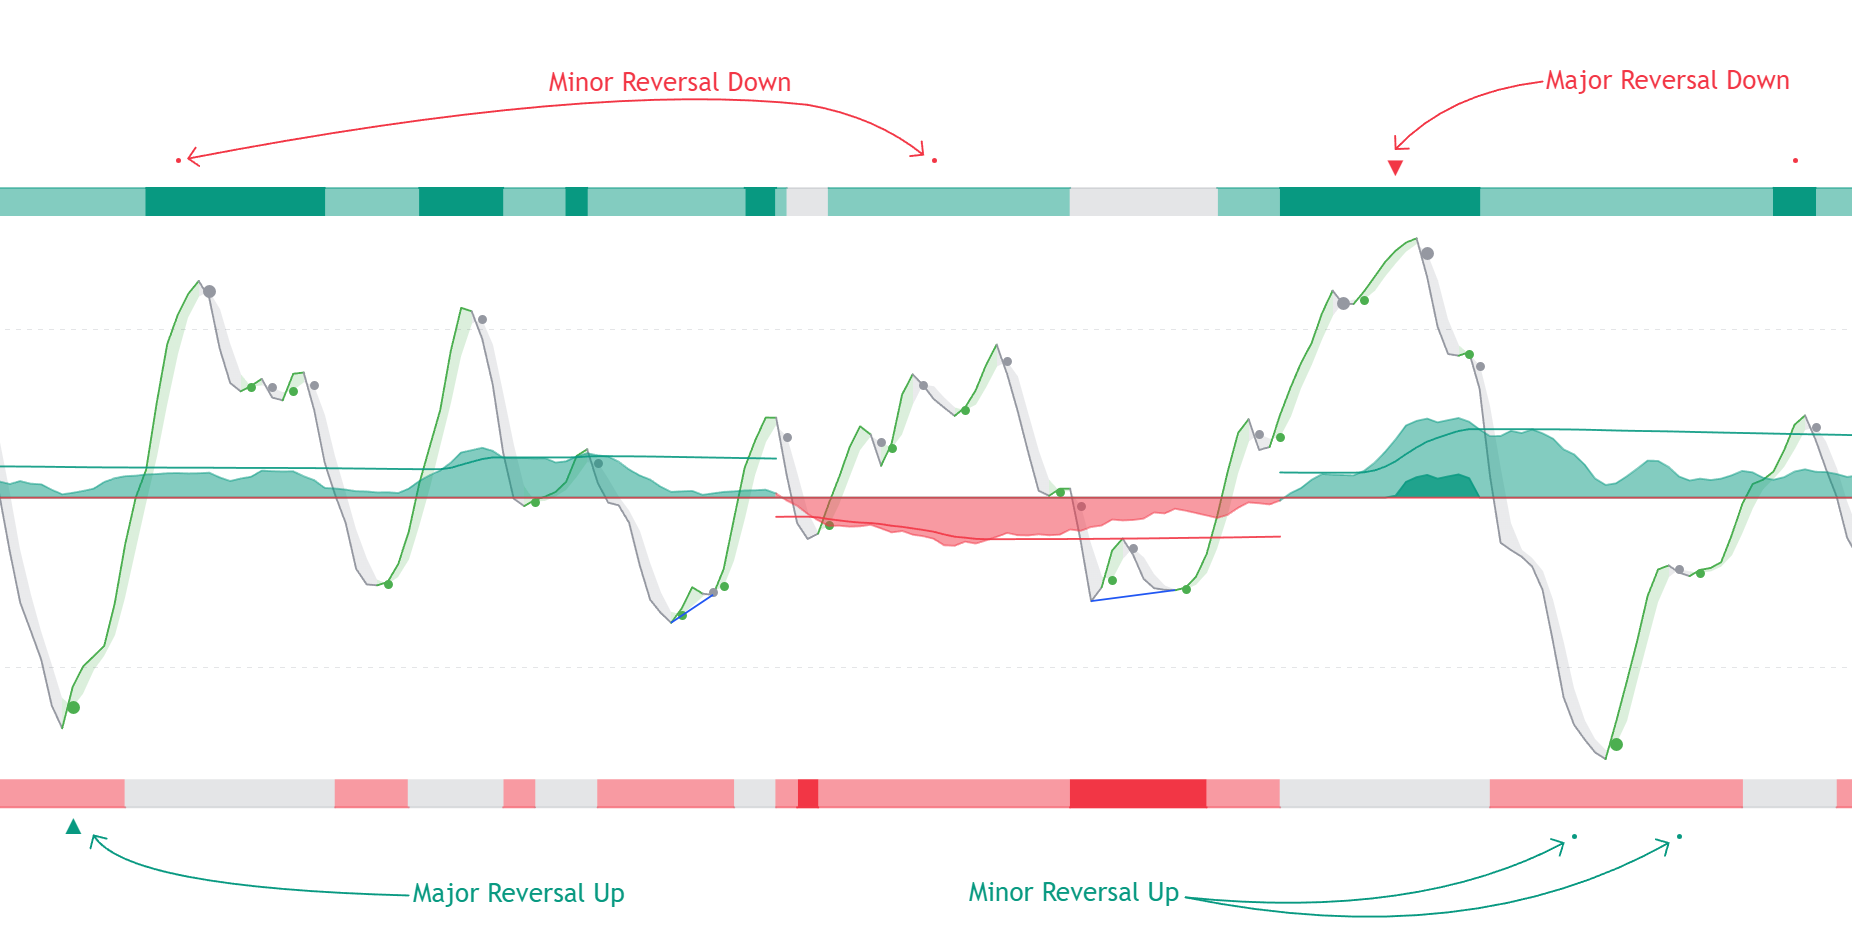
Different kind of reversals are returned on the oscillators pane, minor (-) and major (+) reversals signals.
Minor reversals are frequent signals often indicative of shorter term reversals, such as the top/bottom of an impulse (thus announcing a retracement). Minor reversals are highlighted by circles.
Major reversals can occur later in a trend, and can be indicative of a more significant reversals. Major reversals are highlighted by triangles.
# Settings Reference (/docs/algos/oscillator-matrix/settings)
To open the settings menu, place your mouse pointer over the indicator title on your chart, you will then see a list of icons appear, and click on the gear ⚙️ icon.
You can also open the settings panel by double-clicking any element displayed by the toolkit.
## Smart Money Flow [#smart-money-flow]
***
### Show Money Flow [#show-money-flow]
Display Smart Money Flow oscillator
### Money Flow [#money-flow]
Money flow oscillator length, higher values will highlight longer term money flow.
### Smooth [#smooth]
Money flow oscillator smoothing amount, higher values will return a smoother Money Flow oscillator.
## HyerWave [#hyerwave]
***
### Show HyerWave [#show-hyerwave]
Display HyperWave oscillator
### HyperWave Length [#hyperwave-length]
HyperWave length setting. Higher values will highlight longer term variations from the HyperWave oscillator.
### Signal [#signal]
Type of signal line displayed alongside the HyperWave.
Length of the signal method applied to the HyperWave oscillator, higher values will return longer term signals returned from the HyperWave.
### Colors [#colors]
Transparency of the area between the HyperWave and its signal plot.
## HyperWave Divergences [#hyperwave-divergences]
***
### Divergences Sensitivity % [#divergences-sensitivity-]
Sensitivity of the divergences detection algorithm, with lower values will return fewer and longer-term divergences.
### Show Divergences [#show-divergences]
Display divergences between the price and HyperWave oscillator on the oscillator pane.
### Show Divergences On Chart [#show-divergences-on-chart]
Display divergences between the price and HyperWave oscillator on the price chart.
## Reversals [#reversals]
***
### Reversal Factor [#reversal-factor]
Controls the frequency at which reversals are detected by the HyperWave, with higher values returning less frequent and longer term potential reversals.
### Show Reversals [#show-reversals]
Display reversal signals at the top/bottom of the indicator pane.
## Confluence [#confluence]
***
### Upper Confluence [#upper-confluence]
Display upper confluence area.
### Lower Confluence [#lower-confluence]
Display lower confluence area.
### Show Confluence Meter [#show-confluence-meter]
Display confluence meter.
### Meter Width [#meter-width]
Width of the confluence meter.
## Custom Alert Creator [#custom-alert-creator]
***
### Money Flow [#money-flow-1]
Enable the selected Money Flow condition to be used in the custom alert creator.
Comparison operator used to compare the current Money Flow value with the inline numerical input.
Value used to compare the Money Flow with.
#### Step [#step]
Money Flow condition step in the custom alert creator sequence.
### Overflow [#overflow]
Enable the selected Overflow condition to be used in the custom alert creator.
Comparison operator used to compare the current Overflow value with the inline numerical input.
Value used to compare the Overflow with.
#### Step [#step-1]
Overflow condition step in the custom alert creator sequence.
### HyperWave [#hyperwave]
Enable the selected HyperWave condition to be used in the custom alert creator.
HyperWave conditions. Includes comparison operators used to compare the current HyperWave value with the inline numerical input.
Value used to compare the HyperWave with if a comparison operator is selected in the dropdown conditions.
#### Step [#step-2]
HyperWave condition step in the custom alert creator sequence.
### Reversals [#reversals-1]
Enable the selected Reversal condition to be used in the custom alert creator.
Reversal conditions.
#### Step [#step-3]
Reversal condition step in the custom alert creator sequence.
### Divergences [#divergences]
Enable the selected Divergences condition to be used in the custom alert creator.
Divergences conditions.
#### Step [#step-4]
Divergences condition step in the custom alert creator sequence.
### Confluence [#confluence-1]
Enable the selected Confluence condition to be used in the custom alert creator.
Confluence conditions.
#### Step [#step-5]
Confluence condition step in the custom alert creator sequence.
### Confluence Meter [#confluence-meter]
Enable the selected Confluence Meter condition to be used in the custom alert creator.
Comparison operator used to compare the current Confluence Meter value with the inline numerical input.
Value used to compare the Confluence Meter with.
#### Confluence Meter Step [#confluence-meter-step]
Confluence Meter condition step in the custom alert creator sequence.
### External Condition (1) [#external-condition-1]
Enable the selected External condition to be used in the custom alert creator.
...
Other external indicator outputs can be used as source.
First source input.
Comparison operator used to compare the two selected sources.
...
Other external indicator outputs can be used as source.
Second source input.
#### External Step (1) [#external-step-1]
First external source condition step in the custom alert creator sequence.
### External Condition (2) [#external-condition-2]
Enable the selected External condition to be used in the custom alert creator.
...
Other external indicator outputs can be used as source.
First source input.
Comparison operator used to compare the two selected sources.
...
Other external indicator outputs can be used as source.
Second source input.
#### External Step (2) [#external-step-2]
Second external source condition step in the custom alert creator sequence.
### External Condition (3) [#external-condition-3]
Enable the selected External condition to be used in the custom alert creator.
...
Other external indicator outputs can be used as source.
Source input.
Comparison operator used to compare the selected source to the selected numerical value.
Numerical input.
#### External Step (3) [#external-step-3]
Third external source condition step in the custom alert creator sequence.
### Invalidation Behavior [#invalidation-behavior]
No invalidation behavior.
The "Invalidate On Step 1" behavior allows to reset an incomplete sequence of conditions when the condition on step 1 trigger. This prevents the first step condition from happening in between other steps of the condition sequence.
This behavior is useful when the first step of our sequence of conditions needs to never be repeated during the sequence.
Let's take an example where we use 3 regular steps.
Step 1 condition trigger, we will now evaluate step 2 from now on.
Step 2 condition trigger, we will now evaluate step 3 from now on.
Step 1 condition trigger, we start evaluating step 2 from now.
The "Invalidate On Any Repeated Step" behavior allows to reset an incomplete sequence of conditions when a step is triggered such that it does not respect the user-set order of conditions.
This behavior is useful when we want a perfectly ordered sequence of conditions to complete, without any step repeating itself.
Let's take an example where we use 3 regular steps.
Step 1 condition trigger, we will now evaluate step 2 from now on.
Step 2 condition trigger, we will now evaluate step 3 from now on.
Step 1 or 2 conditions trigger, we start evaluating step 1 from now.
Invalidation behaviors allows adding more restrictions to a sequence of conditions, users can use two different invalidation behaviors described below.
### Maximum Step Interval [#maximum-step-interval]
Maximum allowed horizontal distance (in bars) between two steps.
If the amount of bars since a step exceed the selected threshold, then the conditions sequence is reset, and we start evaluating from step 1 again.
### Highlight Custom Alert Triggers [#highlight-custom-alert-triggers]
When a custom alert condition is set, a visual element is displayed at the bottom of the chart in order to more easily visualize when the custom alert conditions occurs (displayed by default).
## Calculation [#calculation]
***
### Calculated Bars [#calculated-bars]
Amount of most recent bars used for the calculation of the toolkit. Lower values allow returning faster computation times.
# Smart Money Flow (/docs/algos/oscillator-matrix/smart-money-flow)
Money Flow and liquidity are core concepts with the Oscillator Matrix®. Various elements centered around this concept are provided to detect longer term trends, assess market participants behaviours, and detect reversals.
The Money Flow and every associated components (overflow, thresholds) can be disabled by toggling off "Show Money Flow"
## Money Flow [#money-flow]
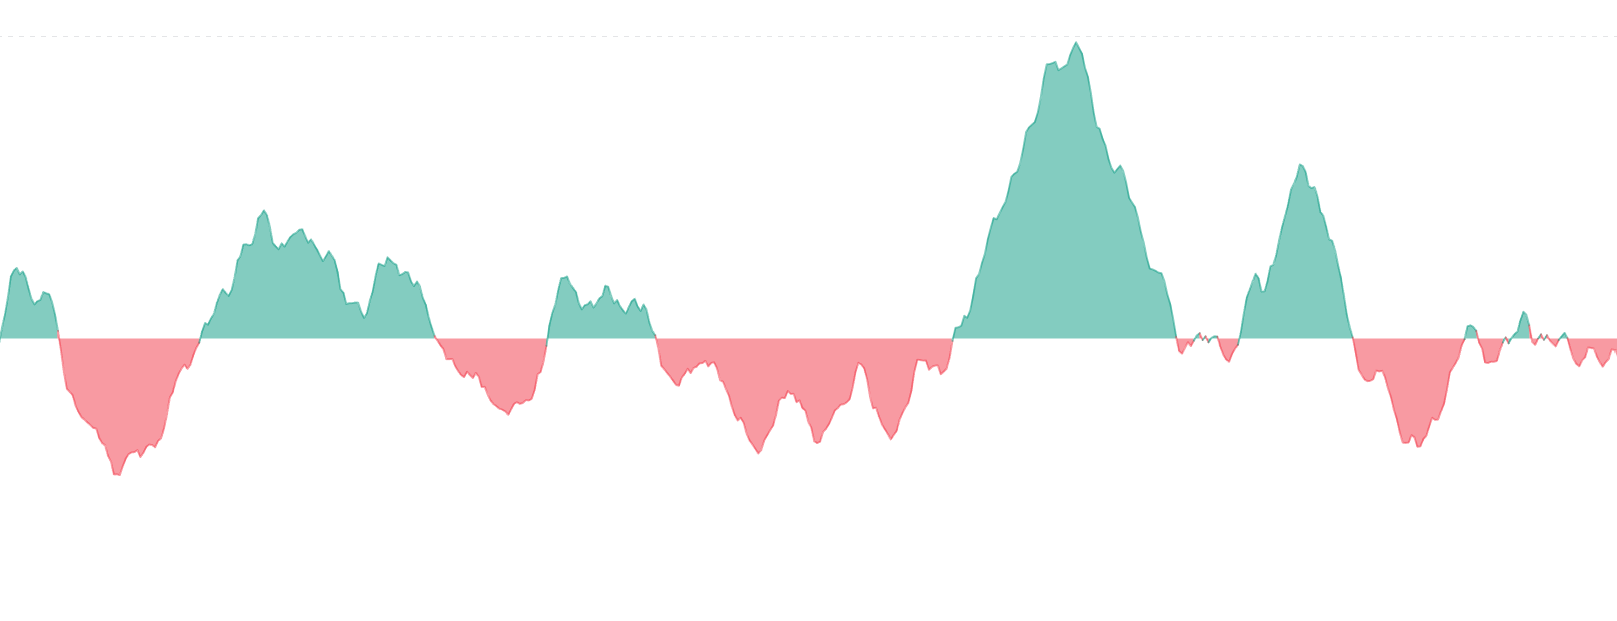
The toolkit include one money flow indicator that aims to detect trends based on market participants activity.
Compared to the Hyper Wave the Money Flow oscillator can return longer term indications and be used to support shorter term indications.
## Overflow [#overflow]
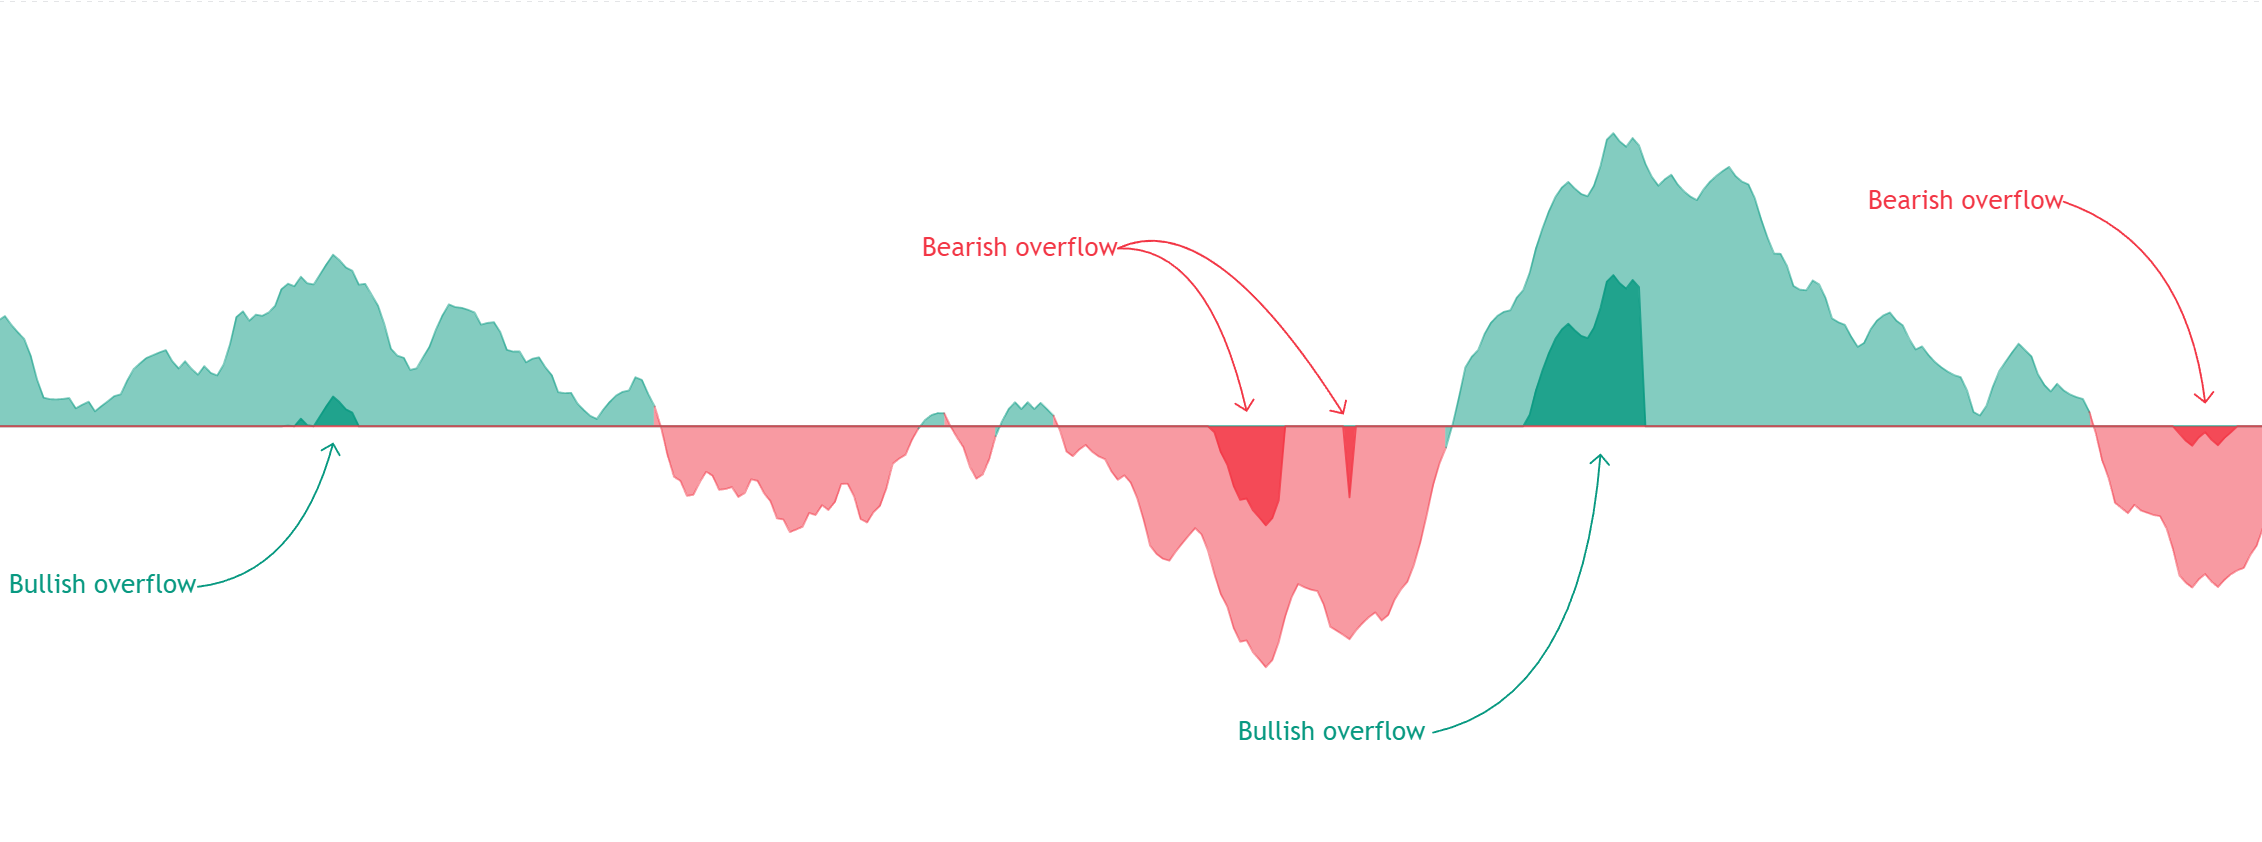
Overflow occurs when excessive liquidity relative to a trend length enters the market, this can highlight late trend following participants entering the market, and can announce potential reversals.
### Money Flow Thresholds [#money-flow-thresholds]
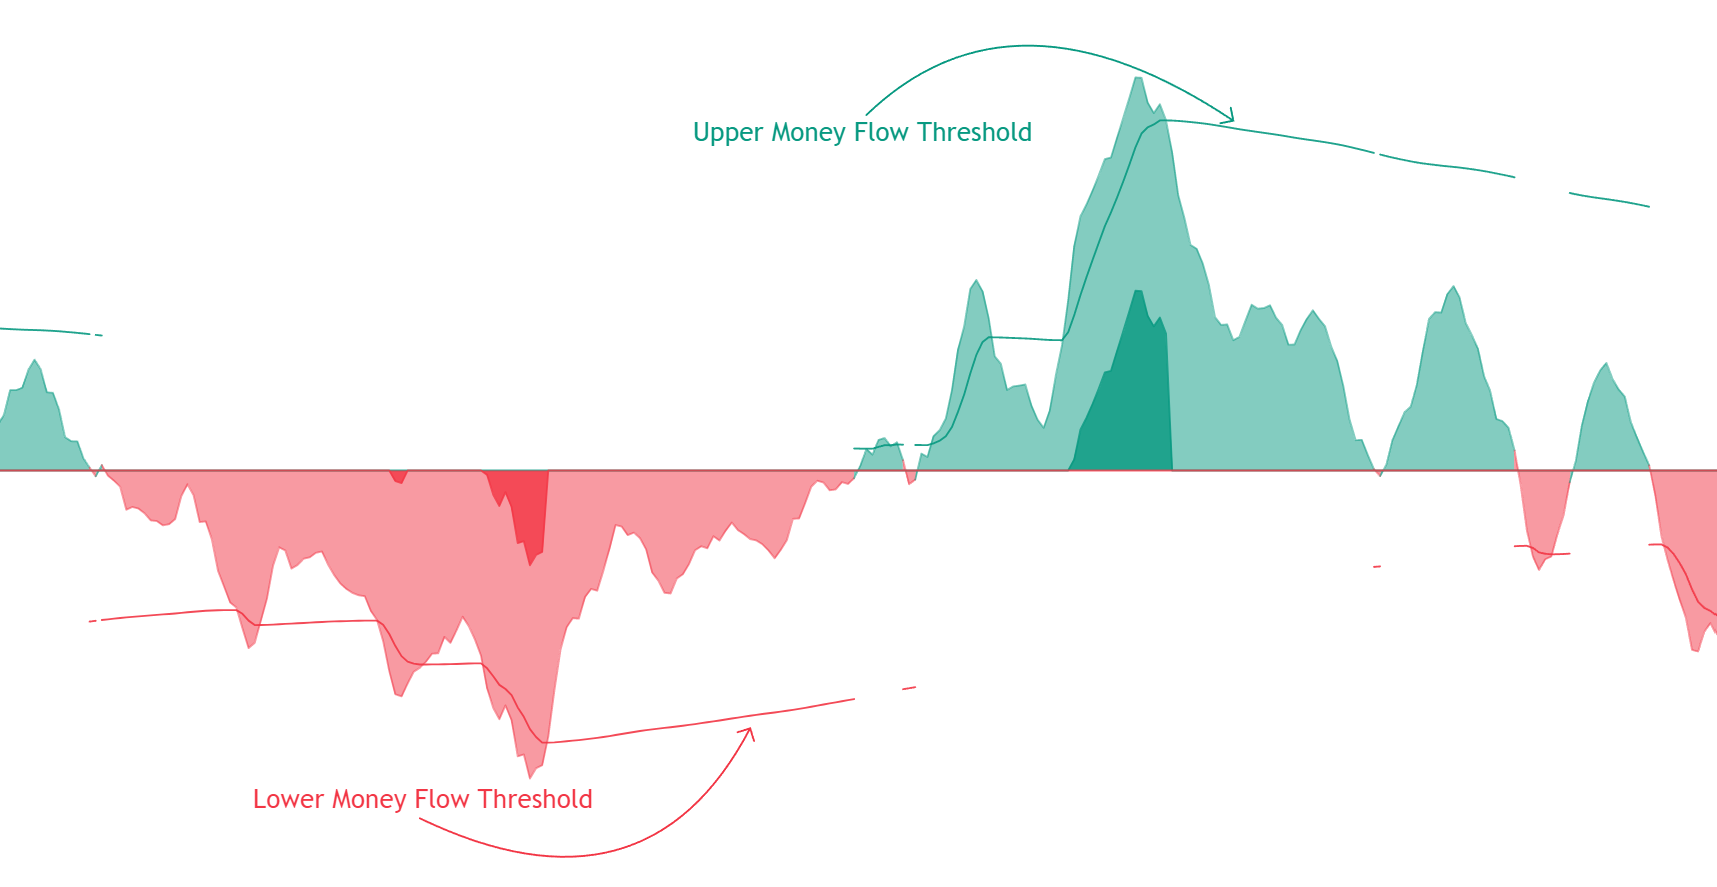
Users can gauge market activity by using the provided Money Flow thresholds, two extremities displayed above/under the central 50 levels.
When the Money Flow oscillator is above the upper threshold there is significant one-sided bullish activity on the market. When the Money Flow oscillator is under the lower threshold there is significant one-sided bearish activity on the market.
Money flow fluctuating within the thresholds can highlight a more balanced market.
# Alerts (/docs/algos/price-action-concepts/alerts)
The Price Action Concepts® can alert users for multiple events relevant to the existing features in the toolkit. To learn more about how to set alerts in general see [how to create alerts on tradingview](/docs/getting-started/tradingview-alerts).
In order for an alert to work in the toolkit make sure the related feature is enabled
## Any Alert() Function Call [#any-alert-function-call]
Users can create a single alert for multiple conditions using the *any alert() function call* alert condition. Conditions users want to be alerted for are grouped by the type of features they affect (structures, volumetric order blocks, imbalances...etc) and are located at the bottom of the toolkit settings.
Once conditions are toggled on users only need to set an alert using the *any alert() function call* as condition.
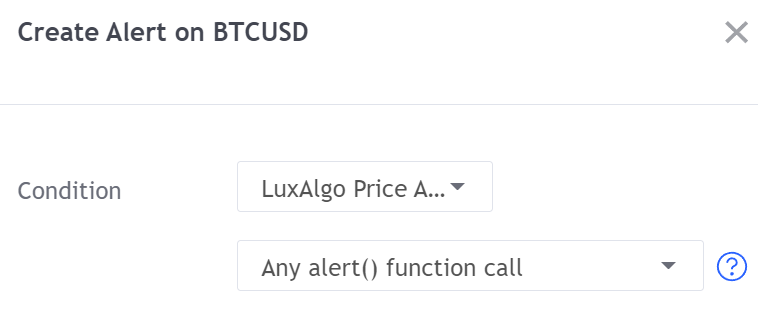
### Any Alert() Function Call Message [#any-alert-function-call-message]
Users can set a custom message that will be used when an any alert() function call condition is triggered in the message field below the list of conditions. Users can use placeholders to customize messages and return useful information, the following placeholders are supported:
#### Symbol Placeholders [#symbol-placeholders]
| Placeholder | Description | Example |
| ------------ | ------------------------------------------------------- | ------------------------------- |
| `{default}` | Default message associated with the trigerred condition | `"Mitigated Bullish Imbalance"` |
| `{ticker}` | Symbol ticker without the exchange prefix | `"MSFT"` |
| `{exchange}` | Symbol exchange/data source | `"COINBASE"` |
| `{sector}` | Sector of the symbol, `na` if the symbol has no sector | `"Technology Services"` |
| `{market}` | Symbol market type | `"Stocks"` |
#### Time Placeholders [#time-placeholders]
| Placeholder | Description | Example |
| ----------- | -------------------------------------------------------------------------------------- | ----------------- |
| `{tf}` | Chart timeframe, includes "S" for seconds, "D" for days, "W" for weeks, "M" for months | `"15"` |
| `{time}` | Unix time in milliseconds in exchange timezone | `"1705331385158"` |
| `{year}` | Current year in exchange timezone | `"2024"` |
| `{month}` | Current month in exchange timezone | `"7"` |
| `{day}` | Current day of the month in exchange timezone | `"21"` |
#### Data Placeholders [#data-placeholders]
| Placeholder | Description | Example |
| ------------------ | --------------------------------------------- | ---------- |
| `{open}` | Opening price | `"1.2145"` |
| `{high}` | High price | `"1.2357"` |
| `{low}` | Low price | `"1.1983"` |
| `{close}` | Closing price | `"1.0569"` |
| `{volume}` | Current volume | `"45216"` |
| `{ob_buy_volume}` | Most recent order block internal buy volume | `"560"` |
| `{ob_sell_volume}` | Most recent order block internal sell volume | `"480"` |
| `{ob_volume}` | Most recent order block total internal volume | `"1040"` |
### Format as JSON [#format-as-json]
Use the following message template to receive "any alert() function call" messages in the JSON format:
```json
{
"alert": "{default}",
"ticker": "{ticker}",
"tf": "{tf}",
"ohlcv":{
"open": {open},
"high": {high},
"low": {low},
"close": {close},
"volume": {volume},
"order block buy volume": {ob_buy_volume},
"order block sell volume": {ob_sell_volume},
"order block total volume": {ob_volume}
},
"bartime": {time}
}
```
## Custom Alert Creator [#custom-alert-creator]
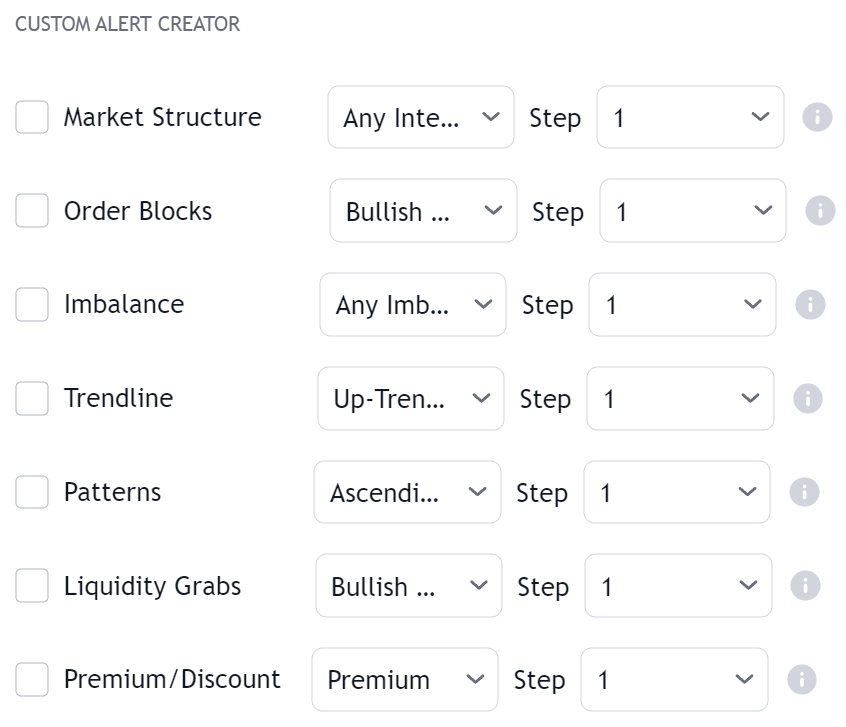
Users wishing to construct more complex alerts using features within the toolkit and/or external indicators can use the **Custom Alert Creator**.
The custom alert creator allows alerting when various user-set conditions are met or when a sequence of conditions is complete.
A user wishing to be alerted when any internal market structure occurs within 1AM and 5AM of the symbol timezone could do it as follows:
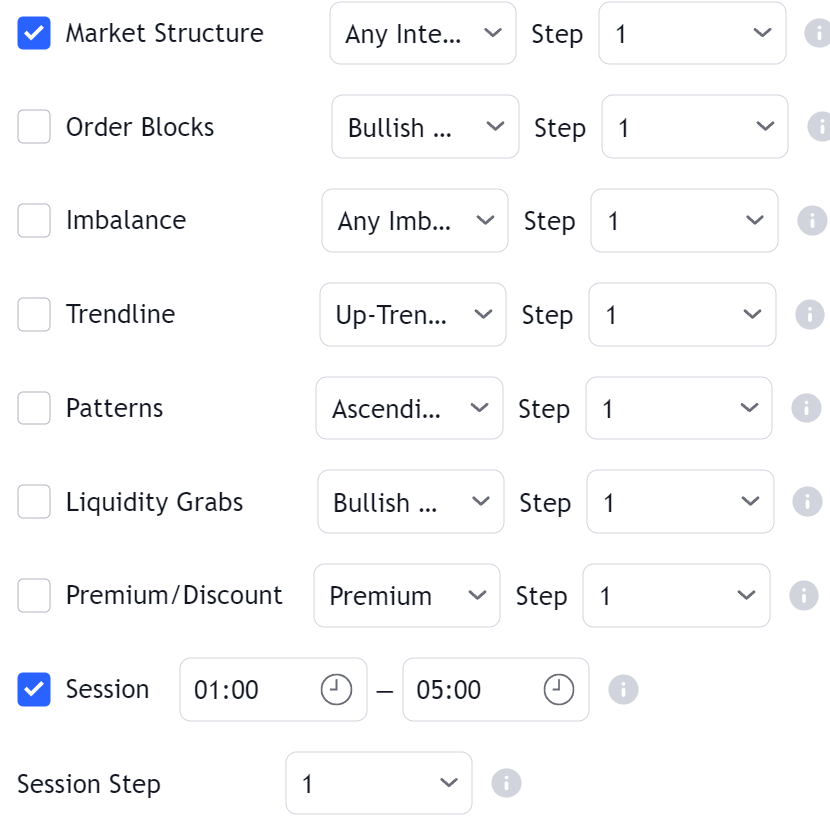
A custom alert can be triggered as an *any alert() function call* if the setting is selected or as a regular alert when selected in the Tradingview alert creator menu.
### Steps [#steps]
Steps allow creating a sequence of conditions, which when met trigger an alert. When a condition with a step equal to 1 is met the next condition associated with step 2 will be evaluated (if enabled) and so on for higher steps (if any).
Conditions with the same associated step will require both conditions to be true in order for the condition associated with a higher step (if any) to be evaluated. This allows certain conditions to act as filters.
A user wishing to be alerted when the price enters a bullish imbalance after any internal bullish market structure could do it as follows:
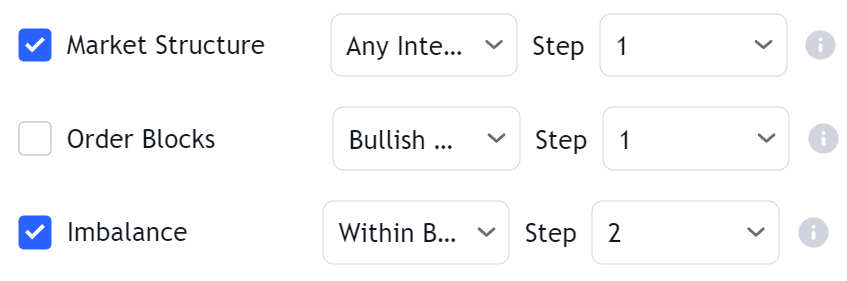
*Make sure internal market structures and imbalances are enabled*.
Make sure steps are set such that they form a linear sequence. For example, if the lowest step is 2 or if the set steps are only 1 and 3 an error will be returned.
#### OR Step Operator [#or-step-operator]
The "OR" step operator can be used to get alerted for any additional condition using "OR" as a step, in addition to other set custom alert conditions.
Conditions using the "OR" step can be highlighted using a different color, which can be set from the Custom Alert Creator settings. Users can choose the location of this visual element (top or bottom of the chart).
#### All Step Operator [#all-step-operator]
The "All" step operator can be used to filter any set "Step" condition, including "OR" and "Invalidate".
This step operator can be useful if all the steps in a sequence needs to obey a specific rule.
If a user has 2 steps set, and requires both of these to occur at a specific time interval such as 9am to 1pm, then we can use a "Session" condition using the "All" step, requiring our step 1 and step 2 to be occur between 9am and 1pm.
#### Invalidate Step [#invalidate-step]
The "Invalidate" step allows to set a condition as an "invalidation condition". When this condition is triggered while a sequence of conditions is incomplete, the sequence will restart at step 1.
If multiple steps are set as "Invalidate" any of the conditions being true will reset the sequence of conditions, as such not all of them are required to be true for the sequence of conditions to reset.
Let's take an example where we use 2 regular steps and one "Invalidate" step. The alert will trigger when step 2 trigger after step 1 has been triggered.
Step 1 condition trigger, we will now evaluate step 2 from now on.
Invalidation step condition trigger, we reset the sequence and evaluate step 1 just after.
### Invalidation Behaviors [#invalidation-behaviors]
Invalidation behaviors allows adding more restrictions to a sequence of conditions, users can use two different invalidation behaviors described below:
#### Invalidate On Step 1 [#invalidate-on-step-1]
The "Invalidate On Step 1" behavior allows to reset an incomplete sequence of conditions when the condition on step 1 trigger. This prevents the first step condition from happening in between other steps of the condition sequence.
This behavior is useful when the first step of our sequence of conditions needs to never be repeated during the sequence.
Let's take an example where we use 3 regular steps.
Step 1 condition trigger, we will now evaluate step 2 from now on.
Step 2 condition trigger, we will now evaluate step 3 from now on.
Step 1 condition trigger, we start evaluating step 2 from now.
#### Invalidate On Any Repeated Step [#invalidate-on-any-repeated-step]
The "Invalidate On Any Repeated Step" behavior allows to reset an incomplete sequence of conditions when a step is triggered such that it does not respect the set order of conditions.
This behavior is useful when we want a perfectly ordered sequence of conditions to complete, without any step repeating itself.
Let's take an example where we use 3 regular steps.
Step 1 condition trigger, we will now evaluate step 2 from now on.
Step 2 condition trigger, we will now evaluate step 3 from now on.
Step 1 or 2 conditions trigger, we start evaluating step 1 from now.
### Maximum Step Interval [#maximum-step-interval]
Users can determine what is the maximum allowed horizontal distance (in bars) between two steps by enabling the "Maximum Step Interval" setting. This allows restricting steps separated by a large amount of bars.
If the amount of bars since a step exceed the set threshold, then the conditions sequence is reset, and we start evaluating from step 1 again.
### Highlight On Chart [#highlight-on-chart]
When a custom alert condition is set, a visual element is displayed at the bottom of the chart in order to more easily visualize when the custom alert condition occurs (displayed by default).
## Alerts Reference [#alerts-reference]
***
### Pre-Set Alerts [#pre-set-alerts]
| Alert | Description |
| --------------------------- | ---------------------------------------------------------------------------------- |
| Bullish I-BOS | Triggers on the event of an internal bullish break of structure (BOS) |
| Bullish I-CHOCH | Triggers on the event of an internal bullish change of character (CHOCH) |
| Bullish I-CHOCH+ | Triggers on the event of a Supported internal bullish change of character (CHOCH+) |
| Bearish I-BOS | Triggers on the event of an internal bearish break of structure (BOS) |
| Bearish I-CHOCH | Triggers on the event of an internal bearish change of character (CHOCH) |
| Bearish I-CHOCH+ | Triggers on the event of a Supported internal bearish change of character (CHOCH+) |
| Bullish S-BOS | Triggers on the event of a swing bullish break of structure (BOS) |
| Bullish S-CHOCH | Triggers on the event of a swing bullish change of character (CHOCH) |
| Bullish S-CHOCH+ | Triggers on the event of a Supported swing bullish change of character (CHOCH+) |
| Bearish S-BOS | Triggers on the event of a swing bearish break of structure (BOS) |
| Bearish S-CHOCH | Triggers on the event of a swing bearish change of character (CHOCH) |
| Bearish S-CHOCH+ | Triggers on the event of a Supported swing bearish change of character (CHOCH+) |
| Equal Highs | Triggers on the event of an equal high (EQH) |
| Equal Lows | Triggers on the event of an equal low (EQL) |
| Bullish OB Created | Triggers when a new bullish order block is created |
| Bearish OB Created | Triggers when a new bearish order block is created |
| Bullish OB Mitigated | Triggers when a bullish order block (visible or not) is mitigated |
| Bearish OB Mitigated | Triggers when a bearish order block (visible or not) is mitigated |
| Bullish Breaker | Triggers when a bullish order block (visible or not) becomes a breaker block |
| Bearish Breaker | Triggers when a bearish order block (visible or not) becomes a breaker block |
| Within Bullish OB | Triggers when the price is located within a bullish order block (visible or not) |
| Within Bearish OB | Triggers when the price is located within a bearish order block (visible or not) |
| Bullish OB Entered | Triggers when the price enters a bullish order block (visible or not) |
| Bearish OB Entered | Triggers when the price enters a bearish order block (visible or not) |
| Bullish Imbalance | Triggers when a new bullish imbalance is detected |
| Bearish Imbalance | Triggers when a new bearish imbalance is detected |
| Bullish Imbalance Mitigated | Triggers when a bullish imbalance (visible or not) is mitigated |
| Bearish Imbalance Mitigated | Triggers when a bearish imbalance (visible or not) is mitigated |
| Broken Uptrendline | Triggers when an upward trendline is broken |
| Broken Downtrendline | Triggers when a downward trendline is broken |
| Bullish Grab | Triggers when a new bullish liquidity grab is detected |
| Bearish Grab | Triggers when a new bearish liquidity grab is detected |
| Custom Alert Condition | Triggers on the event of a user set custom alert condition being true |
### Any alert() Function Call [#any-alert-function-call-1]
***
#### Custom Alert Creator [#custom-alert-creator-1]
| Alert | Description | Default |
| ------------------------------------ | --------------------------------------------------------------------- | --------------------------------------------------------- |
| Trigger as any alert() function call | Triggers on the event of a user set custom alert condition being true | |
#### Market Structures [#market-structures]
| Alert | Description | Default |
| ---------------- | ---------------------------------------------------------------------------------- | -------------------------------------------------------- |
| Bullish I-BOS | Triggers on the event of an internal bullish break of structure (BOS) | |
| Swing BOS | Triggers on the event of a swing bullish break of structure (BOS) | |
| Bearish I-BOS | Triggers on the event of an internal bearish break of structure (BOS) | |
| Swing BOS | Triggers on the event of a swing bearish break of structure (BOS) | |
| Bullish I-CHOCH | Triggers on the event of an internal bullish change of character (CHOCH) | |
| Swing CHOCH | Triggers on the event of a swing bullish change of character (CHOCH) | |
| Bullish I-CHOCH+ | Triggers on the event of a Supported internal bullish change of character (CHOCH+) | |
| Swing CHOCH+ | Triggers on the event of a Supported swing bullish change of character (CHOCH+) | |
| Bearish I-CHOCH | Triggers on the event of an internal bearish change of character (CHOCH) | |
| Swing CHOCH | Triggers on the event of a swing bearish change of character (CHOCH) | |
| Bearish I-CHOCH+ | Triggers on the event of a Supported internal bearish change of character (CHOCH+) | |
| Swing CHOCH+ | Triggers on the event of a Supported swing bearish change of character (CHOCH+) | |
#### Volumetric Order Blocks [#volumetric-order-blocks]
| Alert | Description | Default |
| -------------------- | -------------------------------------------------------------------------------- | --------------------------------------------------------------------- |
| Bullish OB | Triggers when a new bullish order block is created | |
| Bearish OB | Triggers when a new bearish order block is created | |
| Bullish OB Mitigated | Triggers when a bullish order block (visible or not) is mitigated | |
| Bearish OB Mitigated | Triggers when a bearish order block (visible or not) is mitigated | |
| Bullish Breaker | Triggers when a bullish order block (visible or not) becomes a breaker block | |
| Bearish Breaker | Triggers when a bearish order block (visible or not) becomes a breaker block | |
| Within Bullish OB | Triggers when the price is located within a bullish order block (visible or not) | |
| Within Bearish OB | Triggers when the price is located within a bearish order block (visible or not) | |
| Bullish OB Entered | Triggers when the price enters a bullish order block (visible or not) | |
| Bearish OB Entered | Triggers when the price enters a bearish order block (visible or not) | |
| Bullish OB Exited | Triggers when the price exits a bullish order block | |
| Bearish OB Exited | Triggers when the price exits a bearish order block | |
#### Imbalances [#imbalances]
| Alert | Description | Default |
| --------------------------- | ------------------------------------------------------------------------ | ----------------------------------------------------- |
| Any New Imbalance | Triggers when a bullish or bearish imbalance is identified | |
| Bullish New Imbalance | Triggers when a bullish imbalance is identified | |
| Bearish New Imbalance | Triggers when a bearish imbalance is identified | |
| Any Imbalance Mitigated | Triggers when a bullish or bearish imbalance is mitigated | |
| Bullish Imbalance Mitigated | Triggers when a bullish imbalance is mitigated | |
| Bearish Imbalance Mitigated | Triggers when a bearish imbalance is mitigated | |
| Within Any Imbalance | Triggers when the price is located within a bullish or bearish imbalance | |
| Within Bullish Imbalance | Triggers when the price is located within a bullish imbalance | |
| Within Bearish Imbalance | Triggers when the price is located within a bearish imbalance | |
| Any Imbalance Entered | Triggers when the price enters a bullish or bearish imbalance | |
| Bullish Imbalance Entered | Triggers when the price enters a bullish imbalance | |
| Bearish Imbalance Entered | Triggers when the price enters a bearish imbalance | |
| Bullish Imbalance Exited | Triggers when the price exits a bullish imbalance | |
| Bearish Imbalance Exited | Triggers when the price exits a bearish imbalance | |
#### Liquidity Concepts [#liquidity-concepts]
| Alert | Description | Default |
| -------------------- | --------------------------------------------------------- | ---------------------------------------------------- |
| Up-Trendline Break | Triggers when the price breaks above an upward trendline | |
| Down-Trendline Break | Triggers when the price breaks below a downward trendline | |
| Detected Pattern | Triggers when a user-set chart pattern is identified | |
| Equal High | Triggers when a new equal high is detected | |
| Equal Low | Triggers when a new equal low is detected | |
| Bullish Grab | Triggers when a bullish liquidity grab occurs | |
| Bearish Grab | Triggers when a bearish liquidity grab occurs | |
# Fibonacci Retracements (/docs/algos/price-action-concepts/fibonacci)
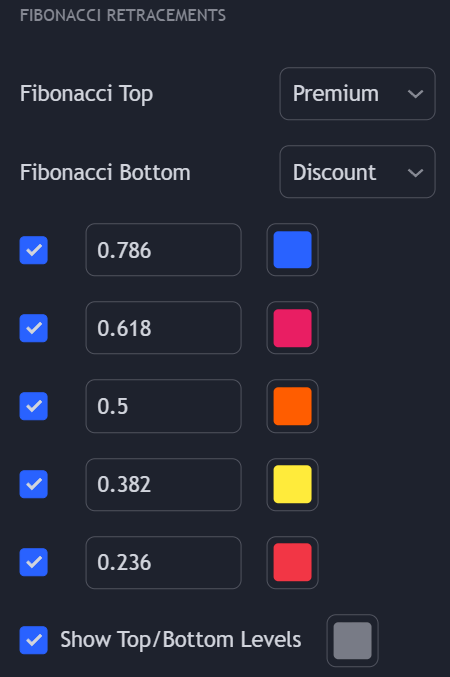
Fibonacci retracements are levels displayed from two price points using Fibonacci ratios, specific numbers obtained from the Fibonacci sequence.
Users can display up to 5 customizable Fibonacci retracements from one upper and one lower extremities users can select from a wide variety of feature included in the toolkit.
## Possible Extremities [#possible-extremities]
The upper/lower extremities used to construct the Fibonacci retracements can be selected from the "Fibonacci Top" or "Fibonacci Bottom" dropdown settings, and can be obtained from the following features within the Price Action Concepts® toolkit:
* Internal High
* Internal Low
* Swing High
* Swing Low
* Discount
* Equilibrium Average
* Premium
* Bullish I-CHoCH
* Bearish I-CHoCH
* Bullish I-BOS
* Bearish I-BOS
* Highest OB Top
* Lowest OB Bottom
* Imbalance Top
* Imbalance Bottom
* Imbalance Average
* Previous Day High
* Previous Day Low
* Previous Week High
* Previous Week Low
* Previous Month High
* Previous Month Low
* Previous Quarterly High
* Previous Quarterly Low
Selecting "None" for "Fibonacci Top" or "Fibonacci Bottom" will hide the retracements.
## Ratios [#ratios]
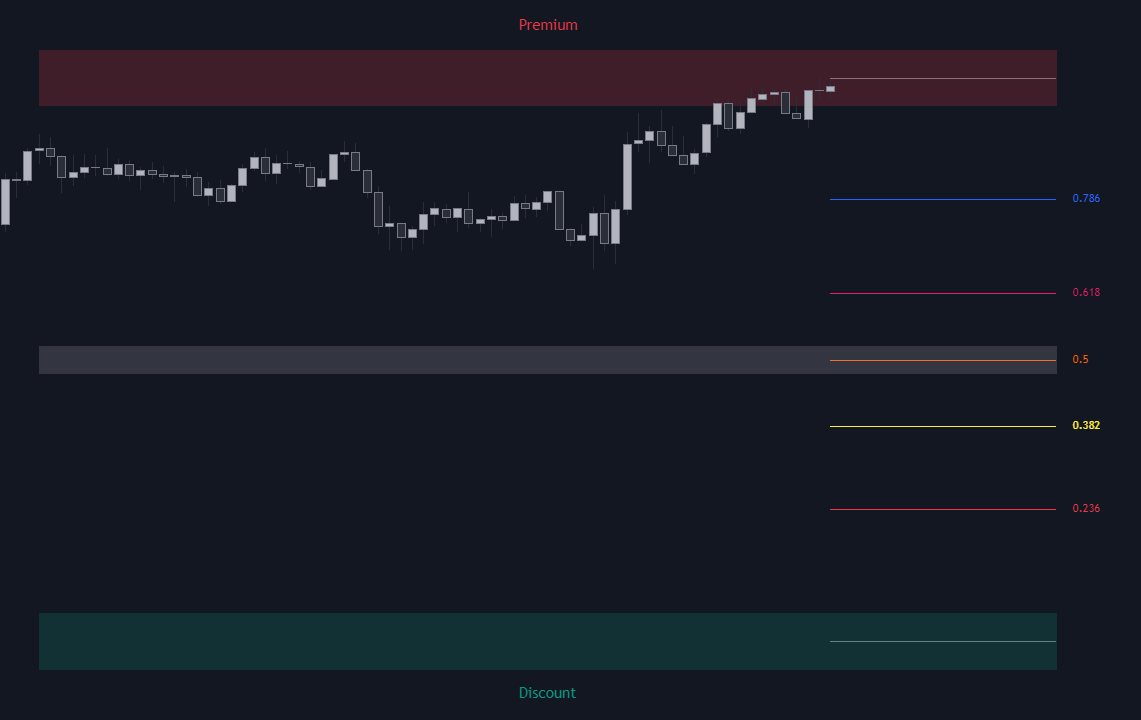
Users can control which levels are displayed as well as the ratio used for each level. Ratios are also visible to the right side of each retracement displayed.
## Anchor To Origin [#anchor-to-origin]
By default, the levels are anchored from the most recent bar and extend 20 bars ahead. By enabling "Anchor To Origin" users can anchor retracement levels to a point of origin related to the selected extremities in "Fibonacci Top" and "Fibonacci Bottom".
Based on the selected extremity, the anchor point will be the following:
| Extremity | Anchor |
| ---------------------------------------- | -------------------------------------------------------- |
| Swing High | Swing High Location |
| Swing Low | Swing Low Location |
| Internal High | Internal High Location |
| Internal Low | Internal Low Location |
| Premium / Equilibrium Average / Discount | Oldest anchor between Swing High and Swing Low Locations |
Only the above extremities are compatible with "Anchor To Origin".
If "Fibonacci Top" and "Fibonacci Bottom" are different, the anchor point will be the oldest location between the two.
# Imbalance Concepts (/docs/algos/price-action-concepts/imbalances)
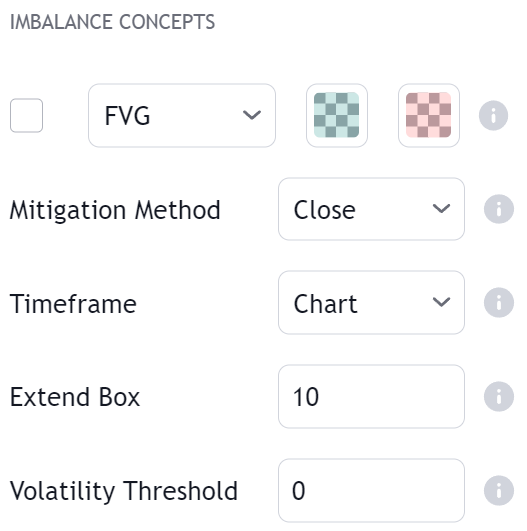
Imbalances in market prices arise when there is a great disparity between supply and demand, this can lead to inefficiencies where an asset does not trade at its fair value.
It is common for the price to seek balance after an imbalance, thus returning to the price area where the imbalance occurred. These areas of imbalances can also be used as support and resistance areas.
The toolkit is able to detect the following imbalances:
* Fair Value Gaps (FVG)
* Inverse Fair Value Gaps (Inverse FVG)
* Double Fair Value Gaps (Double FVG)
* Volume Imbalance
* Opening Gap
Each method is covered in the sections below.
## Fair Value Gaps [#fair-value-gaps]
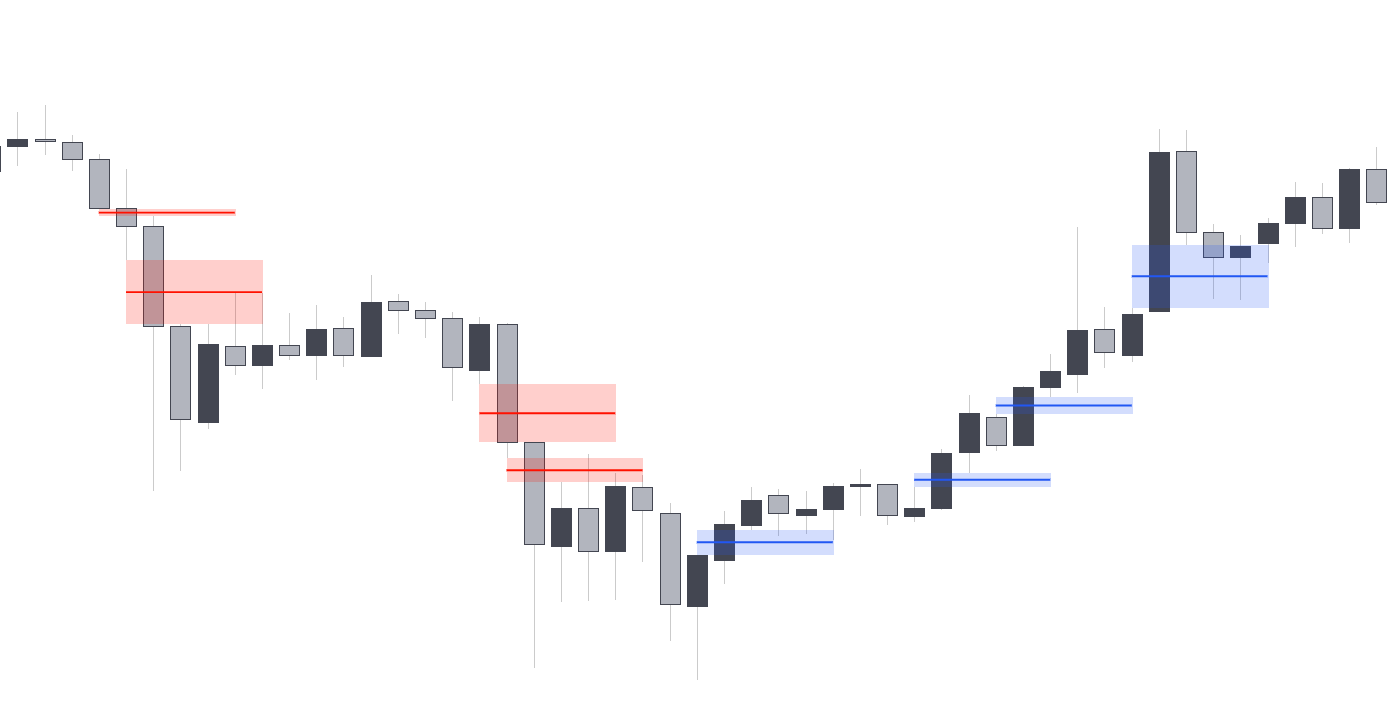
Fair Value Gaps (FVG) are market imbalances formed from a sequence of three candles where the outer candle wicks fail to overlap the central candle body, the range between the wicks highlight a Fair Value Gap.
Bullish fair value gaps occur when the current price low is higher than the price high two bars ago. Bearish fair gaps occur when the current price high is lower than the price low two bars ago.
## Inverse FVG [#inverse-fvg]
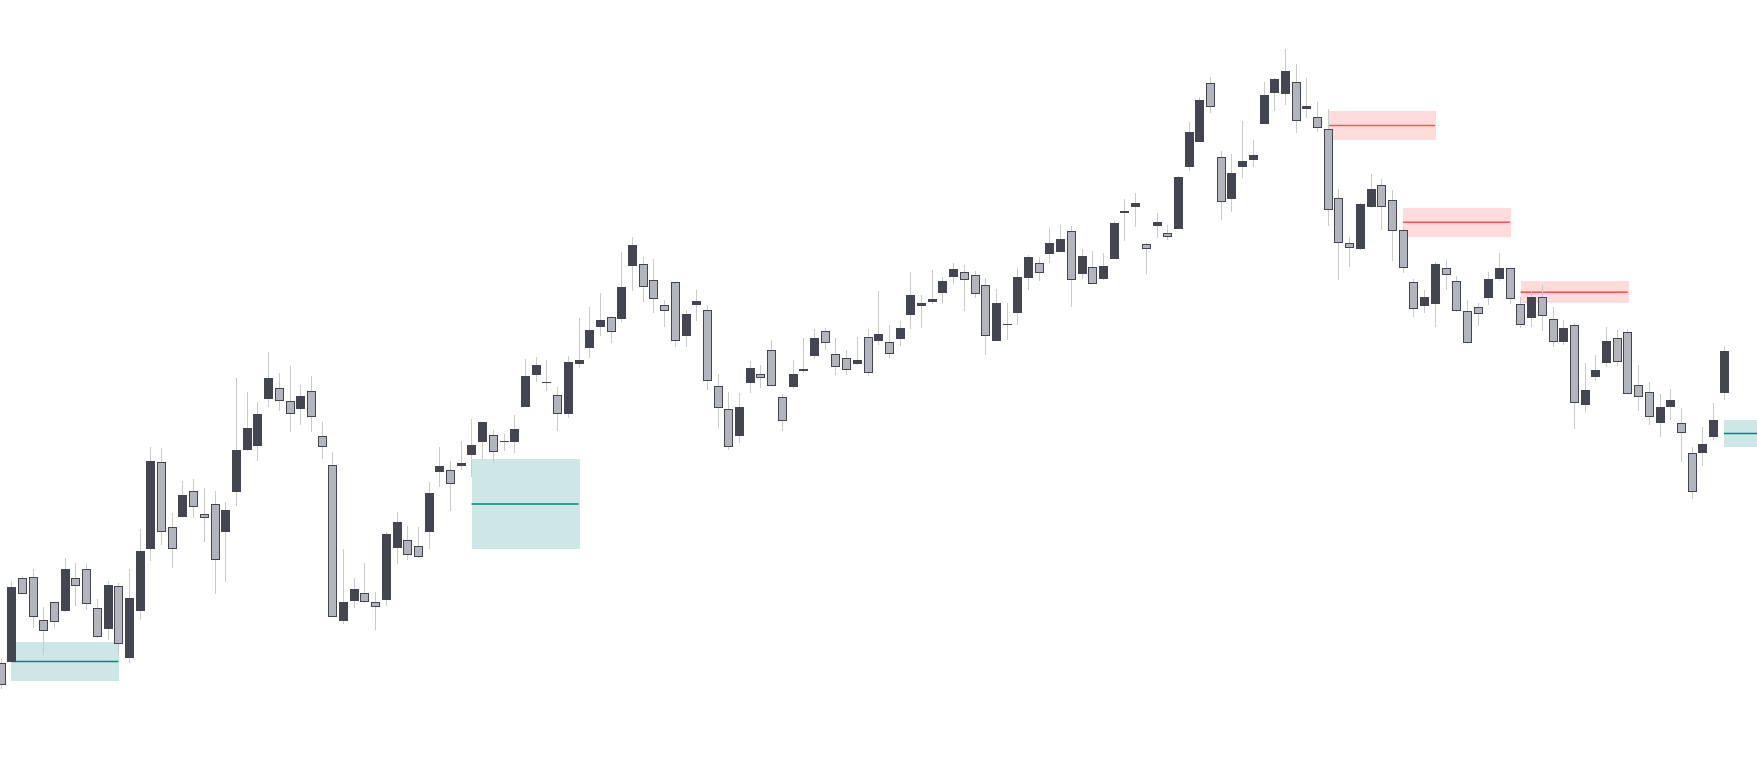
Inverse fair value gaps are essentially mitigated fair value gaps, these can be used to provide retests areas.
A mitigated bullish FVG will lead to a bearish inverse FVG, where we can expect price to retrace upward and retest the area, while a mitigated bearish FVG will lead to a bullish inverse FVG, where we can expect price to retrace downward and retest the area.
For the sake of efficiency, inverse FVG's are always based on the mitigation of the most recent detected FVG, disregarding any previous historical FVG that might get mitigated.
## Double FVG [#double-fvg]
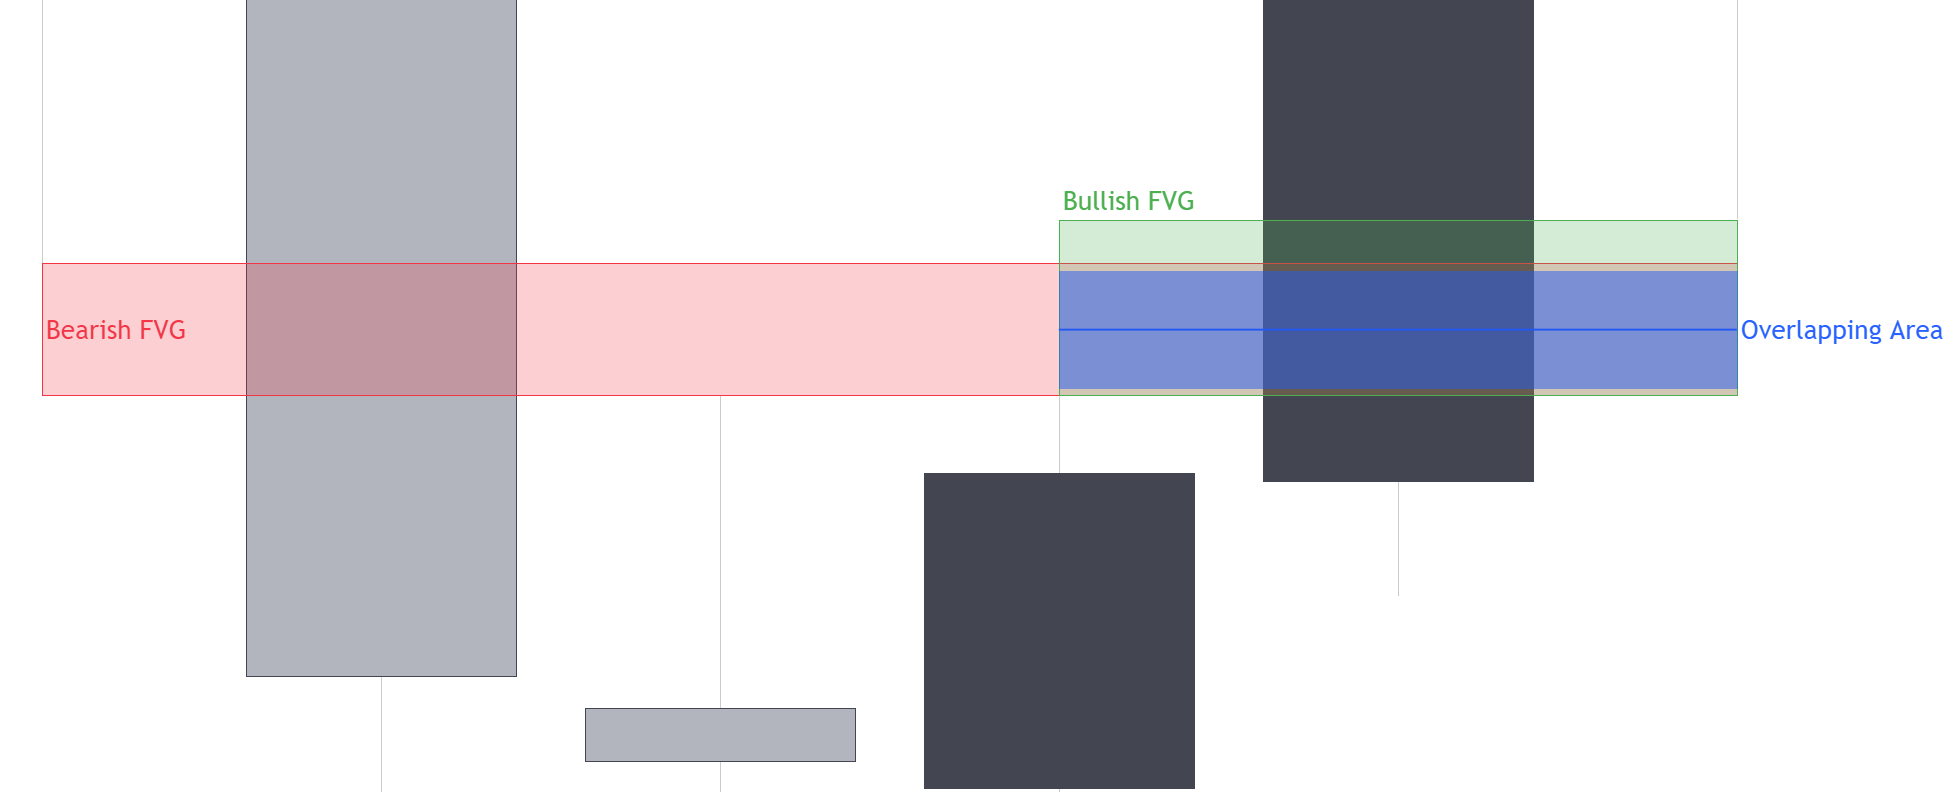
Double Fair Value Gaps, also called balanced price ranges occur when the areas of two Fair Value Gaps overlap. The overlapping areas highlight a new area of imbalance.
A bullish Balanced Price Range is determined by a new bullish Fair Value Gap area overlapping a previous bearish Fair Value Gap area, while a bearish Balanced Price Range is determined by a new bearish Fair Value Gap area overlapping a previous bullish Fair Value Gap area.
## Volume Imbalance [#volume-imbalance]
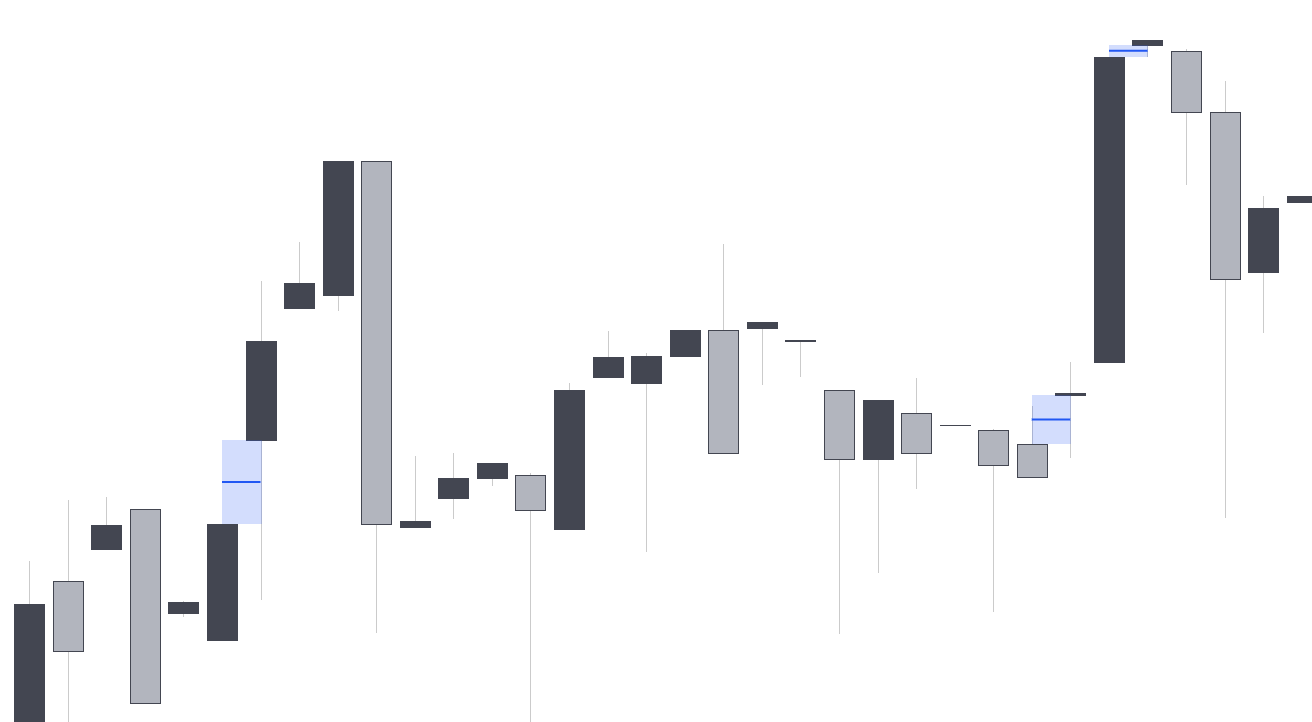
Volume Imbalances are market imbalances characterised by two adjacent candles with non overlapping candle bodies, while their wicks overlaps. These imbalances are more commonly found in stocks or second timeframes of cryptocurrencies and forex pairs.
## Opening Gap [#opening-gap]
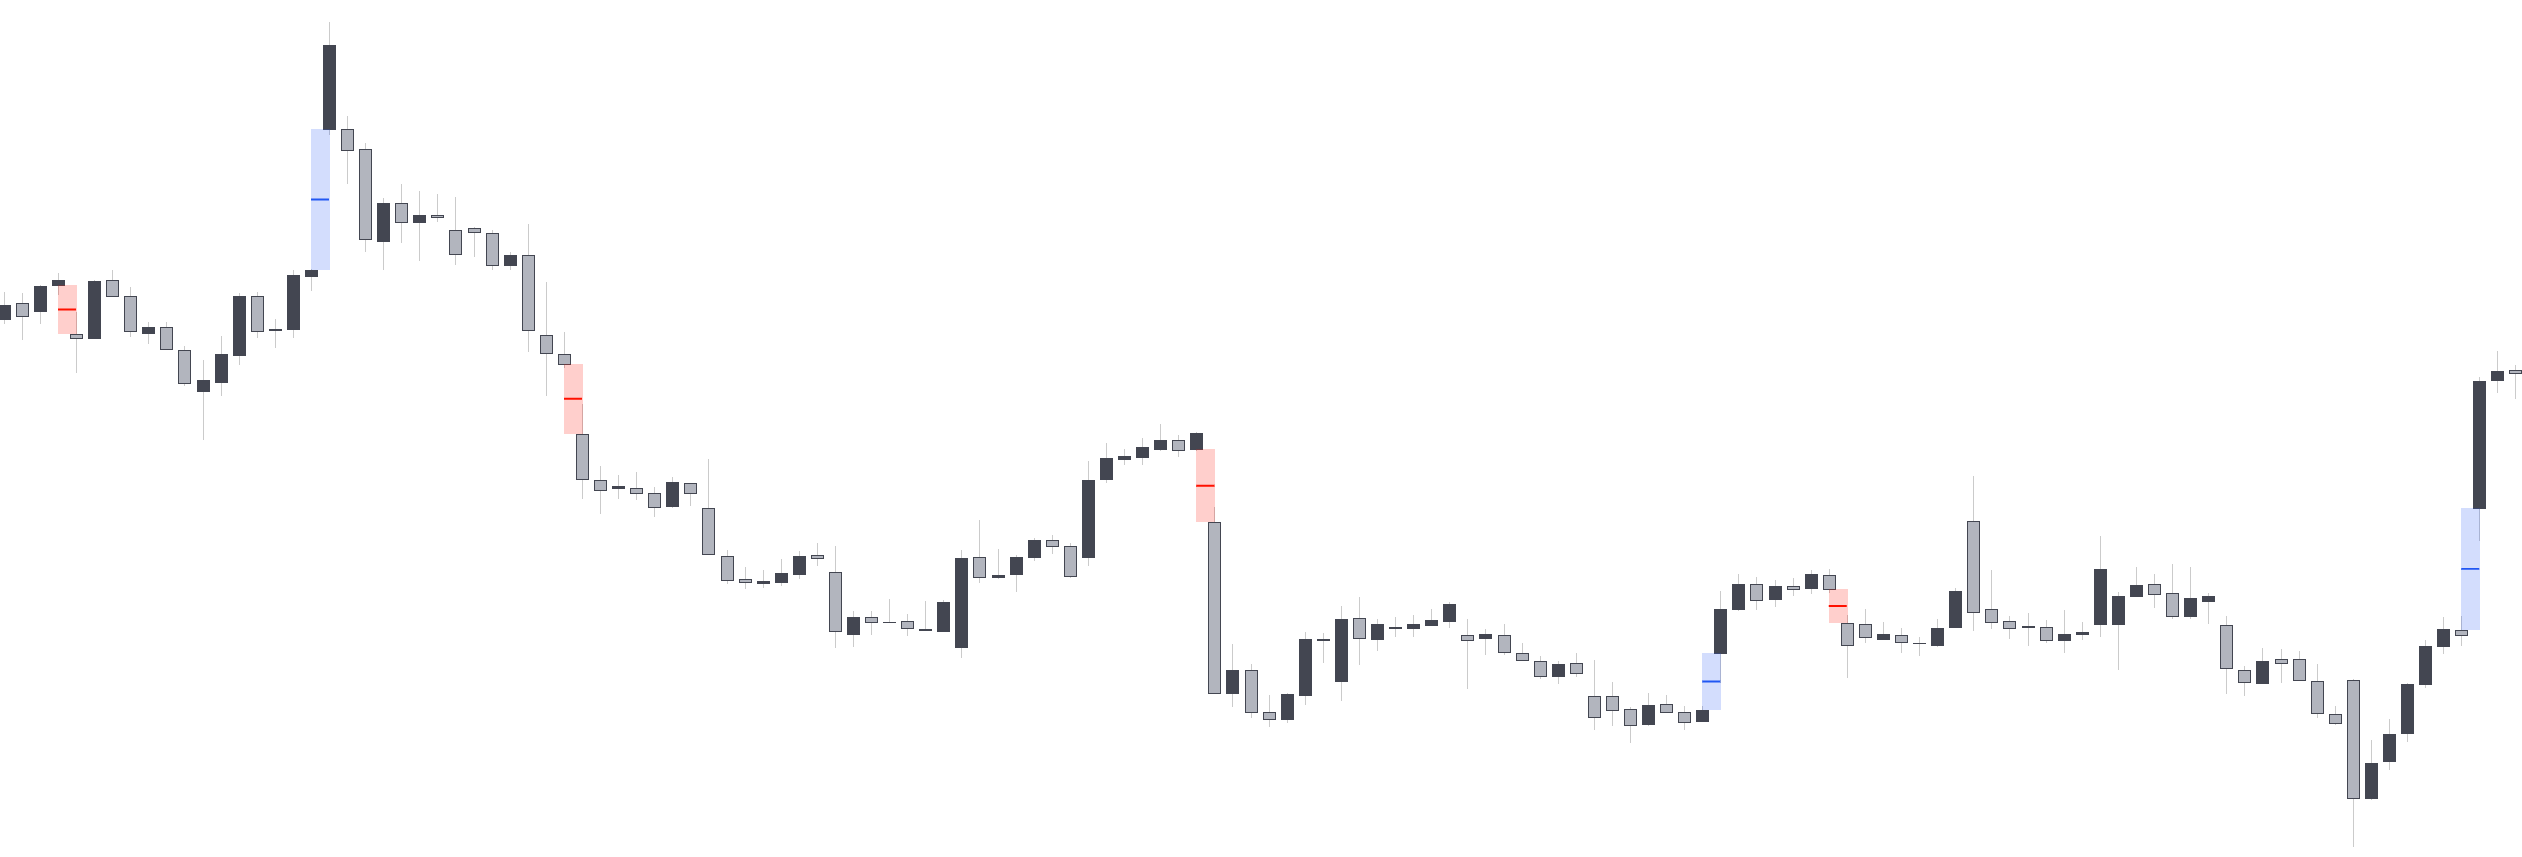
Opening Gaps are market imbalances characterised by two adjacent candles with non overlapping candle wicks, highlighting an empty area. These imbalances are more commonly found in stocks or second timeframes of cryptocurrencies and forex pairs.
## Mitigation Methods [#mitigation-methods]
Once price breaks a highlighted imbalance area it is said to have been "mitigated" and will automatically disappear. Within the Price Action Concepts® indicator, users can determine the condition for any imbalance to be considered mitigated trough the **Mitigation Method** setting, available options include:
| Method | Description |
| :---------: | :-----------------------------------------------------------------------------------------------------------------------------------------------------------------------------------------------------: |
| **Close** | Mitigates an imbalance once price close cross above the imbalance upper extremity in the case of a bearish imbalance, and under its lower extremity in case of a bullish imbalance. |
| **Wick** | Mitigates an imbalance once price high cross above the imbalance upper extremity in the case of a bearish imbalance, and when price low cross under its lower extremity in case of a bullish imbalance. |
| **Average** | Mitigates an imbalance once price cross the imbalance area average level. |
| **None** | Will not remove mitigated imbalances. |
This toolkit makes use of a buffer allowing for a maximum of 200 imbalances. Any newly detected imbalance making the buffer exceed this number will cause the toolkit to discard the oldest detected imbalance.
## Volatility Threshold [#volatility-threshold]
The volatility threshold allows filtering out less significant imbalances, with higher values preserving imbalances with a larger range.
The volatility threshold is determined from a volatility estimator, the threshold act as a multiplier.
Increments of 1 will return visible results. Floating points can be used.
## Alerts [#alerts]
Users can be alerted on the detection of a bullish or bearish imbalance, as well as when an imbalance area is mitigated.
# Introduction (/docs/algos/price-action-concepts/introduction)
Price Action Concepts® is an exclusive exclusive toolkit of trading algorithms that automate a wide variety of concepts such as support & resistance, trend lines, patterns, and much more.
This toolkit is great for beginners or professionals alike who wish to automate price action, the essential part of your charts. Each feature included can be seen in the pages below.
## Features [#features]
## Alerts [#alerts]
Most concepts covered in the toolkit include built-in alerts. Users can also be alerted for multiple conditions from on alert using **any alert() function call** conditions. Finally, users who wish to set complex alerts conditions can do so using our "Custom Alert Creator".
## Settings Reference [#settings-reference]
Price Action Concepts® includes various settings affecting the appearance and behavior of the toolkit, most of which are specific to the feature they affect.
Users can access the list of user settings and their descriptions in the following page:
# Liquidity Concepts (/docs/algos/price-action-concepts/liquidity)
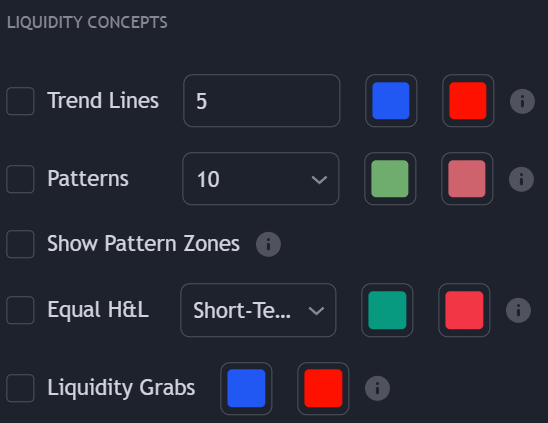
Price Action Concepts® covers a variety of concepts related to liquidity. Each of these concepts can be found in the **Liquidity Concepts** settings section and are described in the sections below.
## Liquidity Trendlines [#liquidity-trendlines]
Liquidity Trendlines displays linear zones constructed by taking into account the amount of liquidity at certain price levels, with zones being displayed only if market participants found liquidity in them. The returned zones can give support areas (in blue) during up-trends or resistance areas (in red) during down-trends.
Once price breaks the extremity of a zone we can expect a trend reversal.
Once the conditions for a trendline to be displayed are met, the indicator will display it retrospectively.
The user can determine the amount of historical up-trendlines and down-trendlines to display on the chart to avoid clutter using the provided numerical input setting.
Builtins alerts for trendlines breakouts are available to the users.
## Patterns [#patterns]
Price Action Concepts® includes an Automatic Pattern Detection feature able to detect various chart patterns as well as a dashboard to give users information about any detected pattern.
The Pattern Detection feature is able to detect the following patterns:
* Ascending/Descending Triangles
* Ascending/Descending Broadening Wedges
* Ascending/Descending/Symmetrical Triangles
* Double Tops/Bottoms
* Head & Shoulders
* Inverted Head & Shoulders
as well as providing general supports and resistances if any of the above patterns are not detected.
When a pattern is detected, it will be displayed on the dashboard located at the top-right of the chart. Solid lines will highlight the patterns. When no patterns are detected, dashed lines will be displayed that can be used as support and resistance.
Users can detect longer term chart patterns using the provided numerical drop-down menu setting, with higher values detecting longer term patterns.
Builtins alerts for detected patterns are available to the users.
## Equal Highs & Lows [#equal-highs--lows]
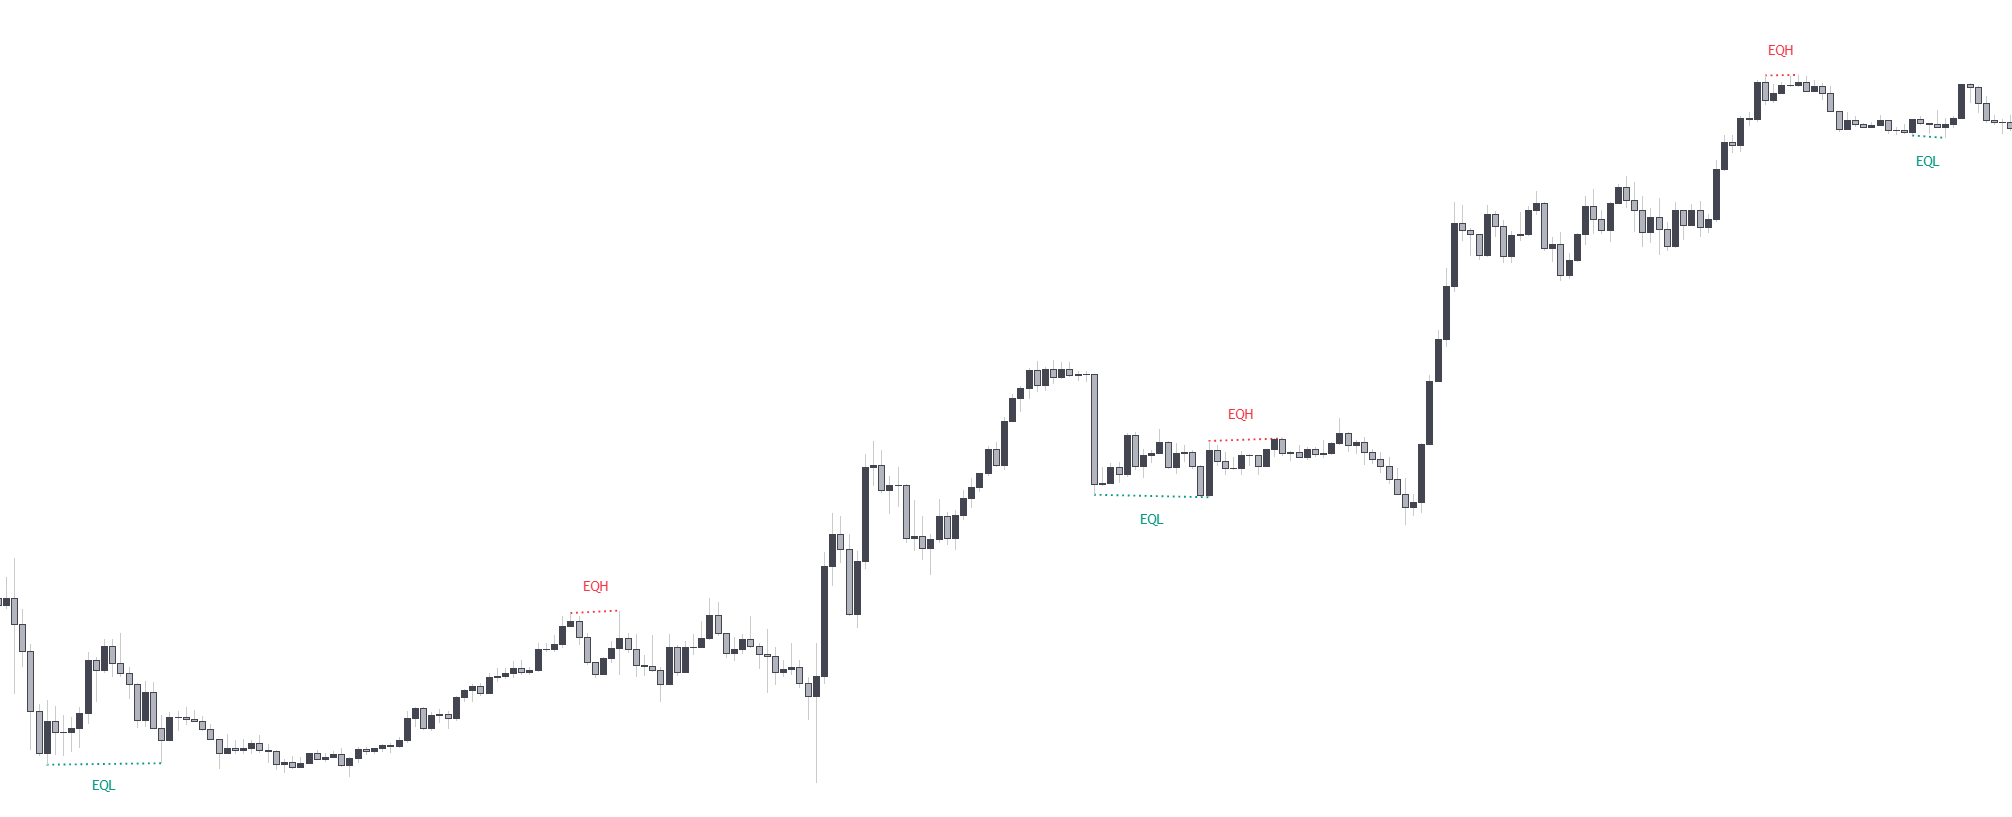
The toolkit returns historical equal high's & low's constructed from swing points. Equal high's & low's can be indicative of reversals, and incoming market structure such as CHoCH or BOS.
Users can display longer term equal high's/low's by increasing the numerical input at the right of the toggle (3 by default).
Equal high's & low's requires the detected swing points to be confirmed, which takes an amount of bars equal to the value set in the numerical input. As such it is important to understand these are displayed retrospectively.
## Liquidity Grabs [#liquidity-grabs]
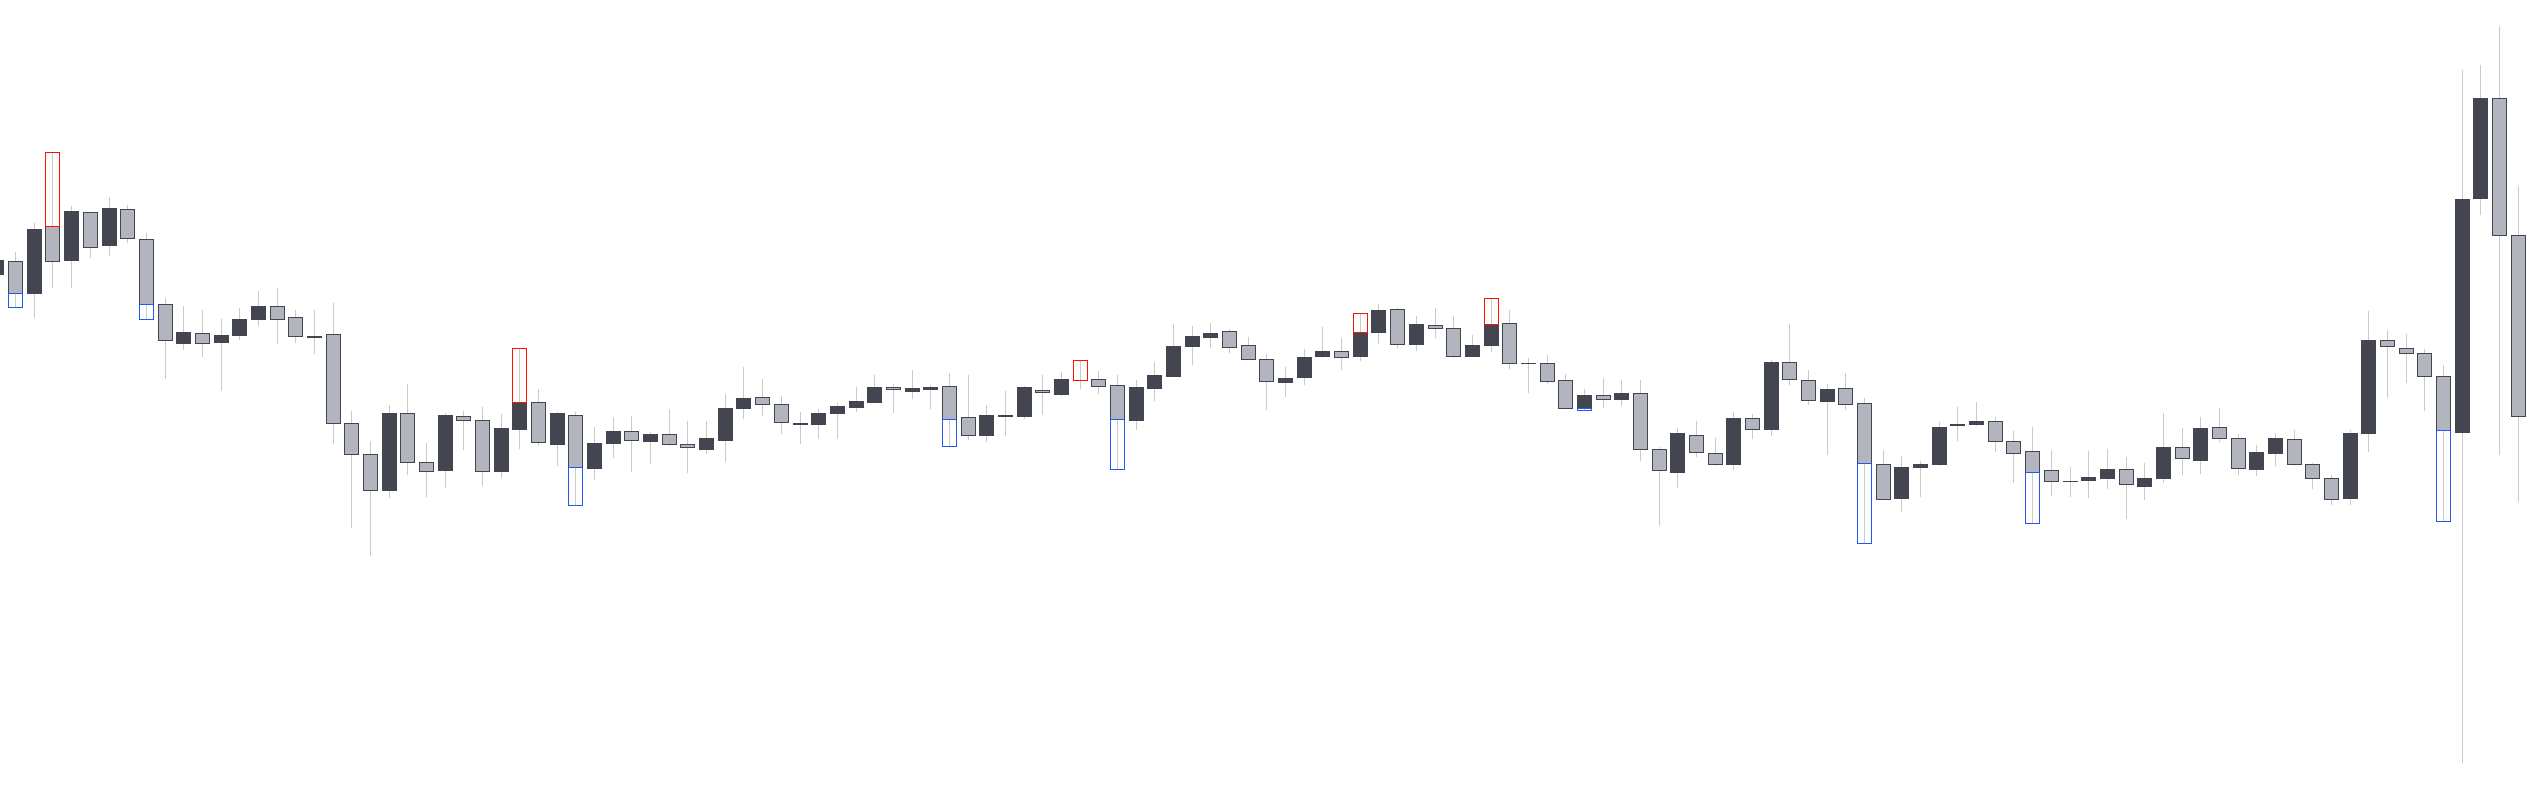
Liquidity Grabs highlight occurrences where trading activity took place in more liquid areas. These are highlighted by the toolkit with colored borders. A liquidity grab can be identified as a bullish grab if the activity took place in a demand area, or a bearish grab if this activity took place in a supply area.
Bullish liquidity grabs are highlighted in blue with borders ranging from the price low to candle body minimum and indicates a potential bullish reversal.
Bearish liquidity grabs are highlighted in red with borders ranging from the price high to candle body maximum and indicates a potential bearish reversal.
The occurrence of both bullish and bearish liquidity grabs at the same time can highlight market indecision's.
Built-in alerts for liquidity grabs are available to users within Price Action Concepts®.
# Market Structure (/docs/algos/price-action-concepts/market-structures)
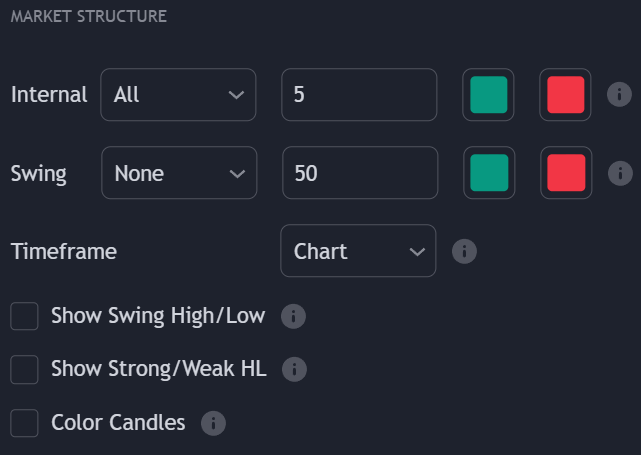
Market structure is a core component of the price action. The Price Action Concepts® toolkit automatically detects and highlights real time market structure on your chart, allowing for a clean picture of market trends without introducing traditional forms of technical analysis like moving averages.
## Type Of Market Structures [#type-of-market-structures]
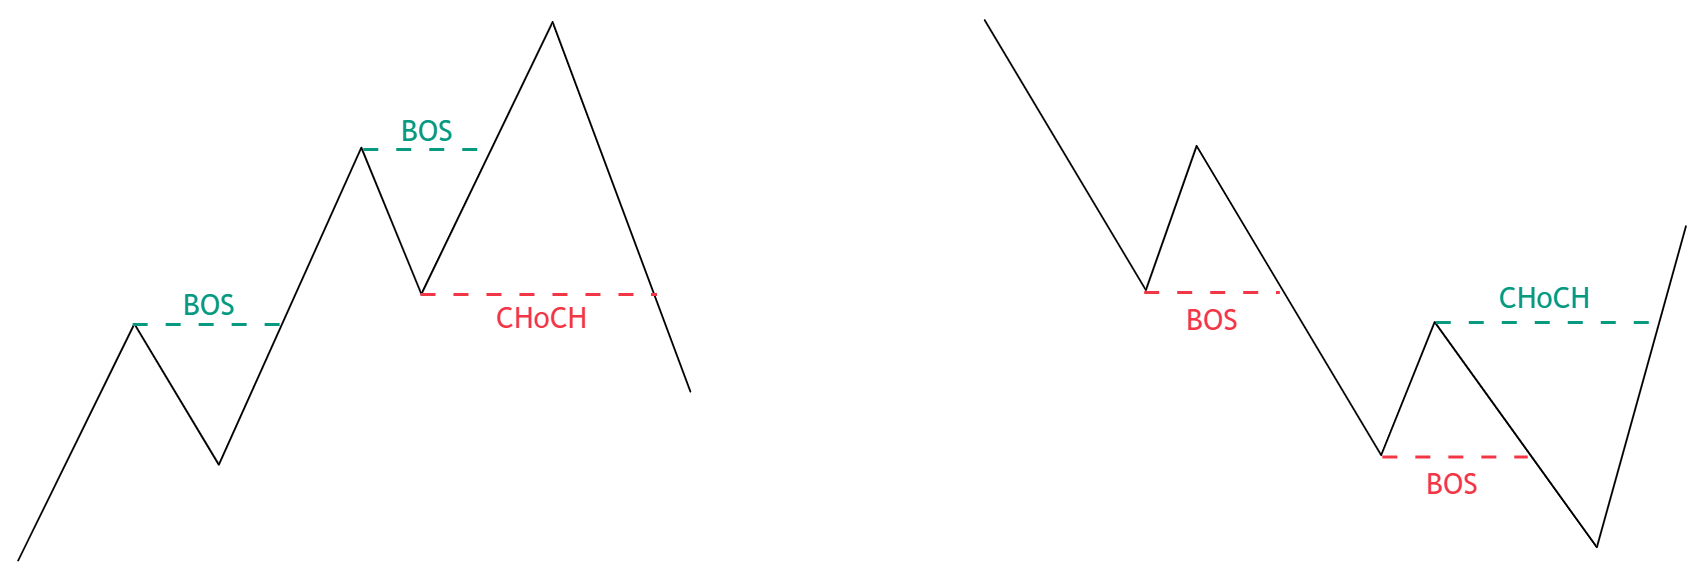
Market structure allows traders to understand trend reversals as well as trend continuations in the market through two distinct identifications:
* Change of Character (CHoCH)
* Break of Structure (BOS)
These are further described in the subsections below.
### Change Of Character (CHoCH) [#change-of-character-choch]
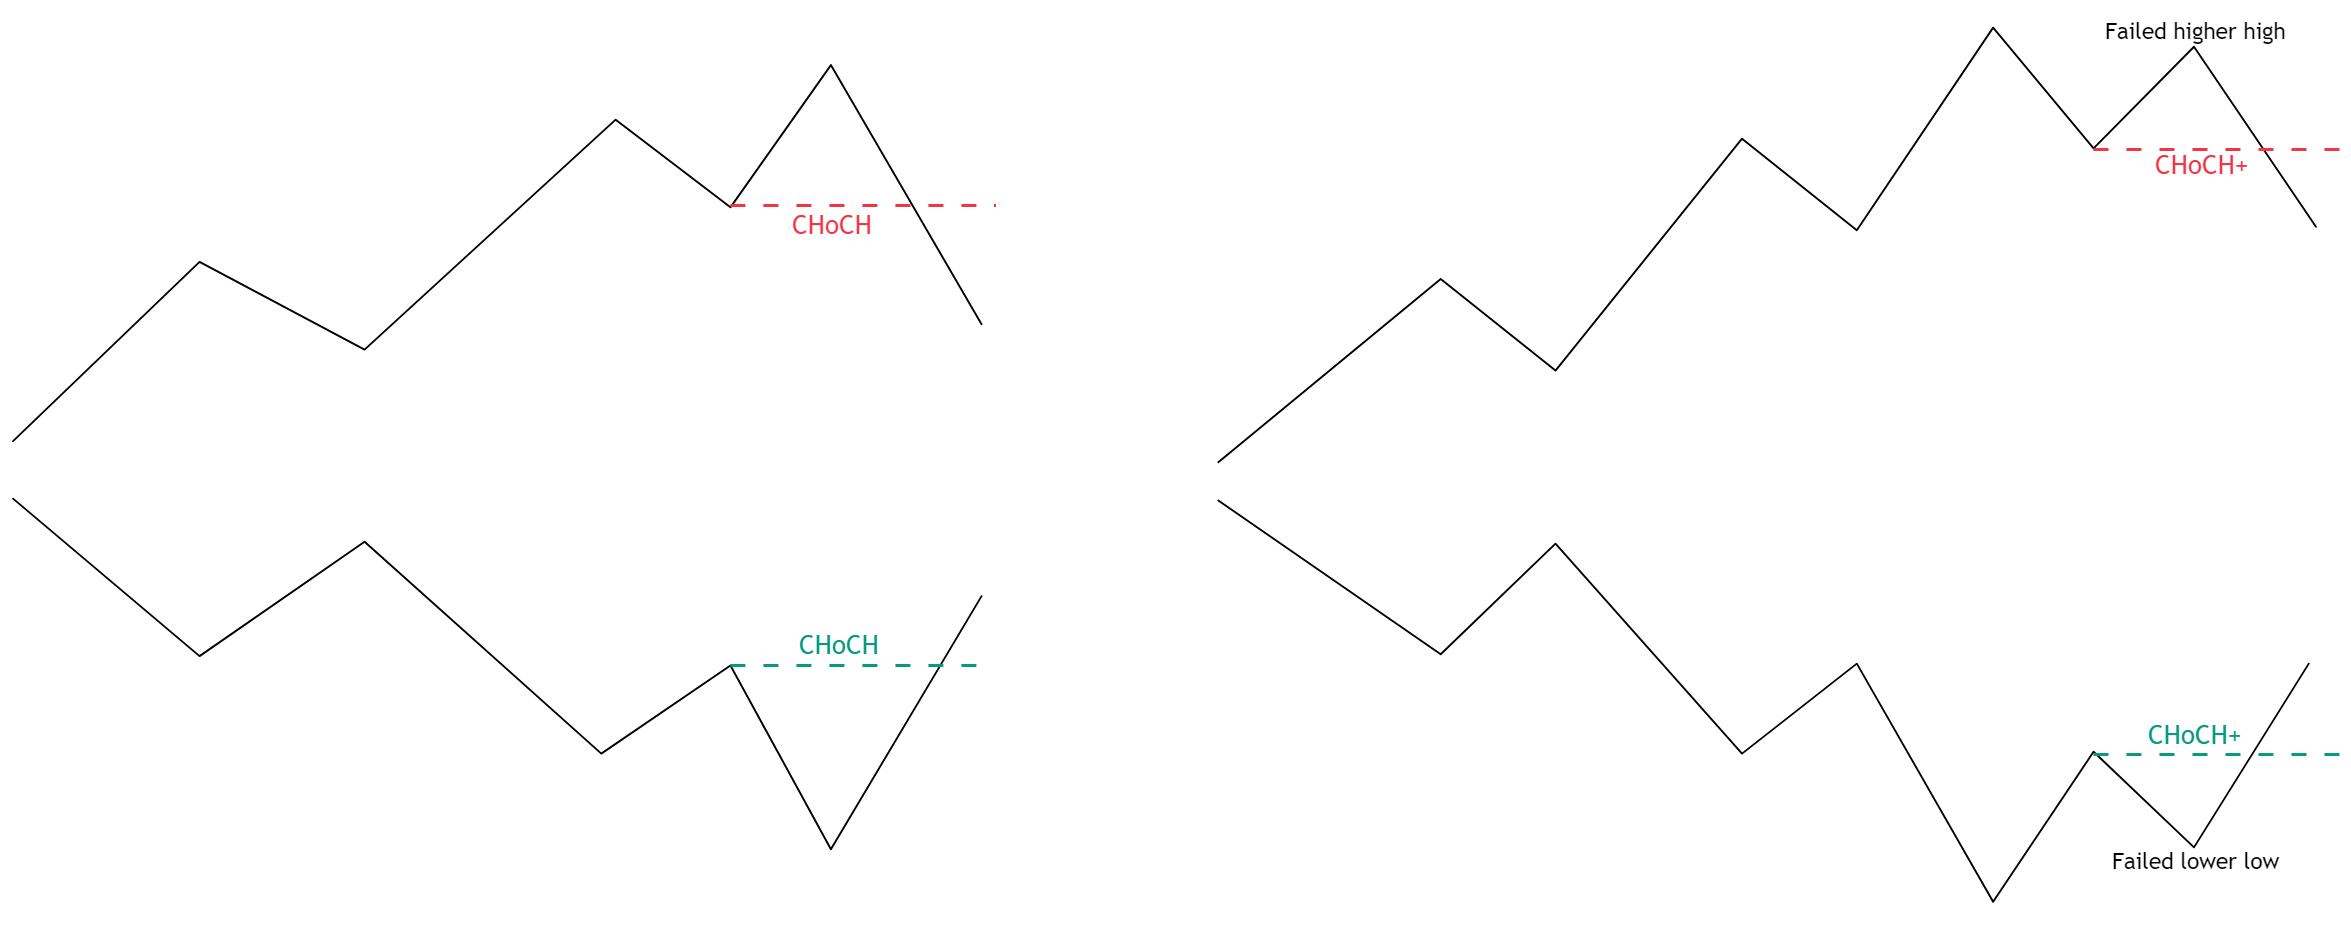
A change of character (CHoCH), sometimes also referred as 'market structure shift' is characterized by price breaking a prior swing low during an uptrend (bullish CHoCH) or a prior swing high during a downtrend (bearish CHoCH), and thus indicates a potential market reversal.
The Price Action Concepts® toolkits labels two distinct type of CHoCHs:
* Leading CHoCH (labelled as **CHoCH**)
* Supported CHoCH (labelled as **CHoCH+**)
The difference between each is based on the relative position of prior swing highs/lows. A leading CHoCH is characterized by price not having prior signs of a reversal, such as a failed higher high (lower high) during an uptrend or a failed lower low (higher low) during a downtrend.
On the other hand, a supported CHoCH (**CHoCH+**) is preceded by an early sign of market reversal, such as a failed higher high (lower high) during an uptrend or a failed lower low (higher low) during a downtrend.
Users can show allow the toolkit to show all or only specific types of CHoCH's from the drop-down menus within the **Market Structure** settings section in the toolkit.
### Break Of Structure (BOS) [#break-of-structure-bos]
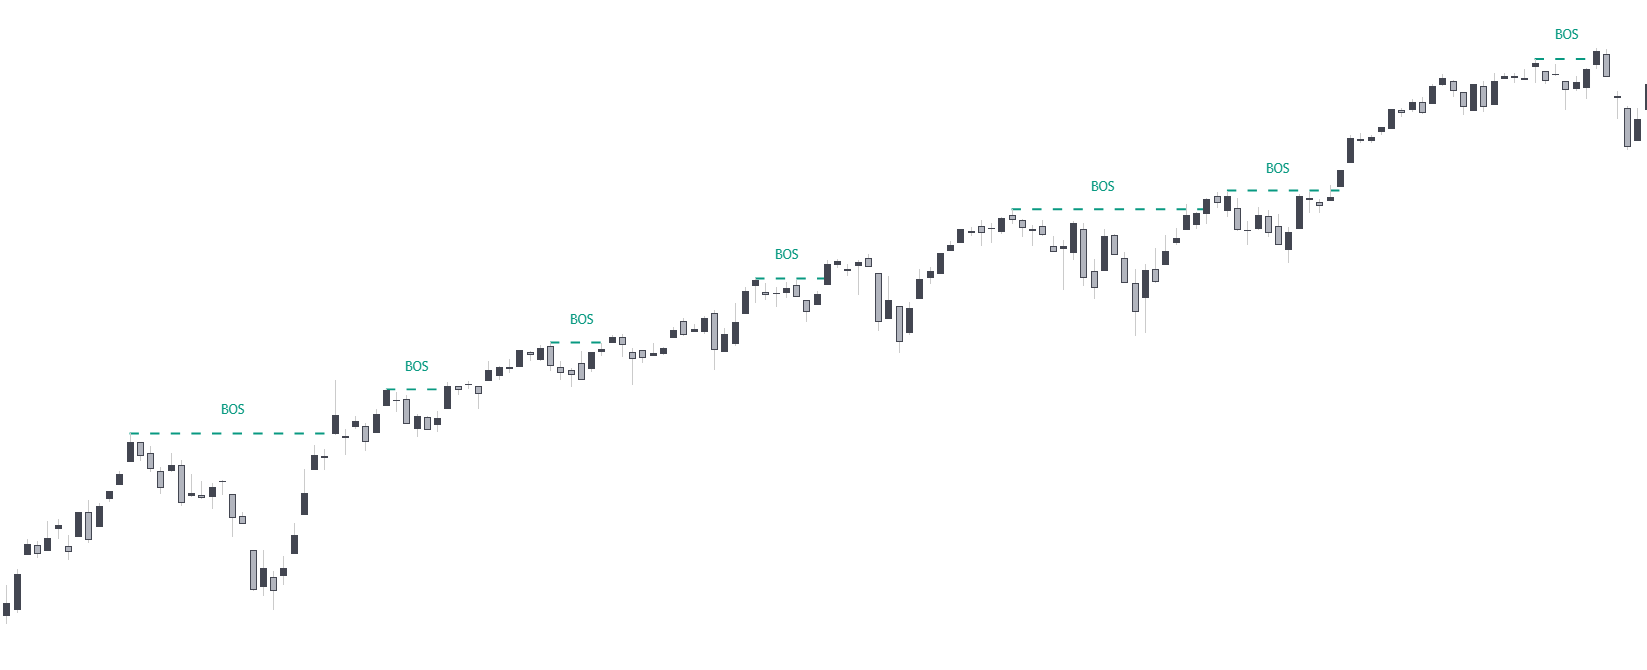
A break of structure (BOS) can be thought of primarily as a trend continuation label. This structure is the opposite of the CHoCH, with a BOS being when price breaks a prior swing high during an uptrend (bullish BOS) thus forming a new higher high, or when price breaks a prior swing low during a downtrend (bearish BOS) thus forming a new lower low. This structure only can occur after a CHoCH.
Since BOS's indicate trend continuations, it is common to observe successive BOS's.
## Swing & Internal Structure [#swing--internal-structure]
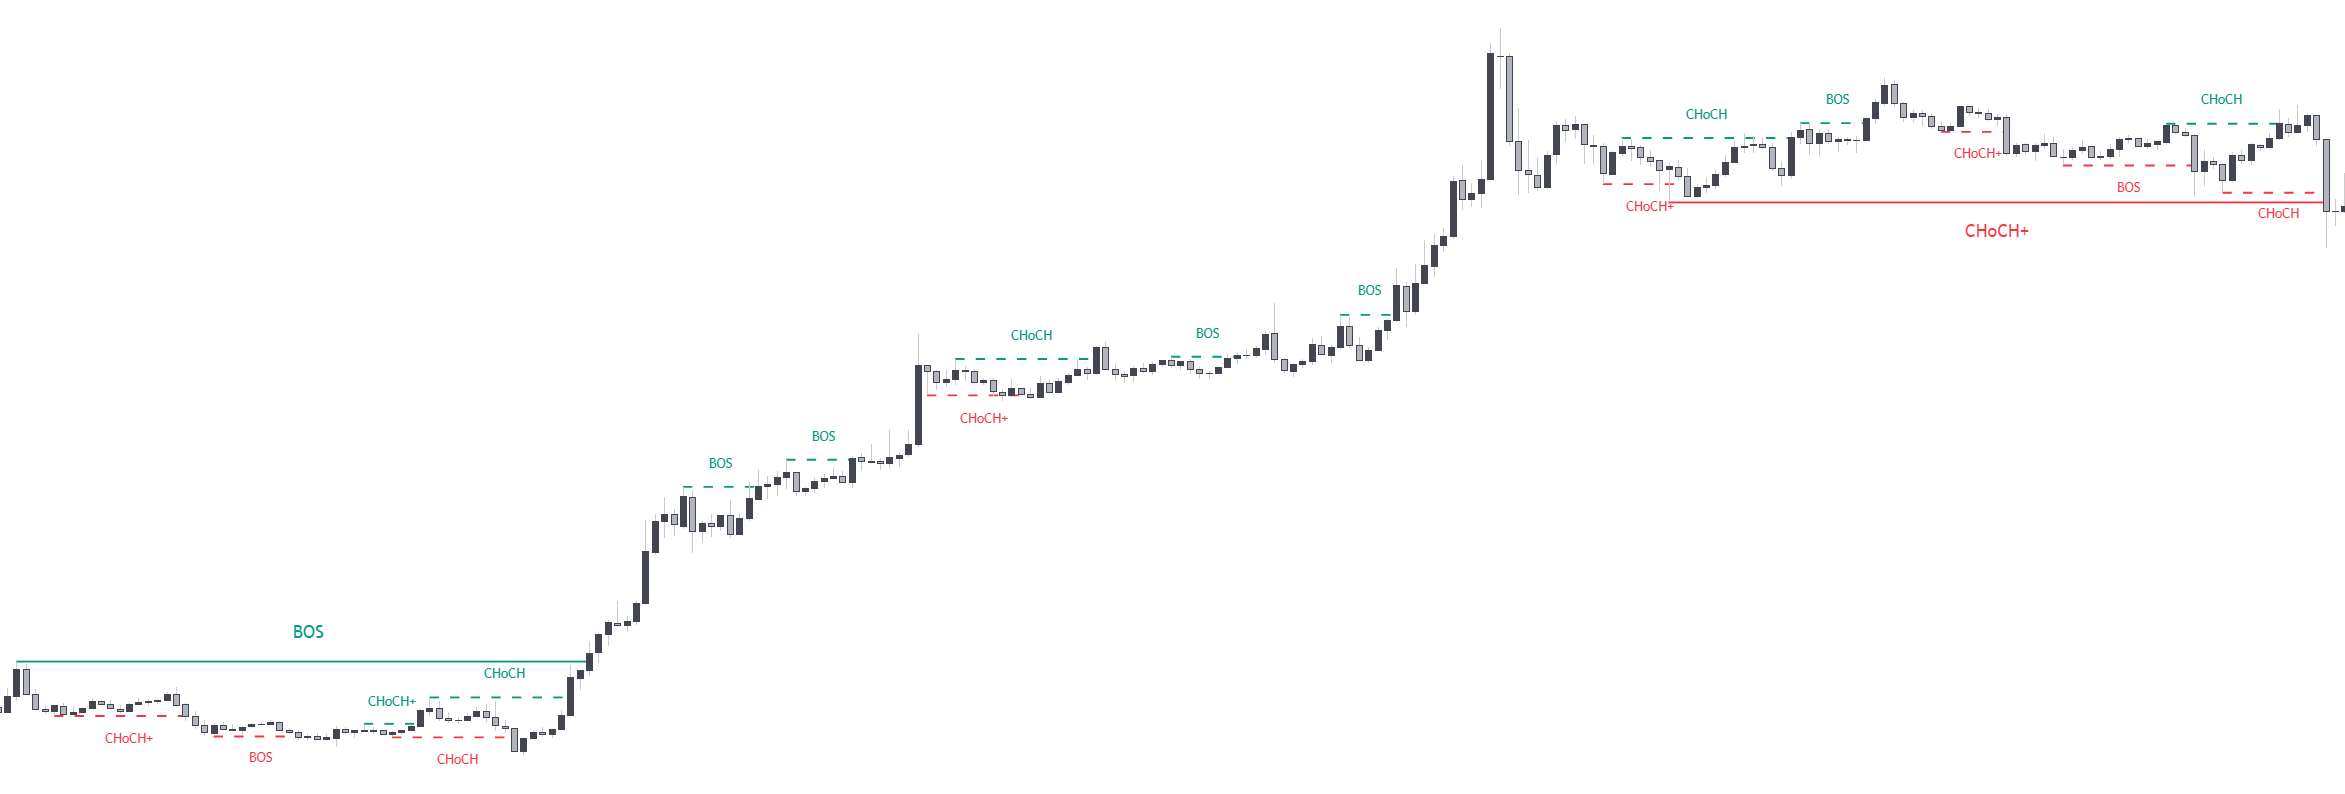
The Price Action Concepts® toolkit offers two distinct dimensions when it comes to market structure:
* Internal Structure
* Swing Structure
Internal structure are constructed from shorter term swing high/low points, while swing structure are constructed from longer term ones. Users can select the lookback used for the swing point detection for both the internal and swing market structures construction.
Internal structures can use a lookback in range (5, 49). Swing structures can use a lookback in the range (50, 100).
The toolkit highlights internal structure with dashed lines and labels with a smaller text size.
The size of the labels for internal and swing structure can be changed from the **General Styling** settings section.
## Candle Coloring [#candle-coloring]
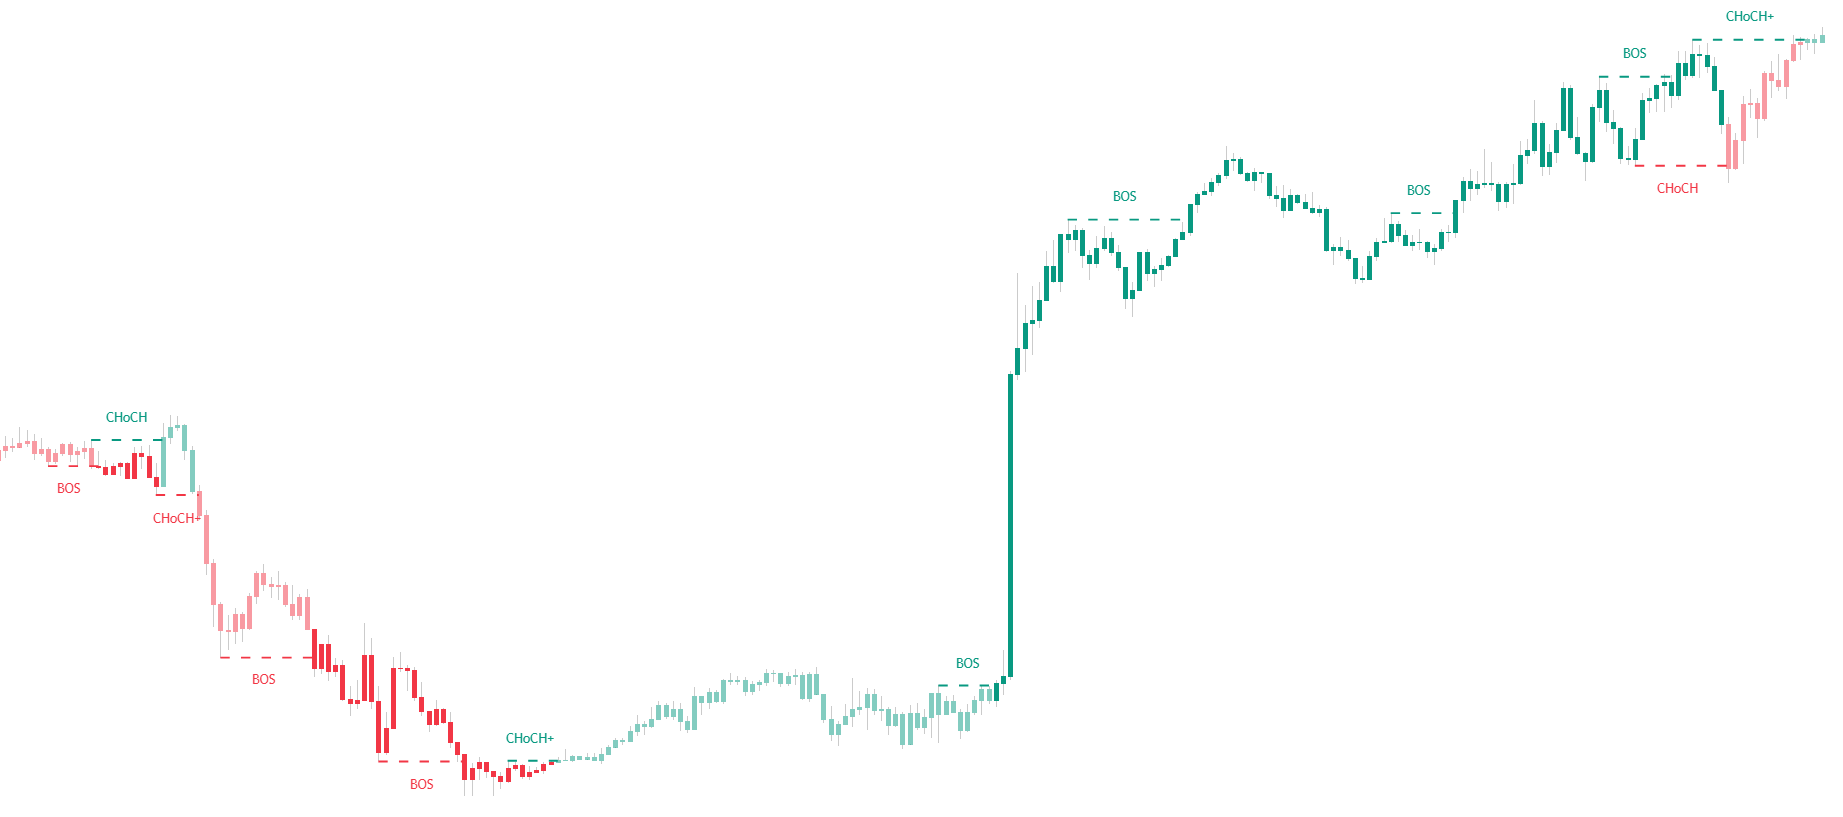
Users can color candles depending on the detected internal market structure. This is useful if users want to be able to determine a detected internal market structure without having labels and lines on their chart, freeing up space on the chart to use other indicators.
Candle coloring is affected by the colors settings selected by the user for the internal market structure. Candle coloring is determined as follows:
* Darker bullish color : Bullish CHoCH active
* Regular bullish color : Bullish BOS active
* Darker bearish color : Bearish CHoCH active
* Regular bearish color : Bearish BOS active
Users can make highlighted structure and candle colors monochrome from the **General Styling** settings by using the *monochrome* option in the **Theme** drop down menu.
## Swing High/Low [#swing-highlow]
Users can display swing high/low by enabling the "Show Swing High/Low" setting, highlighting past points where a reversal occurred. Displayed swing points can be denoted as:
* HH (Higher high)
* HL (Higher low)
* LH (Lower high)
* LL (Lower low)
The displayed swing points are affected by the period selected for the internal market structures, with higher values returning longer term swing points.
Swing points are displayed retrospectively, and as such are not detected where they are located. They should not be used for real-time applications.
## Strong/Weak High/Low [#strongweak-highlow]
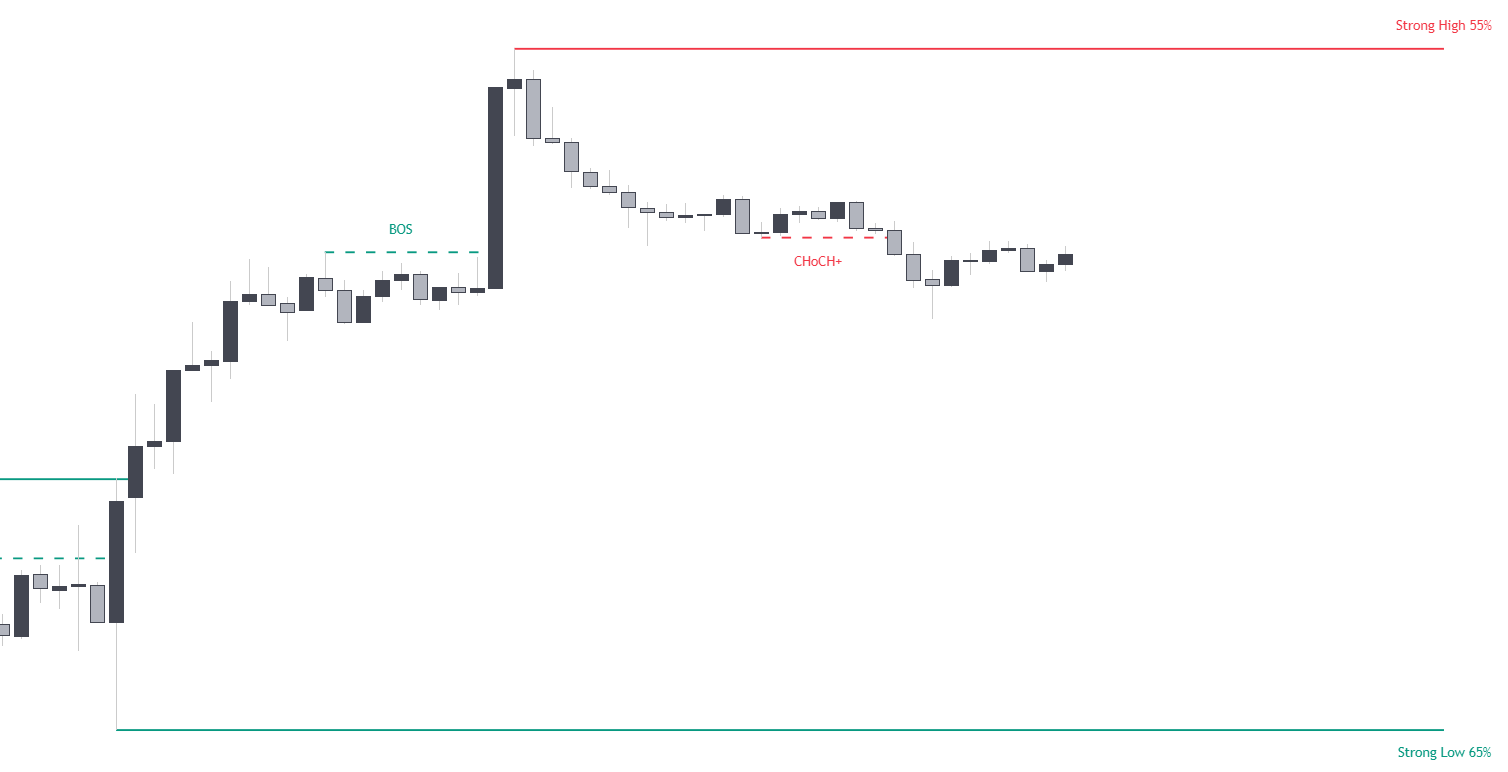
Strong/Weak High/Lows highlight maximum and minimum levels made from medium term swings. A relative percentage derived between the trading volume that occurred on both swings is also highlighted, and is used to determine if a maxima/minima is strong or weak.
The displayed swing points are affected by the period selected for the internal market structures, with higher values returning longer term swing points.
## Alerts [#alerts]
Built-in alerts are available for each supported market structure, including swing structures, internal structures, and equal highs/lows.
# Volumetric Order Blocks (/docs/algos/price-action-concepts/order-blocks)
Volumetric Order Blocks highlight price areas where more informed market participants accumulate orders and can be used as potential areas of support or resistance. These are automatically highlighted by the toolkit and will disappear once mitigated.
These order Blocks are separated into two types, bullish Volumetric Order Blocks and bearish Volumetric Order Blocks. Bullish Volumetric Order Blocks initial locations are near swing low's and are used as a potential support. On the other hand Bearish Volumetric Order Blocks initial locations are near swing high's and are used as a potential resistance.
Users can show longer term Volumetric Order Blocks by increasing the **Length** setting in the Order Blocks section. This setting control the swing point detection lookback used to construct Volumetric Order Blocks.
You can hide overlapping Volumetric Order Blocks by using the **Hide Overlap** setting, if two Volumetric Order Blocks overlap the most recent one will be conserved.
## Breaker Blocks [#breaker-blocks]
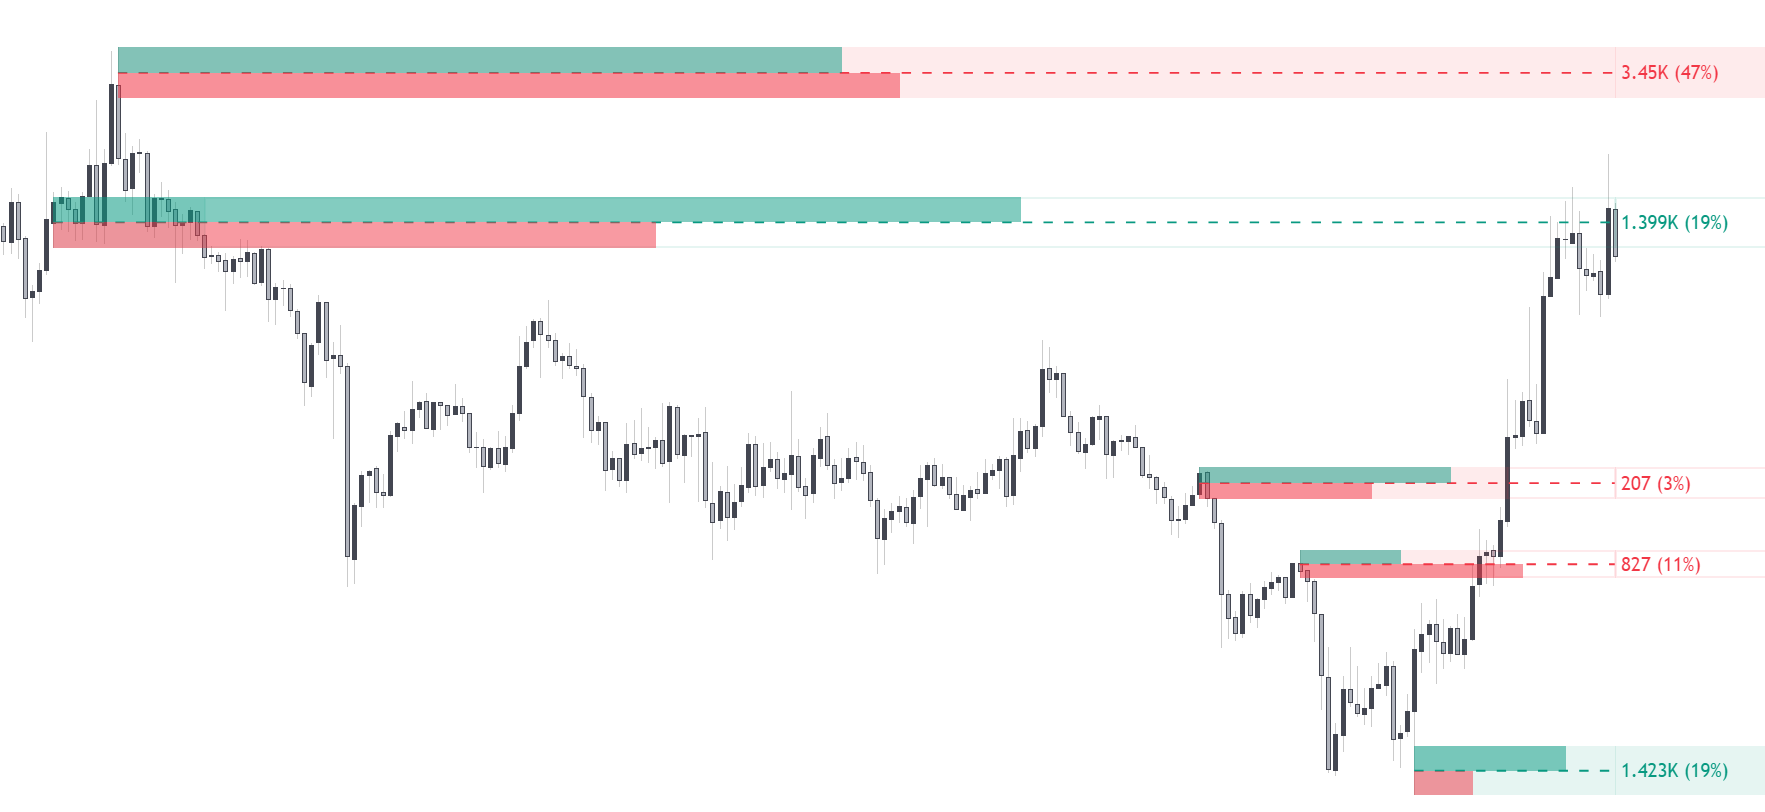
Breaker Blocks show previous Volumetric Order Blocks that got mitigated (broken by price). These zones can be revisited by the price and provide support/resistance areas.
Bullish breaker blocks disappear once price goes above the breaker block upper extremity, while bearish breaker blocks disappear once price goes under the breaker block lower extremity.
Users can enable the option of showing breaker blocks by enabling the "Show Breakers" setting.
Breaker blocks are differentiated from Volumetric Order Blocks by their non-solid background color.
## Internal Activity & Metrics [#internal-activity--metrics]
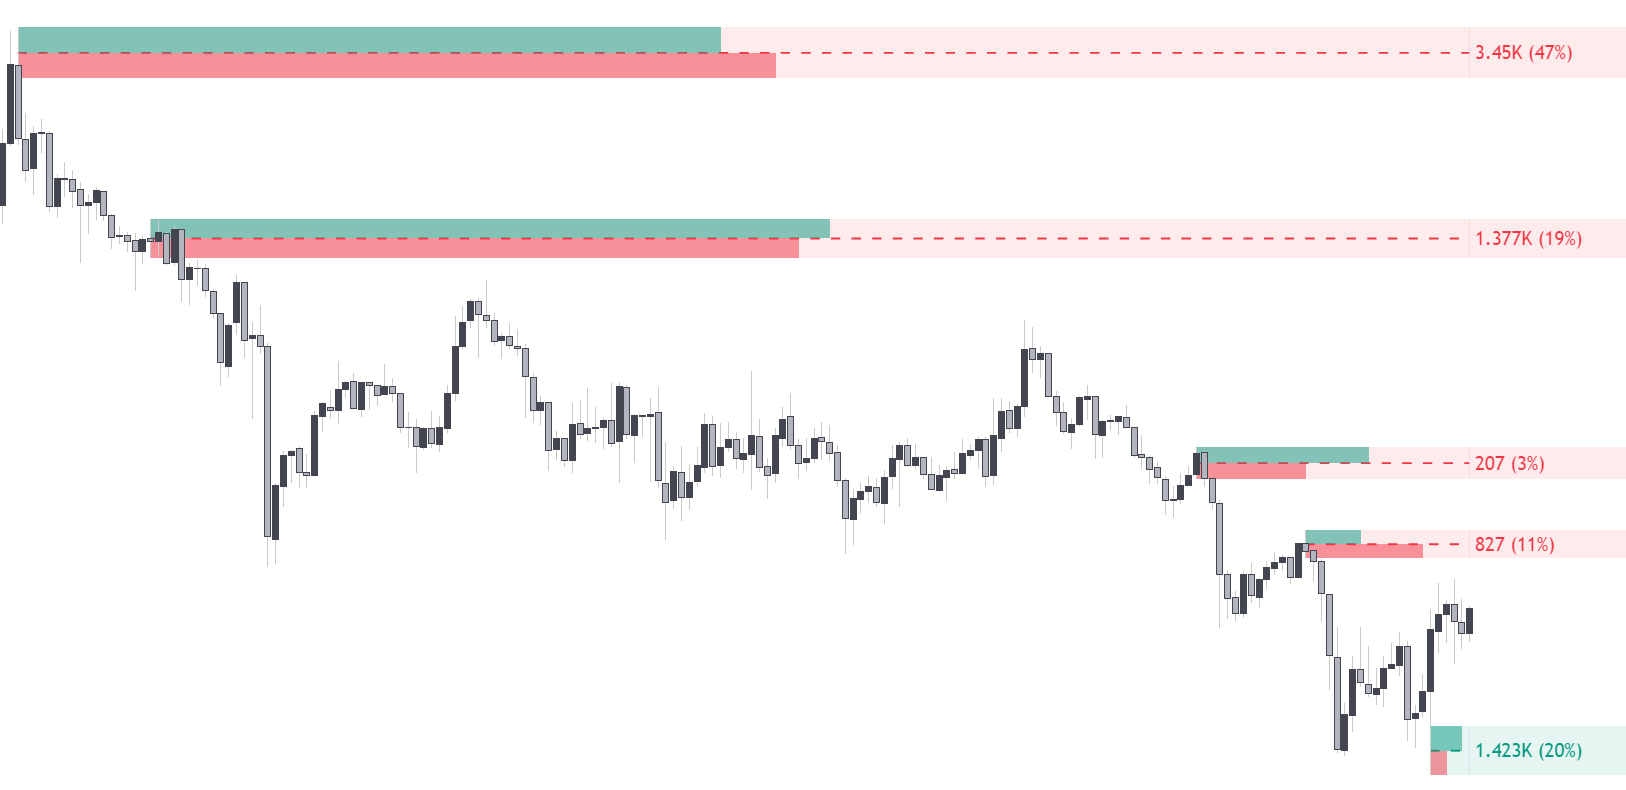
The toolkit is able to return various information regarding an order block. Internal activity highlight the bullish and bearish activity within the interval used to construct the order block, with green bars highlighting bullish activity, and red bars highlighting bearish activity.
This allows users to see if the activity associated to an order block is in accordance with its type, or if the activity is uniform. Users can utilize this to estimate when bulls or bears are potentially exhausted at certain order blocks in the market, as such it can be used to further understand if price is likely to break or respect an order block.
Internal activity and metrics both require volume data in order to be displayed.
### Metrics [#metrics]
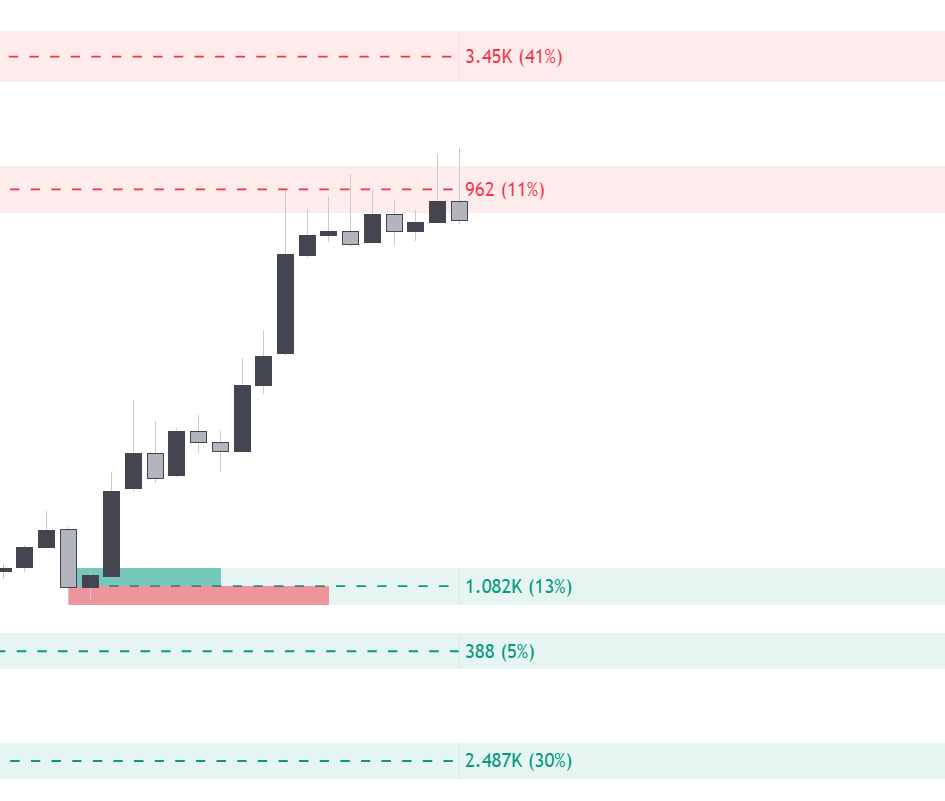
Metrics are displayed to the right of an order block near the most recent historical price bar. This information represent the accumulated volume within the interval used to construct the order block, and can be useful to determine how significant an order block is, with larger volume indicating a more significant order block.
The percentage to the right indicates how much the volume of an order block account for the total accumulated volume of all Volumetric Order Blocks displayed on the chart, this allows to quickly determine which Volumetric Order Blocks can be more interesting to look for.
You can change the size of the metrics from the **OB Metrics Size** setting within the **GENERAL STYLING** settings section, available options include: *tiny*, *small* (default), *normal*, and *auto*.
### Processing Internal Activity Data [#processing-internal-activity-data]
Users interested in accessing and highlighting occurrence of specific conditions related to the internal activity of the most recent order block can use the "OB Volume" condition creator in the [custom alert creator](./alerts#custom-alert-creator).
This condition creator includes the following conditions:
| Condition | Description |
| :---------------------------: | :--------------------------------------------------------------------------------------------------------------------------------------------------------------------------: |
| **Buy Volume** | Buy volume associated to the most recent order block. |
| **Sell Volume** | Sell volume associated to the most recent order block. |
| **Total Volume** | Total volume associated to the most recent order block. |
| **Percentage** | Volume percentage associated to the most recent order block. |
| **Buy Volume > Sell Volume** | Return true if the buy volume is greater than the sell volume of the most recent order block. |
| **Buy Volume \< Sell Volume** | Return true if the buy volume is lower than the sell volume of the most recent order block. |
| **Positive Association** | Return true if buy volume is greater than sell volume in the case of a bullish order block, or if buy volume is lower than sell volume in the case of a bullish order block. |
| **Negative Association** | Return true if buy volume is lower than sell volume in the case of a bullish order block, or if buy volume is greater than sell volume in the case of a bullish order block. |
This data is always associated with the most recent order block, regardless of its mitigation status.
When "Buy Volume", "Sell Volume", "Total Volume", or "Percentage" are selected we want to compare these values to a user set value as reference using the following comparison operators:
* Greater Than
* Lower Than
* Equal
## Mitigation Methods [#mitigation-methods]
Once price break an order block this order block is said to have been "mitigated", and will automatically disappear. Users can determine the condition for an order block to be considered mitigated through the **Mitigation Method** setting, each method is described below:
| Method | Description |
| :---------: | :-------------------------------------------------------------------------------------------------------------------------------------------------------------------------------------------------: |
| **Close** | Mitigates an order block once price close cross above its upper extremity in the case of a bearish order block, and under its lower extremity in case of a bullish order block. |
| **Wick** | Mitigates an order block once price high cross above its upper extremity in the case of a bearish order block, and when price low cross under its lower extremity in case of a bullish order block. |
| **Average** | Mitigates an order block once price cross its average level. |
Builtins alerts for Volumetric Order Blocks mitigation are available to the users.
## MTF Order Blocks [#mtf-order-blocks]
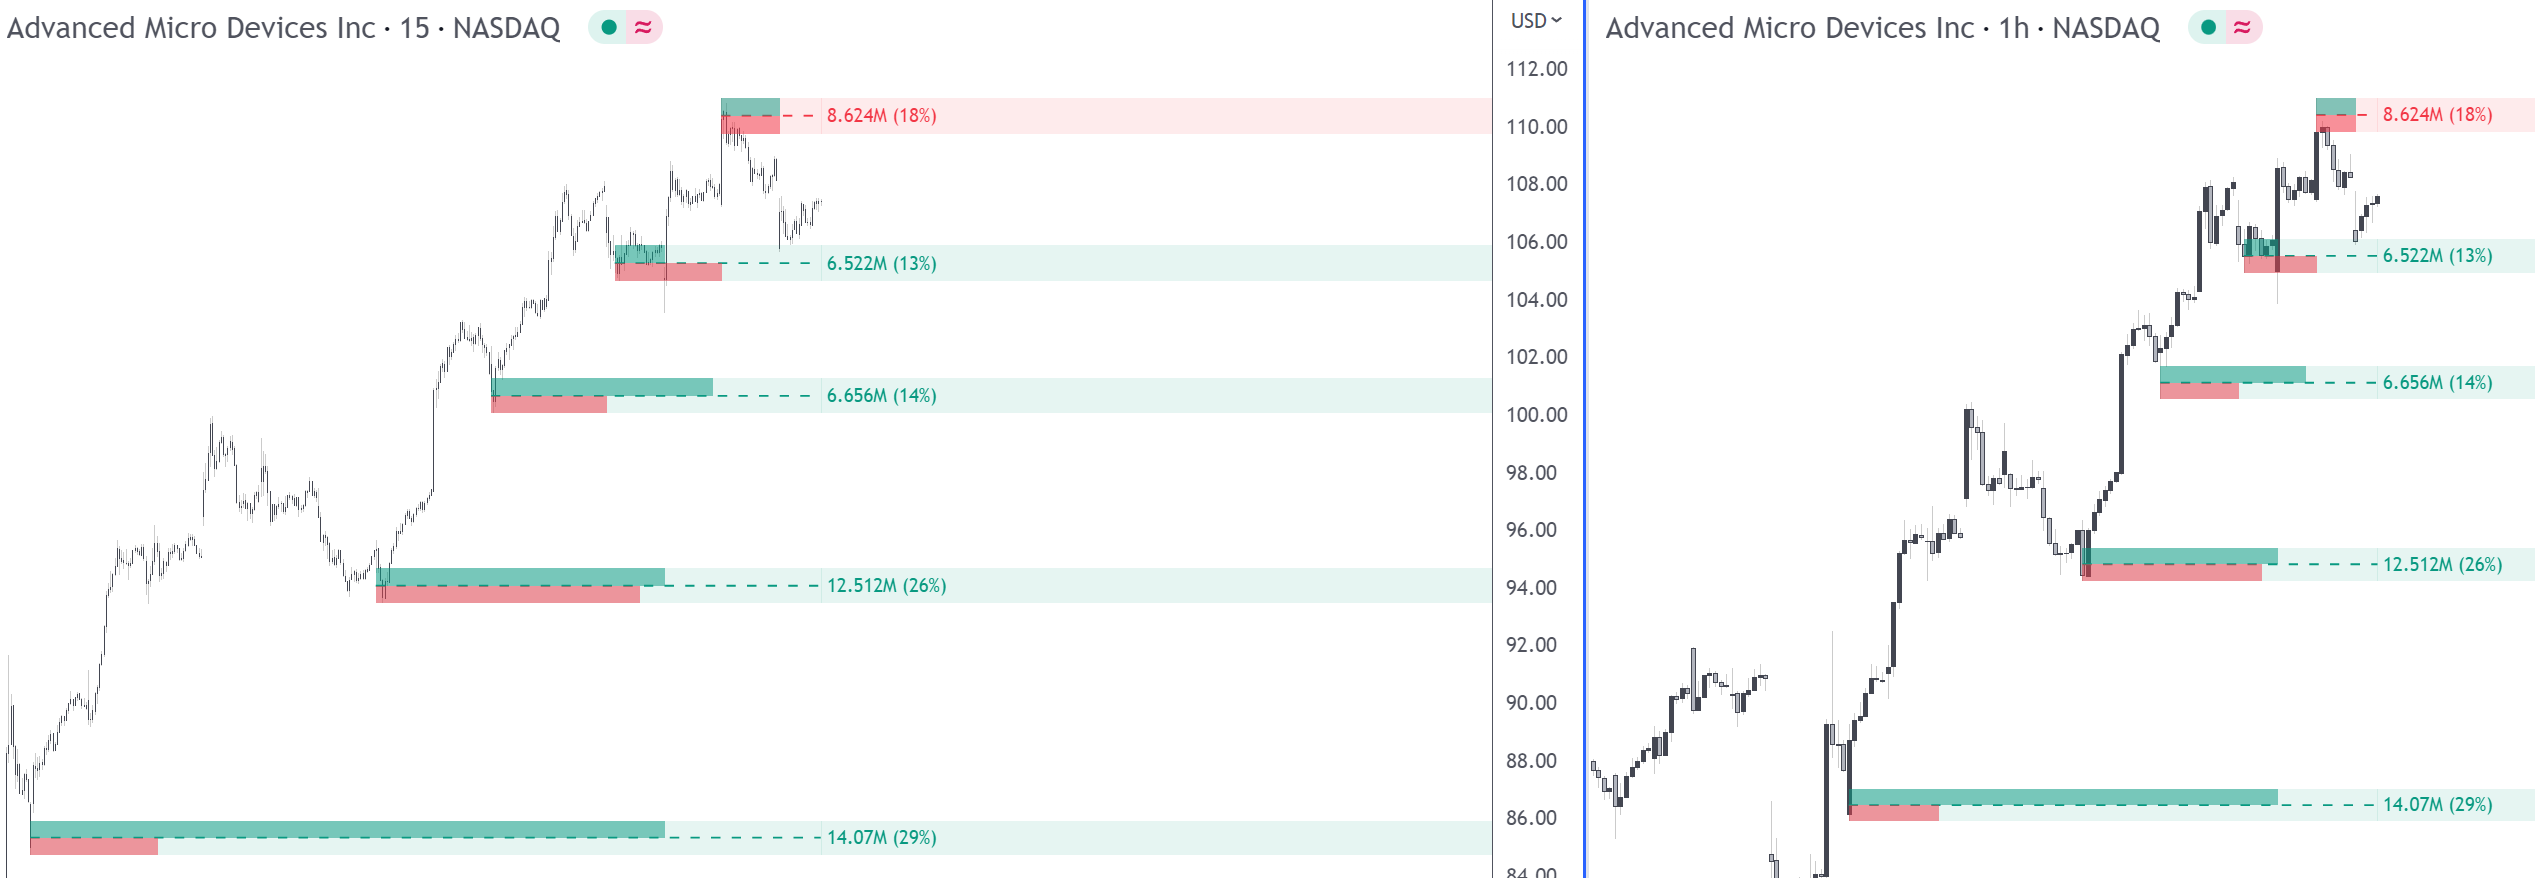
The user can display internal and swing Volumetric Order Blocks of a high or lower chart timeframe on the chart using the **Timeframe** settings. The displayed Volumetric Order Blocks will have the same price values and volume data than the ones of the selected timeframe.
The time location of an order block of a different timeframe can differ from the location on its chart timeframe, these behaviors is proper to the tools used to retrieve Volumetric Order Blocks data on different timeframe.
This can also affect when an order block data is retrieved, potentially causing mitigated Volumetric Order Blocks to appear unmitigated.
# Premium & Discount Zones (/docs/algos/price-action-concepts/pdzones)
Premium & Discount zones highlight three specific price areas, one upper area (premium), one central area (equilibrium), and one lower area (discount).
These areas can be used to know when an event is occurring at a premium, discount, or within an equilibrium zone.
If a condition indicative of an uptrend occur within a discount zone then it would have an higher chance of being the cause of a reversal, this also applies for a condition indicative of a downtrend occurring within the premium zone.
Additionally, each area can be used as a support or resistance.
# Highs & Lows MTF (/docs/algos/price-action-concepts/previous-high-low)
It is common for traders to use the maximum and minimum price point reached in a previous day, week, month, or on specific periods as support and resistances levels.
The toolkit is able to return levels from the maximum and minimum price made during:
* The previous day
* The previous week
* The previous month
* The previous quarter
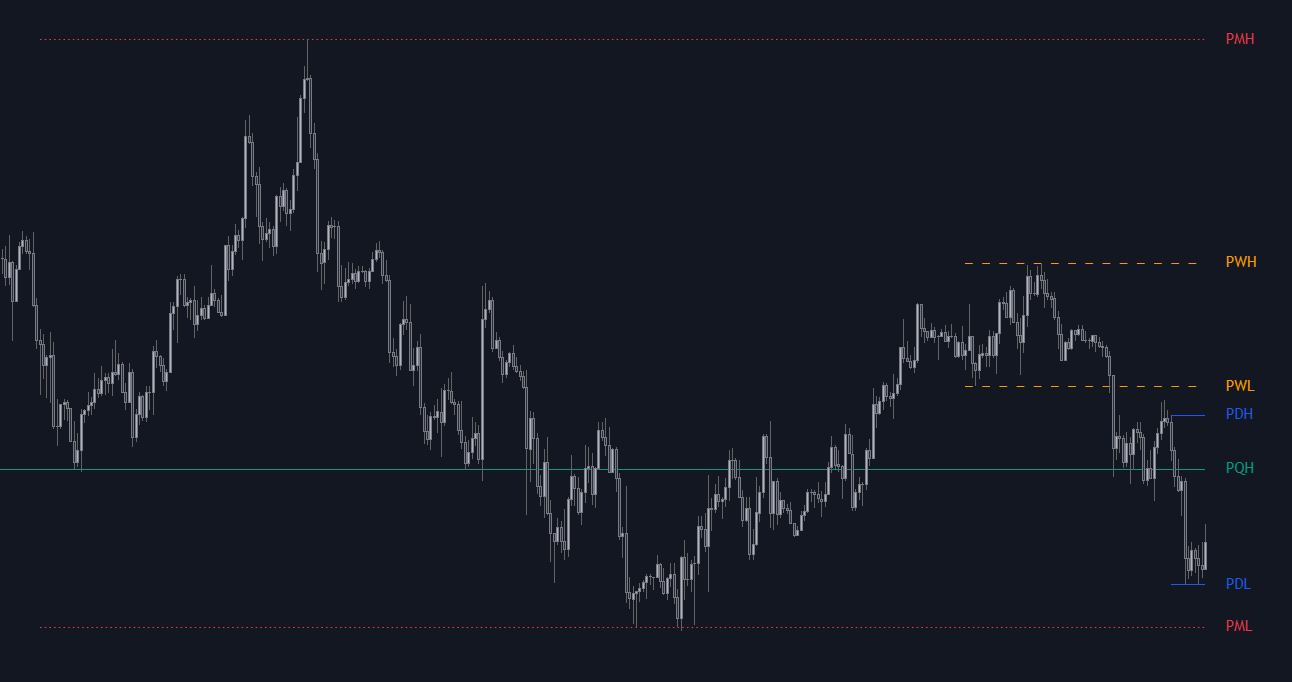
Each can be displayed from the **HIGHS & LOWS MTF** setting section.
## Day of Week High / Low [#day-of-week-high--low]
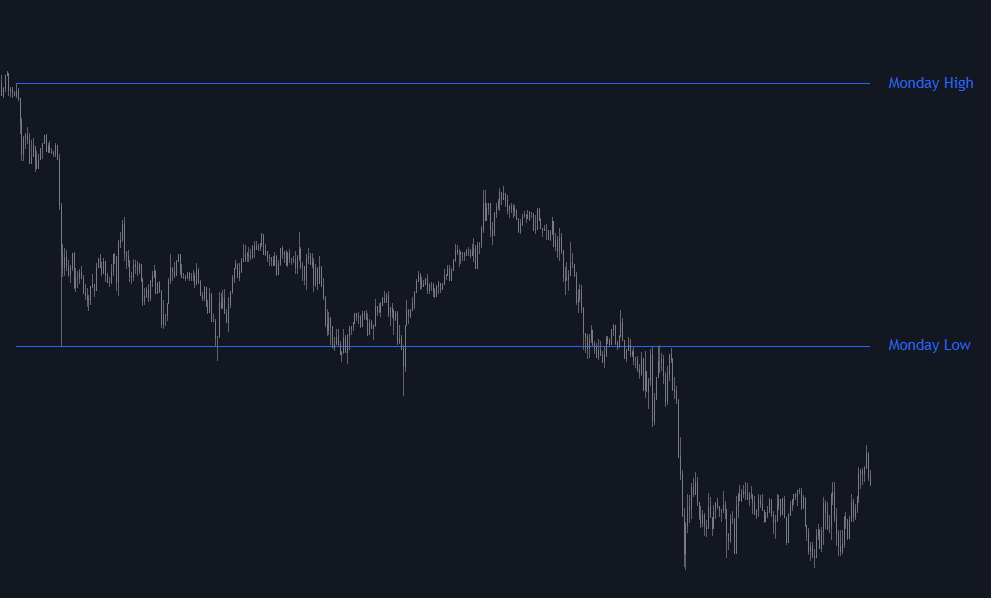
Users can display the maximum and minimum price point reached during a user-selected day of the week (Monday by default).
If the current day is the one selected, the returned level will track the highest and lowest prices reached during the day.
Some days of the week may be associated to closed markets for specific assets. As such certain days may not return levels when selected.
# Settings Reference (/docs/algos/price-action-concepts/settings)
To open the settings menu, place your mouse pointer over the indicator title on your chart, you will then see a list of icons appear, and click on the gear ⚙️ icon.
You can also open the settings panel by double-clicking any element displayed by the toolkit.
## Market Structure [#market-structure]
***
### Internal [#internal]
Show all types of internal market structures.
Show all types of change of characters (CHoCH).
Only show "supported" change of characters (CHoCH+).
Only show "leading" change of characters (CHoCH).
Only show break of structures (BOS).
Show no internal market structure.
Type of internal market structures to display.
Determines the sensitivity of the swing detection algorithm.
Higher values will return longer-term swing points, and as such longer-term internal market structures.
### Swing [#swing]
Show all types of swing market structures.
Show all types of change of characters (CHoCH).
Only show "supported" change of characters (CHoCH+).
Only show "leading" change of characters (CHoCH).
Only show break of structures (BOS).
Show no swing market structure.
Type of swing market structures to display.
Determines the sensitivity of the swing detection algorithm.
Higher values will return longer-term swing points, and as such longer-term swing market structures.
### Timeframe [#timeframe]
Chart timeframe used for the detection of internal and swing market structures.
### Show Swing High/Low [#show-swing-highlow]
Display detected swing points when enabled.
Detected swing points are displayed retrospectively, and as such do not appear in real-time.
### Show Strong/Weak HL [#show-strongweak-hl]
Display strong/weak swing levels when enabled.
### Color Candles [#color-candles]
Color user chart candles based on the trend detected from internal market structures as follows:
* Bullish CHoCH: Dark Green
* Bullish BOS: Bright Green
* Bearish BOS: Bright Red
* Bearish CHoCH: Dark Red
## Volumetric Order Blocks [#volumetric-order-blocks]
***
### Show Last [#show-last]
Display volumetric order blocks.
Determines how many of the most recent volumetric order blocks to display on the chart.
### Internal Buy/Sell Activity [#internal-buysell-activity]
Display volumetric order blocks.
### Show Breakers [#show-breakers]
Display breaker blocks.
### Length [#length]
Determines the sensitivity of the swing detection algorithm used to detect order blocks.
Higher values will return longer-term swing points, and as such longer-term order blocks.
### Mitigation Method [#mitigation-method]
Mitigate order blocks using the closing price.
Mitigate order blocks using candle wicks (high/low price).
Mitigate order blocks using the crossing from the closing price and the order block area average level.
Determines the method used to mitigate order blocks.
### Timeframe [#timeframe-1]
Chart timeframe used for the detection of order blocks.
### Show Metrics [#show-metrics]
Display order block metrics such as total volume and percentage located at the right of the chart.
### Show Mid-Line [#show-mid-line]
Display order block area average level (dashed line).
### Hide Overlap [#hide-overlap]
Hide overlapping order blocks, conserving the most recent one.
## Liquidity Concepts [#liquidity-concepts]
***
### Trend Lines [#trend-lines]
Display trend lines when enabled.
Determines how many of the most recent respective bullish/bearish trend lines to display on the user chart.
### Patterns [#patterns]
Display detected pattern when enabled.
Determines the sensitivity of the swing detection algorithm used to detect patterns.
Higher values will return longer-term swing points, and as such longer-term patterns.
### Show Patterns Zones [#show-patterns-zones]
Display zones around the pattern lines.
### Equal H\&L [#equal-hl]
Display equal highs/lows on the chart.
Use short term swing point detection for detecting equal highs/lows, returning shorter term EQHL as a result.
Use long term swing point detection for detecting equal highs/lows, returning longer term EQHL as a result.
Determines the sensitivity of the swing detection algorithm used to detect equal highs/lows.
### Liquidity Grabs [#liquidity-grabs]
Display liquidity grabs on the chart.
## Imbalance Concepts [#imbalance-concepts]
***
Display the selected imbalance on the chart.
Detect fair value gaps (FVG) when selected.
Detect inverse fair value gaps when selected.
Detect double fair value gaps when selected.
Detect volume imbalances when selected.
Detect opening gaps when selected.
Determines which imbalance to detect.
### Mitigation Method [#mitigation-method-1]
Mitigate imbalances using the closing price.
Mitigate imbalancess using candle wicks (high/low price).
Mitigate imbalances using the crossing from the closing price and the imbalance area average level.
Determines the method used to mitigate imbalances.
### Timeframe [#timeframe-2]
Chart timeframe used for the detection of imbalances.
### Extend Imbalance [#extend-imbalance]
Extend the imbalance area to the right by the selected amount of bars.
### Volatility Threshold [#volatility-threshold]
Threshold used to filter out imbalances with a low area height. Higher values will preserver more volatility imbalances.
## Premium & Discount Zones [#premium--discount-zones]
### Premium/Discount Zones [#premiumdiscount-zones]
Display premium/discount and equilibrium zones on the chart when enabled.
***
## Highs & Lows MTF [#highs--lows-mtf]
***
### Daily [#daily]
Display previous daily high/low on the chart when enabled.
Use solid line style when selected.
Use dashed line style when selected.
Use dotted line style when selected.
Level line style.
### Weekly [#weekly]
Display previous weekly high/low on the chart when enabled.
Use solid line style when selected.
Use dashed line style when selected.
Use dotted line style when selected.
Level line style.
### Monthly [#monthly]
Display previous monthly high/low on the chart when enabled.
Use solid line style when selected.
Use dashed line style when selected.
Use dotted line style when selected.
Level line style.
### Quarterly [#quarterly]
Display previous quarterly high/low on the chart when enabled.
Use solid line style when selected.
Use dashed line style when selected.
Use dotted line style when selected.
Level line style.
### Day of week [#day-of-week]
Returns the high/low price levels made during the selected day of the week.
Use solid line style when selected.
Use dashed line style when selected.
Use dotted line style when selected.
Level line style.
## Fibonacci Retracements [#fibonacci-retracements]
***
### Fibonacci Top [#fibonacci-top]
Upper value used to calculate the retracements.
### Fibonacci Bottom [#fibonacci-bottom]
Lower value used to calculate the retracements.
### Ratios [#ratios]
Display the level with the associated ratio when enabled.
Numerical input determining the ratio used to construct the retracement.
These settings are available for 5 ratios
### Show Top/Bottom Levels [#show-topbottom-levels]
Display the top/bottom extremities used to construct the retracements.
### Anchor To Origin [#anchor-to-origin]
Set the left anchor of the retracement to the appropriate coordinate depending on the selected extremities. Else the most recent bar will be used as anchor.
## General Styling [#general-styling]
***
### Internal Label Style [#internal-label-style]
Determine the size of the internal market structures labels.
### Swing Label Style [#swing-label-style]
Determine the size of the swing market structures labels.
### Structures Theme [#structures-theme]
Use user set internal market structures colors as palette for market structures graphical elements.
Use white/gray tones as palette for market structures graphical elements.
Determine the color theme of market structures related graphical elements such as levels, labels, and candle coloring.
### EQHL Label Style [#eqhl-label-style]
Determine the size of the equal highs/lows labels.
### OB Metrics Size [#ob-metrics-size]
Automatically adjust text size to fit in the order block area.
Determine the size of the swing market structures labels.
## Custom Alert Creator [#custom-alert-creator]
***
### Market Structure [#market-structure-1]
Enable the selected Market Structure condition to be used in the custom alert creator.
List of market structure conditions to be used in the custom alert creator.
#### Market Structure Step [#market-structure-step]
Market structure conditions step in the custom alert creator sequence.
### Order Block [#order-block]
Enable the selected Order Block condition to be used in the custom alert creator.
List of Order Block conditions to be used in the custom alert creator.
#### Order Block Step [#order-block-step]
Order Block conditions step in the custom alert creator sequence.
### Imbalance [#imbalance]
Enable the selected Imbalance condition to be used in the custom alert creator.
List of Imbalance conditions to be used in the custom alert creator.
#### Imbalance Step [#imbalance-step]
Imbalance condition step in the custom alert creator sequence.
### Trendline [#trendline]
Enable the selected Trendline condition to be used in the custom alert creator.
List of Trendline conditions to be used in the custom alert creator.
### Trendline Step [#trendline-step]
Trendline condition step in the custom alert creator sequence.
### Pattern [#pattern]
Enable the selected Pattern condition to be used in the custom alert creator.
List of Pattern conditions to be used in the custom alert creator.
#### Pattern Step [#pattern-step]
Pattern condition step in the custom alert creator sequence.
### Liquidity Grabs [#liquidity-grabs-1]
Enable the selected Liquidity Grabs condition to be used in the custom alert creator.
List of Liquidity Grabs conditions to be used in the custom alert creator.
#### Liquidity Grabs Step [#liquidity-grabs-step]
Liquidity Grabs condition step in the custom alert creator sequence.
### Premium/Discount [#premiumdiscount]
Enable the selected Premium/Discount condition to be used in the custom alert creator.
List of Premium/Discount conditions to be used in the custom alert creator.
#### Premium/Discount Step [#premiumdiscount-step]
Premium/Discount condition step in the custom alert creator sequence.
### Session [#session]
Enable session condition in the custom alert creator.
Session times used in the custom alert creator.
#### Session Step [#session-step]
Session condition step in the custom alert creator sequence.
### OB Volume [#ob-volume]
Enable the selected OB Volume condition to be used in the custom alert creator.
List of OB Volume data sources to be used in the custom alert creator.
Comparison operator used to compare the selected OB data source to the selected numerical input.
Numerical input.
#### Ob Volume Step [#ob-volume-step]
OB Volume condition step in the custom alert creator sequence.
### External Condition (1) [#external-condition-1]
Enable the selected External condition to be used in the custom alert creator.
...
Other external indicator outputs can be used as source.
First source input.
Comparison operator used to compare the two selected sources.
...
Other external indicator outputs can be used as source.
Second source input.
#### External Step (1) [#external-step-1]
First external source condition step in the custom alert creator sequence.
### External Condition (2) [#external-condition-2]
Enable the selected External condition to be used in the custom alert creator.
...
Other external indicator outputs can be used as source.
First source input.
Comparison operator used to compare the two selected sources.
...
Other external indicator outputs can be used as source.
Second source input.
#### External Step (2) [#external-step-2]
Second external source condition step in the custom alert creator sequence.
### External Condition (3) [#external-condition-3]
Enable the selected External condition to be used in the custom alert creator.
...
Other external indicator outputs can be used as source.
Source input.
Comparison operator used to compare the selected source to the selected numerical value.
Numerical input.
#### External Step (3) [#external-step-3]
Third external source condition step in the custom alert creator sequence.
### Invalidation Behavior [#invalidation-behavior]
No invalidation behavior.
The "Invalidate On Step 1" behavior allows to reset an incomplete sequence of conditions when the condition on step 1 trigger. This prevents the first step condition from happening in between other steps of the condition sequence.
This behavior is useful when the first step of our sequence of conditions needs to never be repeated during the sequence.
Let's take an example where we use 3 regular steps.
Step 1 condition trigger, we will now evaluate step 2 from now on.
Step 2 condition trigger, we will now evaluate step 3 from now on.
Step 1 condition trigger, we start evaluating step 2 from now.
The "Invalidate On Any Repeated Step" behavior allows to reset an incomplete sequence of conditions when a step is triggered such that it does not respect the user-set order of conditions.
This behavior is useful when we want a perfectly ordered sequence of conditions to complete, without any step repeating itself.
Let's take an example where we use 3 regular steps.
Step 1 condition trigger, we will now evaluate step 2 from now on.
Step 2 condition trigger, we will now evaluate step 3 from now on.
Step 1 or 2 conditions trigger, we start evaluating step 1 from now.
Invalidation behaviors allow adding more restrictions to a sequence of conditions; users can use two different invalidation behaviors described below.
### Maximum Step Interval [#maximum-step-interval]
Maximum allowed horizontal distance (in bars) between two steps.
If the number of bars since a step exceeds the selected threshold, then the condition sequence is reset, and we start evaluating from step 1 again.
### Highlight Custom Alert Triggers [#highlight-custom-alert-triggers]
When a custom alert condition is set, a visual element is displayed at the bottom of the chart in order to more easily visualize when the custom alert conditions occurs (displayed by default).
## Calculation [#calculation]
### Calculated Bars [#calculated-bars]
Limits the initial calculation of the toolkit to the specified amount of most recent bars. Lower values will return a faster computation time. A value of 0 will compute the toolkit over the entire data history.
# Alerts (/docs/algos/signals-overlays/alerts)
Signals & Overlays® can alert users for multiple events relevant to the existing features in the toolkit. To learn more about how to set alerts in general see [how to create alerts on tradingview](/docs/getting-started/tradingview-alerts).
In order for an alert to work in the toolkit make sure the related feature is enabled
## Using Placeholders With Confirmation/Contrarian Alerts [#using-placeholders-with-confirmationcontrarian-alerts]
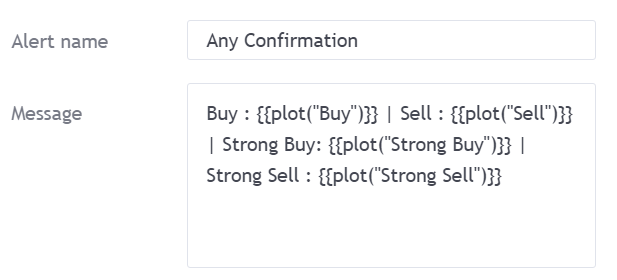
When creating an alert using 'Any Confirmation' or 'Any Contrarian' it is possible to use placeholders so that the alert message returns the type of signal that triggered the alert.
In order to do so, paste the following line in the message field:
```
Bullish : {{plot("Bullish")}} | Bearish : {{plot("Bearish")}} | Bullish+: {{plot("Bullish+")}} | Bearish+ : {{plot("Bearish+")}}
```
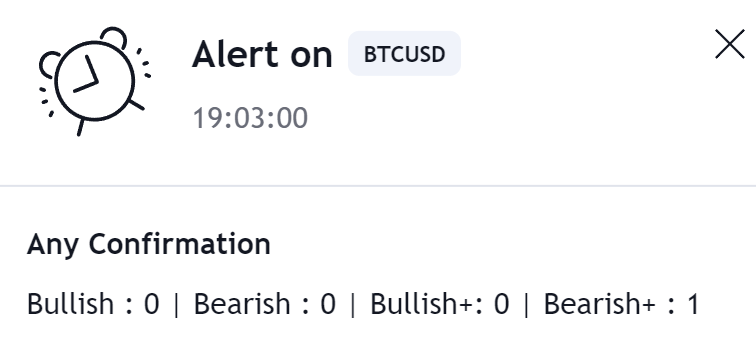
## Any Alert() Function Call [#any-alert-function-call]
The *any alert() function call* alert condition allows to create one alert using various conditions, this allows to bypass the limit of one alert for free users as well as making the process of updating many alerts faster and easier.
To create such an alert go to the indicator settings, and scroll down to the '**ANY ALERT() FUNCTION CALL CONDITIONS**' section.
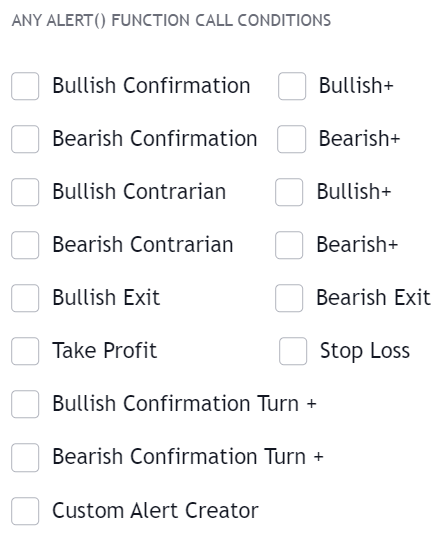
Toggle on the conditions of interest. Now create a new alert, in the first **Condition** drop-down menu select the **LuxAlgo Premium** indicator, in the second drop-down menu select **Any alert() function call**, you can then create the alert.
This alert would use **once per bar close** by default.
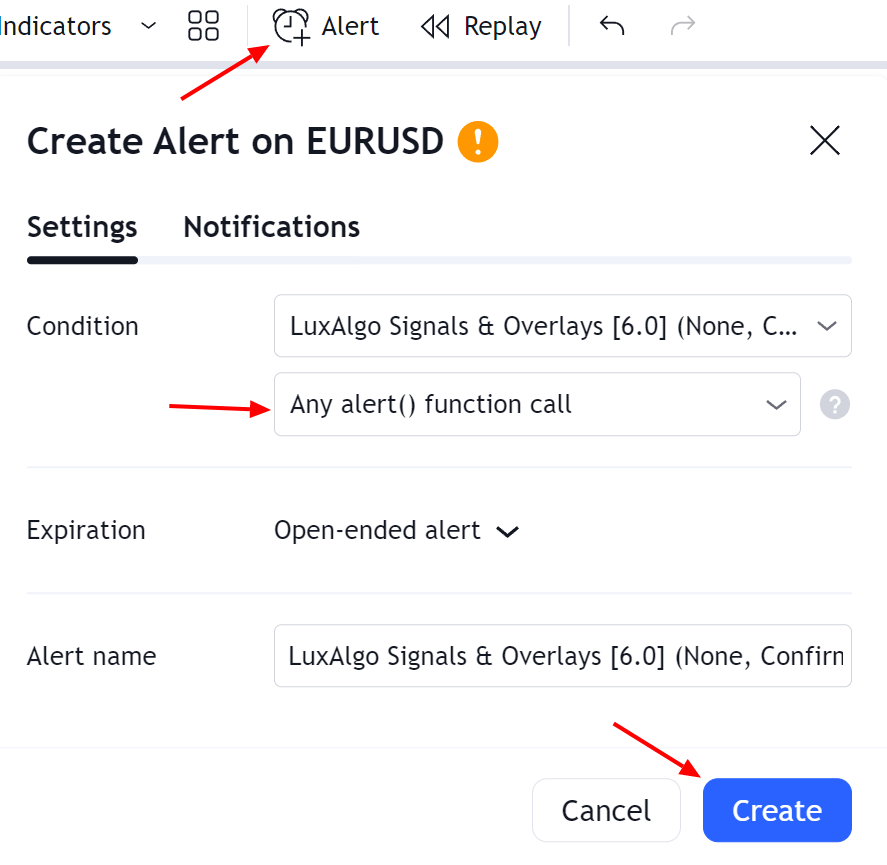
All-in-one alerts do not differ from regular alerts, they will be using the same indicator settings as the one used during their creation. Note however that you cannot set a custom message for all-in-one alerts, the message displayed when the selected conditions trigger will be the same as the one used in the same individual alert conditions.
### Any Alert() Function Call Message [#any-alert-function-call-message]
Users can set a custom message that will be used when an "any alert() function call" condition is triggered in the message field below the list of conditions. Users can use placeholders to customize messages and return useful information, the following placeholders are supported:
#### Symbol Placeholders [#symbol-placeholders]
| Placeholder | Description | Example |
| ------------ | ------------------------------------------------------- | ------------------------------- |
| `{default}` | Default message associated with the triggered condition | `"Bullish Confirmation Signal"` |
| `{ticker}` | Symbol ticker without the exchange prefix | `"MSFT"` |
| `{exchange}` | Symbol exchange/data source | `"COINBASE"` |
| `{sector}` | Sector of the symbol, `na` if the symbol has no sector | `"Technology Services"` |
| `{market}` | Symbol market type | `"Stocks"` |
#### Time Placeholders [#time-placeholders]
| Placeholder | Description | Example |
| ----------- | -------------------------------------------------------------------------------------- | ----------------- |
| `{tf}` | Chart timeframe, includes "S" for seconds, "D" for days, "W" for weeks, "M" for months | `"15"` |
| `{time}` | Unix time in milliseconds in exchange timezone | `"1705331385158"` |
| `{year}` | Current year in exchange timezone | `"2024"` |
| `{month}` | Current month in exchange timezone | `"7"` |
| `{day}` | Current day of the month in exchange timezone | `"21"` |
#### Data Placeholders [#data-placeholders]
| Placeholder | Description | Example |
| ----------- | -------------- | ---------- |
| `{open}` | Opening price | `"1.2145"` |
| `{high}` | High price | `"1.2357"` |
| `{low}` | Low price | `"1.1983"` |
| `{close}` | Closing price | `"1.0569"` |
| `{volume}` | Current volume | `"45216"` |
#### Indicators Placeholders [#indicators-placeholders]
| Placeholder | Description | Example |
| --------------- | ----------------------------------------- | ---------- |
| `{smart_trail}` | Smart Trail overlay value | `"0.8321"` |
| `{rz_r3}` | Reversal Zones overlay resistance 3 value | `"3.4102"` |
| `{rz_r2}` | Reversal Zones overlay resistance 2 value | `"1.0293"` |
| `{rz_r1}` | Reversal Zones overlay resistance 1 value | `"5.1234"` |
| `{rz_s1}` | Reversal Zones overlay support 1 value | `"2.5647"` |
| `{rz_s2}` | Reversal Zones overlay support 2 value | `"7.8910"` |
| `{rz_s3}` | Reversal Zones overlay support 3 value | `"6.2345"` |
| `{catcher}` | Trend Catcher overlay value | `"4.3456"` |
| `{tracer}` | Trend Tracer overlay value | `"3.7812"` |
| `{neo_lead}` | Neo Cloud overlay lead value | `"1.9087"` |
| `{neo_lag}` | Neo Cloud overlay lag value | `"0.4571"` |
| `{tp1}` | Take Profit 1 value | `"2.7690"` |
| `{sl1}` | Stop Loss 1 value | `"8.1203"` |
| `{tp2}` | Take Profit 2 value | `"9.6584"` |
| `{sl2}` | Stop Loss 2 | `"3.1246"` |
### Format as JSON [#format-as-json]
Use the following message template to receive "any alert() function call" messages in the JSON format:
```json
{
"alert": "{default}",
"ticker": "{ticker}",
"tf": "{tf}",
"ohlcv":{
"open": {open},
"high": {high},
"low": {low},
"close": {close},
"volume": {volume}
},
"bartime": {time}
}
```
### Updating Alerts Using Any Alert() Function Call [#updating-alerts-using-any-alert-function-call]
If you already set an *any alert() function call* alert and want to change the indicator settings or want to toggle on another condition all you need to do is edit the alert you want to update, select the second instance of the indicator in the first **Condition** drop-down menu and then click on save.
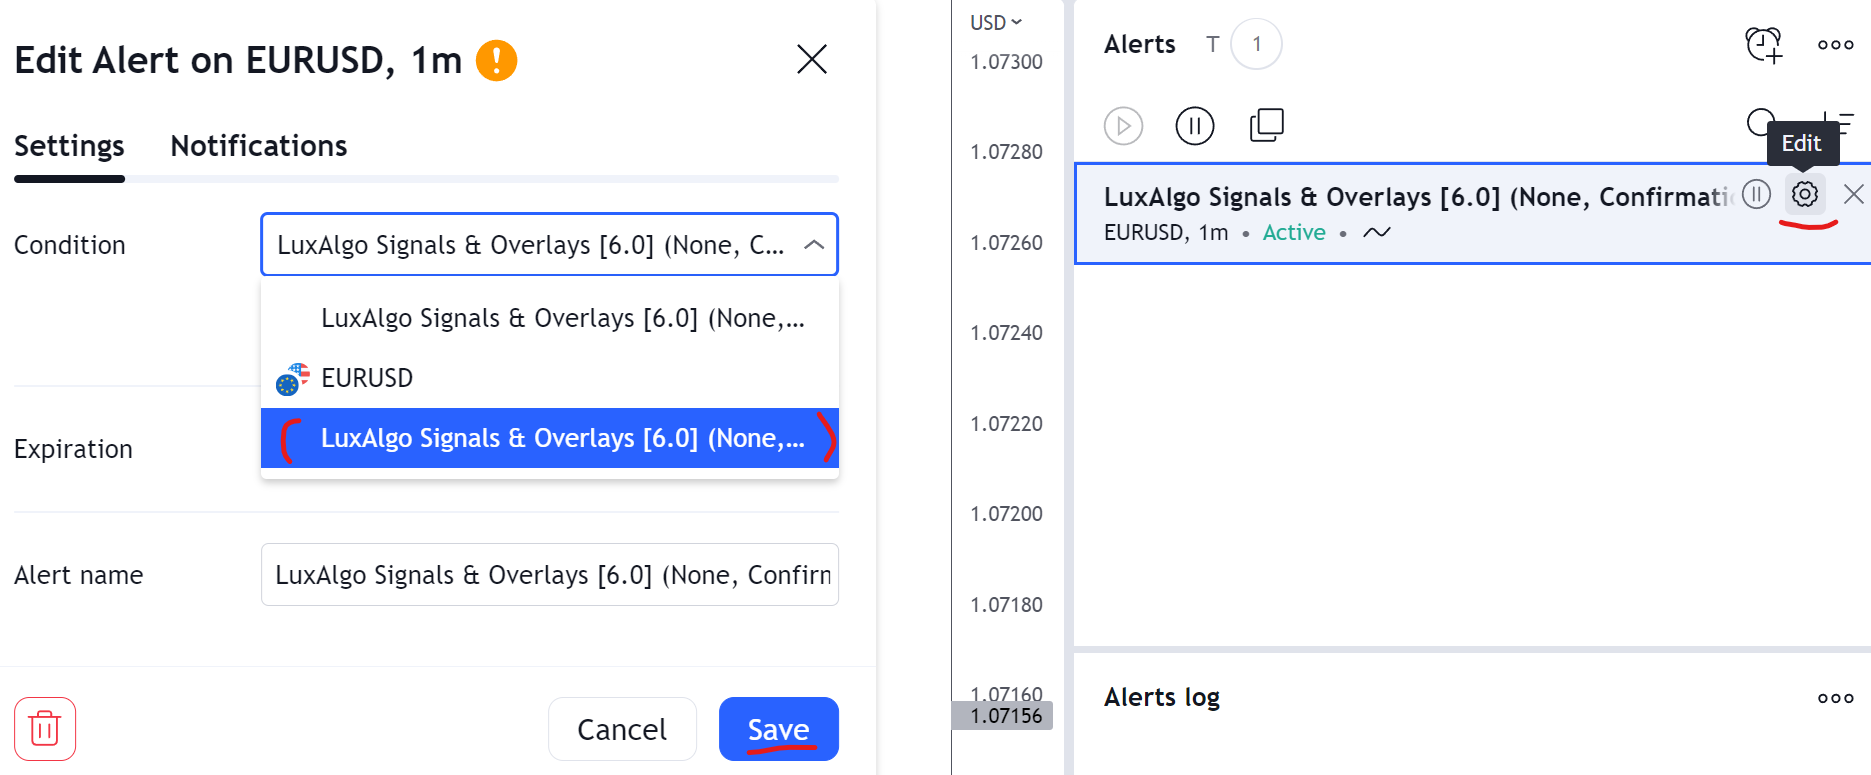
## Custom Alert Creator [#custom-alert-creator]
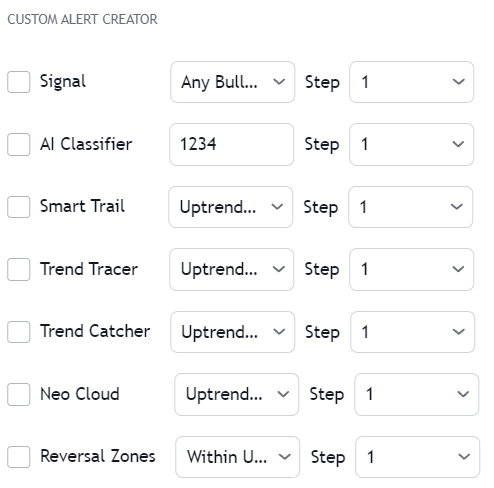
Users wishing to construct more complex alerts using features within the toolkit and/or external indicators can use the **Custom Alert Creator**.
The custom alert creator allows alerting when various user-set conditions are met or when a sequence of conditions is complete.
A user wishing to be alerted when any bullish signal occurs while the smart trail is bullish could do it as follows:
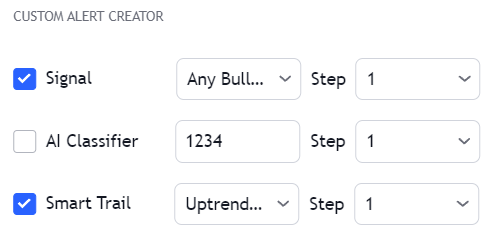
A custom alert can be triggered as an *any alert() function call* if the setting is selected or as a regular alert when selected in the Tradingview alert creator menu.
### Steps [#steps]
Steps allow creating a sequence of conditions, which when met trigger an alert. When a condition with a step equal to 1 is met the next condition associated with step 2 will be evaluated (if enabled) and so on for higher steps (if any).
Conditions with the same associated step will require both conditions to be true in order for the condition associated with a higher step (if any) to be evaluated. This allows certain conditions to act as filters.
A user wishing to be alerted for any bullish confirmation signal classified as 1 or 2 by the ML Classifier occurring after the smart trail turned bullish could do it as follows:
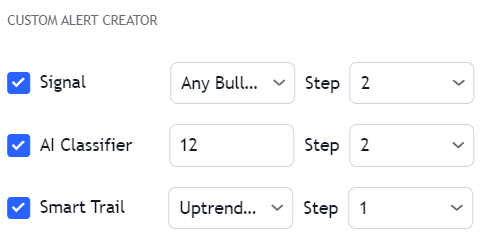
*Make sure the ML Classifier is enabled*.
Make sure steps are set such that they form a linear sequence. For example, if the lowest step is 2 or if the set steps are only 1 and 3 an error will be returned.
#### OR Step Operator [#or-step-operator]
The "OR" step operator can be used to get alerted for any additional condition using "OR" as step, in addition to other set custom alert conditions.
Conditions using the "OR" step can be highlighted using a different color, which can be set from the Custom Alert Creator settings. Users can choose the location of this visual element (top or bottom of the chart).
#### All Step Operator [#all-step-operator]
The "All" step operator can be used to filter any set "Step" condition, including "OR" and "Invalidate".
This step operator can be useful if all the steps in a sequence needs to obey a specific rule.
If a user has 2 steps set, and requires both of these to occur at a specific time interval such as 9am to 1pm, then we can use a "Session" condition using the "All" step, requiring our step 1 and step 2 to be occur between 9am and 1pm.
#### Invalidate Step [#invalidate-step]
The "Invalidate" step allows to set a condition as an "invalidation condition". When this condition is triggered while a sequence of conditions is incomplete, the sequence will restart at step 1.
If multiple steps are set as "Invalidate" any of the conditions being true will reset the sequence of conditions, as such not all of them are required to be true for the sequence of conditions to reset.
Let's take an example where we use 2 regular steps and one "Invalidate" step. The alert will trigger when step 2 trigger after step 1 has been triggered.
Step 1 condition trigger, we will now evaluate step 2 from now on.
Invalidation step condition trigger, we reset the sequence and evaluate step 1 just after.
### Invalidation Behaviors [#invalidation-behaviors]
Invalidation behaviors allows adding more restrictions to a sequence of conditions, users can use two different invalidation behaviors described below:
#### Invalidate On Step 1 [#invalidate-on-step-1]
The "Invalidate On Step 1" behavior allows to reset an incomplete sequence of conditions when the condition on step 1 trigger. This prevents the first step condition from happening in between other steps of the condition sequence.
This behavior is useful when the first step of our sequence of conditions needs to never be repeated during the sequence.
Let's take an example where we use 3 regular steps.
Step 1 condition trigger, we will now evaluate step 2 from now on.
Step 2 condition trigger, we will now evaluate step 3 from now on.
Step 1 condition trigger, we start evaluating step 2 from now.
#### Invalidate On Any Repeated Step [#invalidate-on-any-repeated-step]
The "Invalidate On Any Repeated Step" behavior allows to reset an incomplete sequence of conditions when a step is triggered such that it does not respect the set order of conditions.
This behavior is useful when we want a perfectly ordered sequence of conditions to complete, without any step repeating itself.
Let's take an example where we use 3 regular steps.
Step 1 condition trigger, we will now evaluate step 2 from now on.
Step 2 condition trigger, we will now evaluate step 3 from now on.
Step 1 or 2 conditions trigger, we start evaluating step 1 from now.
### Maximum Step Interval [#maximum-step-interval]
Users can determine what is the maximum allowed horizontal distance (in bars) between two steps by enabling the "Maximum Step Interval" setting. This allows restricting steps separated by a large amount of bars.
If the amount of bars since a step exceed the set threshold, then the conditions sequence is reset, and we start evaluating from step 1 again.
### Highlight On Chart [#highlight-on-chart]
When a custom alert condition is set, a visual element is displayed at the bottom of the chart in order to more easily visualize when the custom alert conditions occurs (displayed by default).
## Alerts Reference [#alerts-reference]
***
### Pre-Set Alerts [#pre-set-alerts]
| Alert | Description |
| ------------------------- | ------------------------------------------------------------------------------------------------ |
| Any alert() function call | Return when an alert when a user toggled any alert() condition is triggered (see sections below) |
| Any Confirmation | Triggers when any Confirmation signal (bullish/bearish normal/+) is displayed |
| Any Bullish Confirmation | Triggers when any bullish Confirmation signal (normal/+) is displayed |
| Any Bearish Confirmation | Triggers when any bearish Confirmation signal (normal/+) is displayed |
| Any Confirmation+ | Triggers when any Confirmation + signal (bullish/bearish) is displayed |
| Any Contrarian | Triggers when any Contrarian signal (normal/+ bullish/bearish) is displayed |
| Any Bullish Contrarian | Triggers when any bullish Contrarian signal (normal/+) is displayed |
| Any Bearish Contrarian | Triggers when any bearish Contrarian signal (normal/+) is displayed |
| Bullish Confirmation | Triggers when a normal bullish Confirmation signal is displayed |
| Bearish Confirmation | Triggers when a normal bearish Confirmation signal is displayed |
| Bullish Confirmation+ | Triggers when a bullish Confirmation+ signal is displayed |
| Bearish Confirmation+ | Triggers when a bearish Confirmation+ signal is displayed |
| Bullish Exit | Triggers when a bullish exit signal is displayed |
| Bearish Exit | Triggers when a bearish exit signal is displayed |
| Trend Catcher Down | Triggers once the Trend Catcher starts decreasing (switch from green to red) |
| Trend Catcher Up | Triggers once the Trend Catcher starts rising (switch from red to green) |
| Trend Tracer Down | Triggers once the Trend Tracer starts decreasing (switch from green to red) |
| Trend Tracer Up | Triggers once the Trend Tracer starts rising (switch from red to green) |
| Custom Alert Condition | Triggers on the event of a user set custom alert condition being true |
### Any alert() Function Call [#any-alert-function-call-1]
| Alert | Description | Default |
| ---------------------- | ------------------------------------------------------------------------------- | --------------------------------------------------------- |
| Bullish Confirmation | Triggers when a normal bullish Confirmation signal is displayed | |
| Bearish Confirmation | Triggers when a normal bearish Confirmation signal is displayed | |
| Bullish + | Triggers when a strong bullish Confirmation signal is displayed | |
| Bearish + | Triggers when a strong bearish Confirmation signal is displayed | |
| Bullish Contrarian | Triggers when a normal bullish Contrarian signal is displayed | |
| Bearish Contrarian | Triggers when a normal bearish Contrarian signal is displayed | |
| Bullish + | Triggers when a strong bullish Contrarian signal is displayed | |
| Bearish + | Triggers when a strong bearish Contrarian signal is displayed | |
| Bullish Exit | Triggers when a bullish exit signal is displayed | |
| Bearish Exit | Triggers when a bearish exit signal is displayed | |
| Take Profit | Triggers when a take profit is reached (TP1 or TP2) | |
| Stop Loss | Triggers when a stop loss is reached (SL1 or SL2) | |
| Bullish Turn + | Triggers when a weak bullish trend turns strong (purple candle switch to green) | |
| Bearish Turn + | Triggers when a weak bearish trend turns strong (purple candle switch to red) | |
| Custom Alert Condition | Triggers on the event of a user set custom alert condition being true | |
# Candle Coloring (/docs/algos/signals-overlays/candle-coloring)
The candle coloring feature allows the user to change the body color of the candles/bars when using candlesticks or bar charts. Three coloring modes are available, with two of them being based on the previously described signal methodologies.
Candle coloring also works on charts using Heikin-Ashi, Renko, Kagi, line break, point and figure, and range candles.
Each mode can be enabled from the settings in the **candle color mode** dropdown menu.
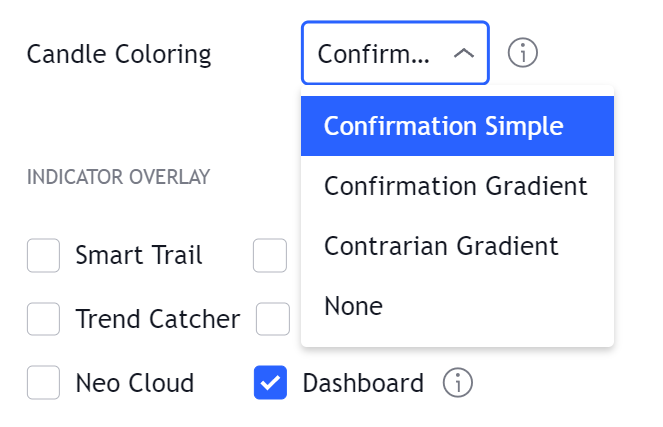
In order to use candle coloring as properly as possible make sure to disable the **borders** setting in your chart settings.
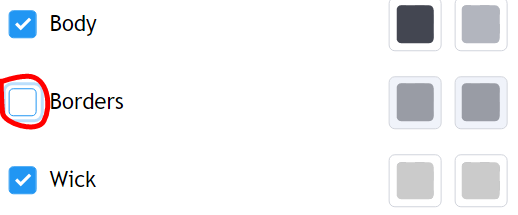
### Confirmation Simple [#confirmation-simple]
The **confirmation simple** color mode is based on the methodology used by confirmation signals and is the one enabled by default. This mode uses three colors, each one can be interpreted as follows:
* **Green candles:** Strong bullish signal active.
* **Red candles:** Strong bearish signal active.
* **Purple candles:** Normal bullish or bearish signal active.
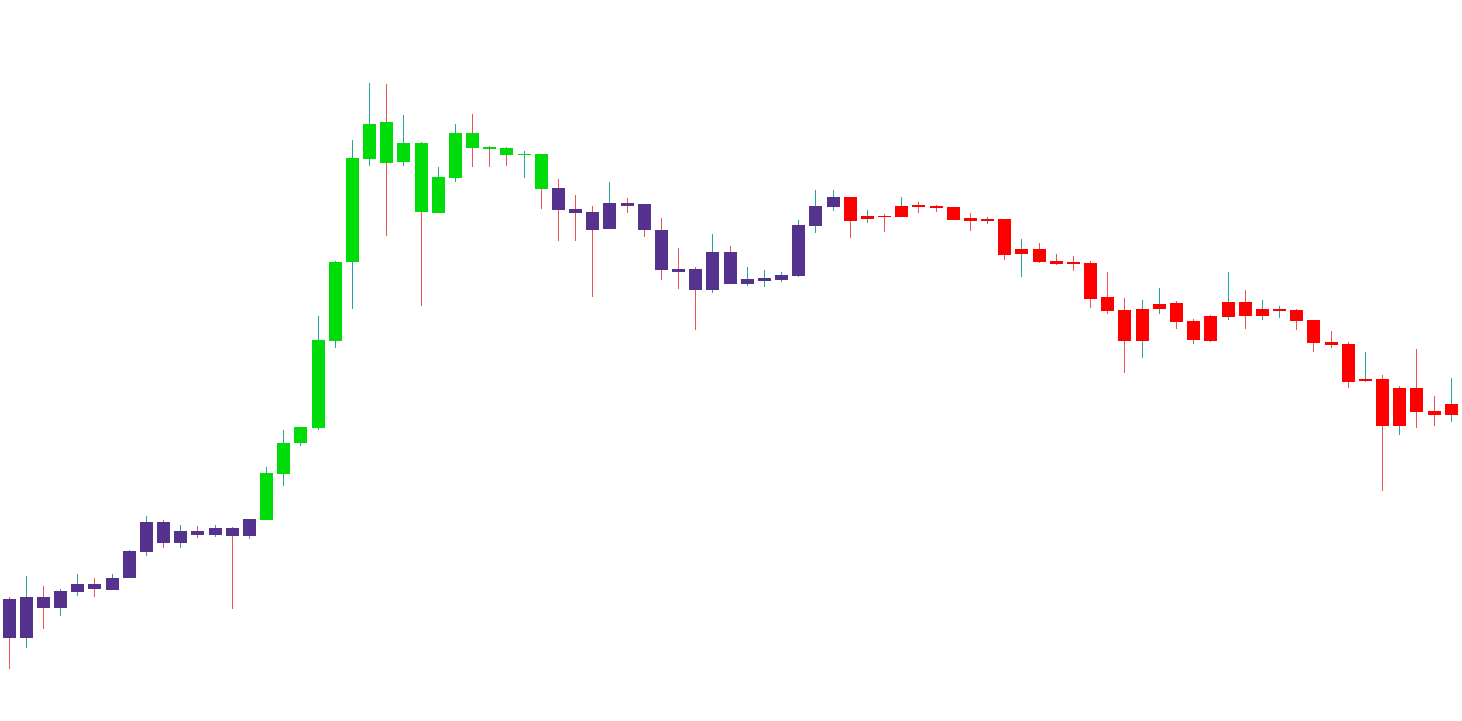
If you need to set an alert based on candle coloring or need to return information on what is the current candle color on an alert message simply use the **Bar Color Value** variable. This variable as three possible values each indicating the following:
* 1: Candle color is green
* 0: Candle color is purple
* -1: Candle color is red
This variable can be used as input for external indicators as well.
### Confirmation Gradient [#confirmation-gradient]
The **confirmation gradient** color mode is also based on the algorithm that generates confirmation signals, but will slightly differ from the previously described **confirmation simple** color mode.
Lighter green colors indicate strong bullish variations, while lighter red colors indicate strong bearish variations. Colors closer to purple indicate that the current variation might be a retracement or that the market is ranging.
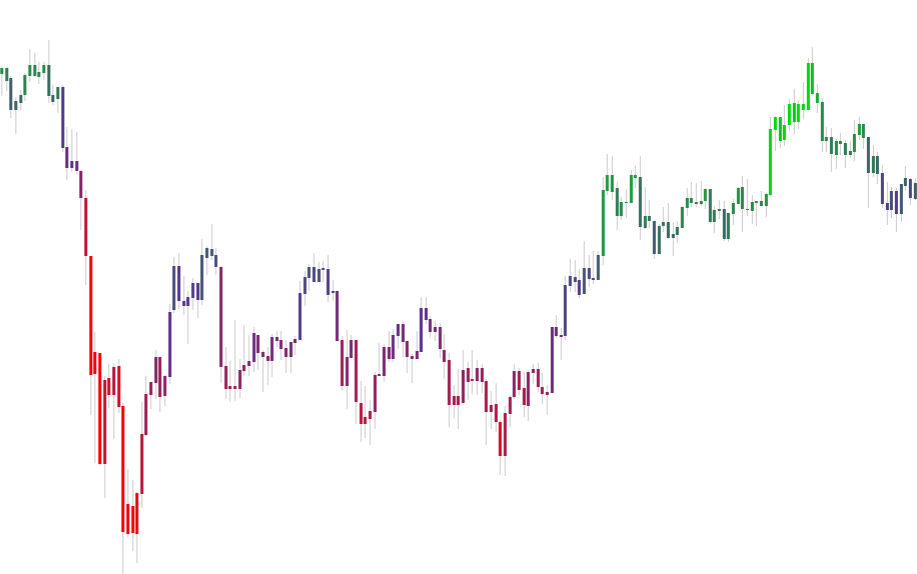
### Contrarian Gradient [#contrarian-gradient]
The **contrarian gradient** color mode is based on the contrarian signals algorithm. Stronger green colors indicate an oversold market and a potential reversal, while stronger red colors indicate an overbought market.
# Dashboard (/docs/algos/signals-overlays/dashboard)
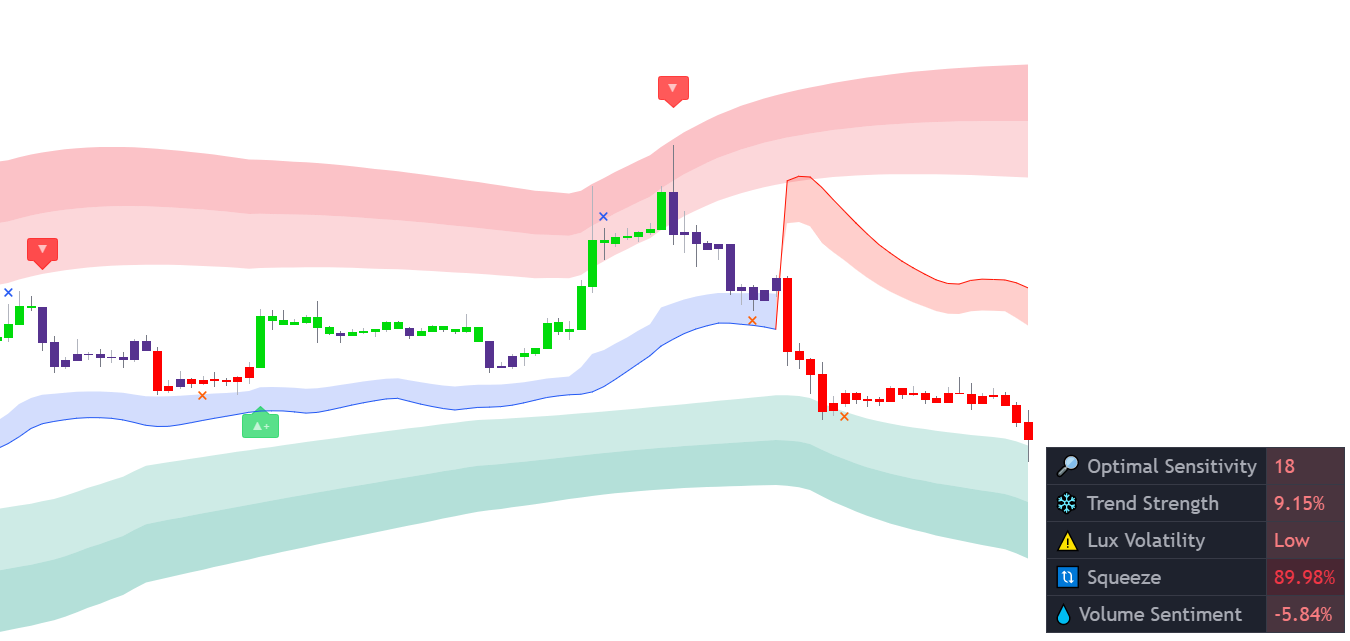
The dashboard displays the most relevant metrics from within our premium features. This feature is extremely useful to easily obtain pertinent information regarding the market and can be used in confluence with confirmation or contrarian signals.
## Dashboard Elements [#dashboard-elements]
### Optimal Sensitivity [#optimal-sensitivity]

The optimal sensitivity is an estimate of the optimal **sensitivity** setting. Depending on the selected signal mode, the recommended sensitivity for confirmation or contrarian signals will be displayed. When **None** is selected, no optimal sensitivity will be displayed. This value is obtained through grid search optimization by using the most recent 250 bars and varies in a range between 10 and 20.
The cell color is based on the signal returned by the signal algorithm using the returned optimal setting, with a green color indicating a bullish signal and a red color indicating a bearish signal.
Note that this metric is not indicative of future results.
When **Autopilot Sensitivity** is enabled, the recommended sensitivity will not appear on the dashboard and is replaced with an indication notifying the user that autopilot is enabled.

### Trend Strength [#trend-strength]

The trend strength quantifies the strength of an underlying trend as a percentage and can inform the trader whether the market is trending or ranging. This indication can help a trader know whether a signal has a higher chance of being false or not. The 🔥 sign is used with trending markets while ❄️ is used for ranging markets.
The cell color is based on the currently displayed signal, with a green color indicating a bullish signal and a red color indicating a sell signal.
A trend strength plot is available allowing users to set alerts based on it, using placeholders `{{plot("Trend Strength"}}` in the alert message.
A percentage superior to 50% would indicate a trending market, while inferior percentages would indicate a ranging market.
### Lux Volatility [#lux-volatility]
The Lux volatility appearing on the dashboard is based on the **Lux Volatility** indicator and returns either **Stable** during periods of low volatility or **Volatile** during periods of high volatility. When volatility is rising the 📈 sign will appear, while 📉 appears when volatility is declining.
The Lux volatility can also display with a warning sign, this happens when the volatility is either too low or too high and indicates extra precaution.
### Squeeze [#squeeze]
Squeeze is a measure of price compression. Higher values of this metric indicate that the market is being compressed into a tighter area, suggesting market prices are subject to damping.

Higher values of this metric are mostly returned during ranging markets.
### Volume Sentiment [#volume-sentiment]
The volume sentiment metric returns an estimate of whether most volume came from buying or selling participants. This measure is expressed as a percentage in the range \[-100 / 100].

The value of this metric can sometimes be high or low even if a candle does not reflect this sentiment, thus potentially indicating a reversal.
## Dashboard Settings [#dashboard-settings]
Enabling/disabling the dashboard can be done from the **Indicator Overlay** section. Settings affecting the dashboard visual style can be found in the **Advanced Settings** section.
### Dashboard Location [#dashboard-location]
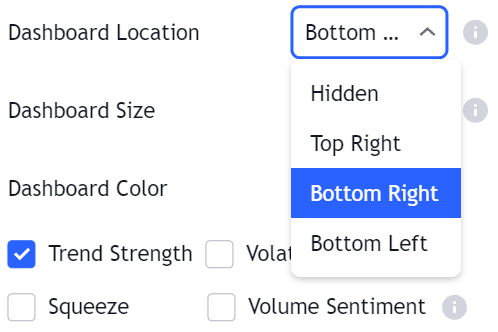
Determines the corner where the dashboard is displayed on the chart. Selecting "Hidden" will hide the dashboard.
### Dashboard Size [#dashboard-size]
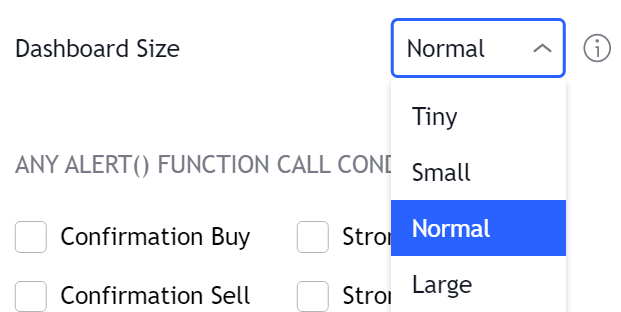
Determines the size of the dashboard on the chart, options include **Tiny**, **Small**, **Normal**, and **Large**.
# Indicator Overlay (/docs/algos/signals-overlays/indicator-overlay)
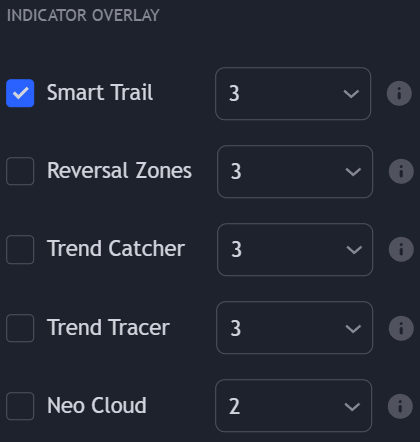
Signals & Overlays® Indicator allows the user to display various technical indicators directly on their chart. These can be used in confluence with the confirmation/contrarian signals or optionally used as a standalone.
Each overlay has an associated setting affecting its output. These settings range from 1 to 5, with higher values allowing the overlay to return indications for longer-term trends.
All overlays use a default sensitivity of 3 except the Neo Cloud which uses a sensitivity of 2.
## Smart Trail [#smart-trail]
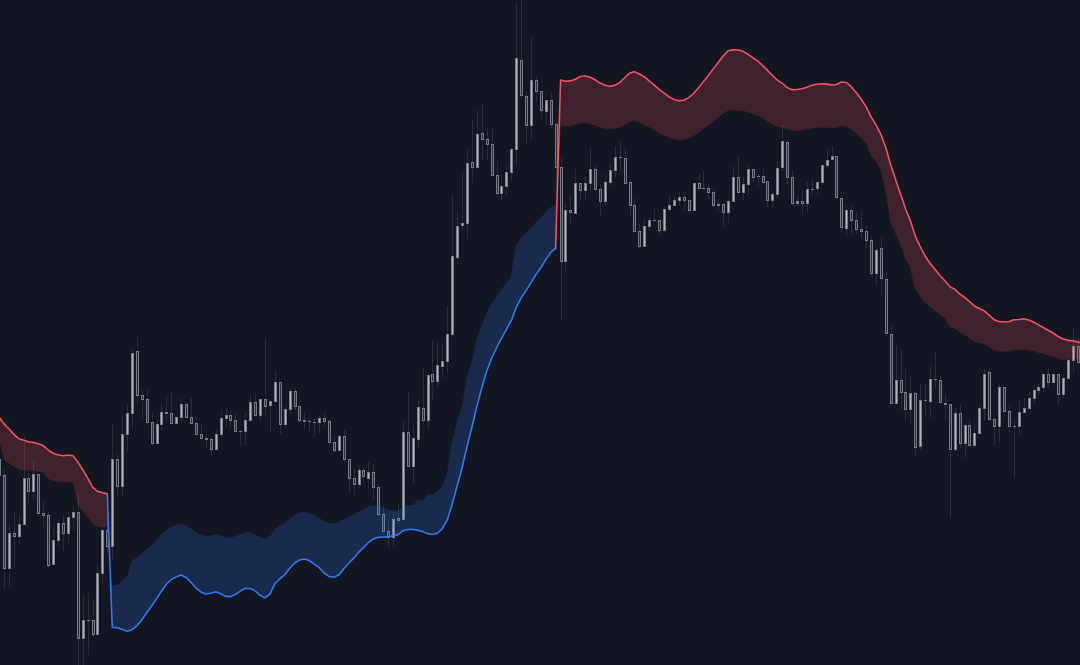
The Smart Trail is a trailing stop that diverges from the price in the presence of unwanted price variations in a trend.
An up-trend is indicated when the price is above the trailing stop, and a down-trend when the price is below the trailing stop.
The Smart Trail also displays support (in blue) and resistance (in red) areas and aims to indicate when the price might reverse when entering the area.
## Reversal Zones [#reversal-zones]
When enabled, one upper and one lower zone will be displayed on your chart, each zone is designed to help the user find tops and bottoms whether the market is ranging or trending (however the indicator will still be more effective during ranging markets).
These zones can be great areas to take profit or find early entries to use alongside the confirmation or contrarian signals.
During periods of increased volatility, the price may move outside the zones, you can wait for the price to go back within each zone to take a decision.
## Trend Tracer [#trend-tracer]
The Trend Tracer is a trend-following algorithm that aims to estimate the underlying trend in the price. When the indicator indicates an uptrend its color will be blue, while orange in the case of a downtrend.
The Trend Tracer can be used as a trailing support/resistance tool, you can also use it in confluence with the confirmation signals, either by waiting for the price to reach the trend tracer in order to enter a trade corresponding to the current confirmation signal or by filtering shorter-term signals by only trading those in accordance by the trend estimated by the trend tracer.
## Trend Catcher [#trend-catcher]
The Trend Catcher is a similar algorithm to the previous **Trend Tracer**, however, it aims to detect very early trends, and is thus more reactive.
Like with the **Trend Tracer**, the color of the indicator determines the detected trend.
## Neo Cloud [#neo-cloud]
When enabled, a simple cloud-like indicator will be displayed on your chart. The Neo Cloud is similar in effect to the Ichimoku Cloud, and can determine the current trend direction.
The cloud is filled with a gradient color showing how new a detected trend is, with brighter colors indicating older trends.
This cloud can provide a support when an uptrend is detected or resistance when a downtrend is detected. This makes it perfect for entries into precise trades.
# Introduction (/docs/algos/signals-overlays/introduction)
**Signals & Overlays®** is the most popular toolkit provided by LuxAlgo which contains a variety of signal modes, indicator overlays, and advanced dynamic features to help users make improved decisions when trading.
This toolkit is great for beginners & serious traders alike who want the most powerful signals & dynamic features possible for their charts.
Provided below are pages describing all features included.
## Alerts [#alerts]
Most features included within the Signals & Overlays® toolkit include built-in alerts.
Users can also utilize the "any alert() function call" conditions at the bottom of the settings to be alerted for multiple conditions at once. Further, the Signals & Overlays® toolkit allows users to set extremely complex alerts with its “Custom Alert Creator” feature at the bottom of the settings menu.
## Settings Reference [#settings-reference]
Signals & Overlays® includes various settings affecting the appearance and behavior of the toolkit, most of which are specific to the feature they affect.
Users can access the list of user settings and their descriptions in the following page:
Users can access the list of user settings and their descriptions in the following page:
# Settings Reference (/docs/algos/signals-overlays/settings)
To open the settings menu, place your mouse pointer over the indicator title on your chart, you will then see a list of icons appear, and click on the gear ⚙️ icon.
You can also open the settings panel by double-clicking any element displayed by the toolkit.
## Basic Settings [#basic-settings]
***
### Presets / Filters [#presets--filters]
No presets/filter enabled.
* Confirmation Signals
* Smart Trail
* Trend Catcher
* Confirmation Signals
* Confirmation gradient coloring
* Reversal Zones
* Take Profit/Stop Losses
* Confirmation Signals
* Long-Term Frequency Autopilot
* Simple confirmation candle coloring
* Neo Cloud
* Contrarian Signals
* Mid-Term Frequency Autopilot
* Contrarian candle coloring
* Reversal Zones
Show bullish signals when price is above the Smart Trail, and bearish signals when price is under the Smart Trail.
Show bullish signals when Trend Tracer is indicating an up-trend, and bearish signals when Trend Tracer is indicating a down-trend.
Show bullish signals when Trend Catcher is indicating an up-trend, and bearish signals when Trend Catcher is indicating a down-trend.
Show bullish signals above Neo cloud, and bearish signals under Neo Cloud.
Show bullish/bearish signals when the Trend strength is above 50%.
Presets allows users to easily enable multiple features at once from a selected option.
Note that when a preset is selected some settings such as the toggles of the displayed overlay indicators can become inactive/not usable. If you wish to further customize the Signals & Overlays® toolkit, we suggest disabling the Preset and manually customizing the settings.
On the other hand, filters allow users to display confirmation/contrarian signals when a specific overlay or metric behavior is respected.
### Signal Mode [#signal-mode]
Confirmation signals alongside exit signals.
Contrarian signals alongside exit signals.
No signals.
Controls the type of signal generation algorithm to use.
### ML Signal Classifier [#ml-signal-classifier]
Enable the ML Classifier for the returned signals. Signals will be classified between groups 1, 2, 3, and 4, with 1/2 indicating replacements and 3/4 signals in accordance with a main trend.
### Signals Sensitivity [#signals-sensitivity]
The sensitivity setting controls how sensitive the signals generation algorithms are to shorter term price variations, with higher values of the setting returning longer term signals.
To learn more about signal settings see the following [page](/docs/algos/signals-overlays/settings).
### Candle Coloring [#candle-coloring]
Color candles using three shades based on the Confirmation signal algorithm.
Color candles using a gradient based on the Confirmation signal algorithm.
Color candles using a gradient based on the Contrarian signal algorithm.
Change the color of the candle/bars on the user chart based on the selected option.
To learn more about candle coloring see the following [page](/docs/algos/signals-overlays/candle-coloring).
## Indicator Overlay [#indicator-overlay]
***
### Smart Trail [#smart-trail]
Enable the Smart Trail overlay on the chart when toggled on.
Smart Trail numerical period. Greater values will allow the Smart Trail to return indications of longer term trends.
### Reversal Zones [#reversal-zones]
Enable the Reversal Zones overlay on the chart when toggled on.
Reversal Zones numerical period. Greater values will allow the Reversal Zones to return indications of longer term trends.
### Trend Catcher [#trend-catcher]
Enable the Trend Catcher overlay on the chart when toggled on.
Trend Catcher numerical period. Greater values will allow the Trend Catcher to return indications of longer term trends.
### Trend Tracer [#trend-tracer]
Enable the Trend Tracer overlay on the chart when toggled on.
Trend Tracer numerical period. Greater values will allow the Trend Tracer to return indications of longer term trends.
### Neo Cloud [#neo-cloud]
Enable the Neo Cloud overlay on the chart when toggled on.
Neo Cloud numerical period. Greater values will allow the Neo Cloud to return indications of longer term trends.
## Take Profits/Stop Losses [#take-profitsstop-losses]
***
### TP/SL Levels [#tpsl-levels]
No take profits/stop losses levels are displayed.
Return take profits/stop losses levels based on Confirmation/Contrarian signals.
Return take profits/stop losses levels based on Smart Trail sentiment changes.
Return take profits/stop losses levels based on the contact between the price and Reversal Zones extremities.
Return take profits/stop losses levels based on the Trend Catcher sentiment changes.
Return take profits/stop losses levels based on the Trend Tracer sentiment changes.
Return take profits/stop losses levels based on the Neo Cloud sentiment changes.
Return take profits/stop losses levels based on the user set custom alert creator condition triggering. Unlike other options this one assumes a bullish sentiment, returning take profits above the price and stop losses below the price.
### Distance [#distance]
Control how far away take profits/stop losses levels are located from the price, with higher values returning levels located farther away from the price.
## Advanced Settings [#advanced-settings]
***
### ML Classifier [#ml-classifier]
ML Classifier filter. This input allows filtering out classified signals that are not specified in the input.
For example if the input only contains `12` then only signals classified as either 1 or 2 will be displayed.
### Autopilot Sensitivity [#autopilot-sensitivity]
Disable the autopilot sensitivity algorithm.
Enable the autopilot sensitivity algorithm to return shorter term signals.
Enable the autopilot sensitivity algorithm to return medium term signals.
Enable the autopilot sensitivity algorithm to return longer term signals.
Allows enabling autopilot sensitivity for the selected signal algorithm. When autopilot is enabled changes in the `sensitivity` settings will not affect signals.
## Dashboard [#dashboard]
***
### Dashboard Location [#dashboard-location]
Hide the dashboard on the chart.
Display the dashboard to the top right of the chart.
Display the dashboard to the bottom right of the chart.
Display the dashboard to the bottom left of the chart.
Dashboard location on the chart.
### Dashboard Size [#dashboard-size]
Size of the dashboard on the chart.
### Trend Strength [#trend-strength]
Display Trend Strength metric on the dashboard.
### Volatility [#volatility]
Display the Lux Volatility metric on the dashboard.
### Squeeze [#squeeze]
Display the squeeze index on the dashboard.
### Volume Sentiment [#volume-sentiment]
Display the Volume Sentiment on the dashboard.
## Custom Alert Creator [#custom-alert-creator]
***
### Signal [#signal]
Enable the selected signal condition to be used in the custom alert creator.
Specific type of signal used in the custom alert creator.
#### Step [#step]
Signal condition step in the custom alert creator sequence.
### ML Classifier [#ml-classifier-1]
Enable the ML Classifier to be used in the custom alert creator.
Determines to which group a signal should be classified.
#### Step [#step-1]
ML Classifier step in the custom alert creator sequence.
### Smart Trail [#smart-trail-1]
Enable the selected Smart Trail condition to be used in the custom alert creator.
Specific Smart Trail condition used in the custom alert creator.
#### Step [#step-2]
Smart Trail condition step in the custom alert creator sequence.
***
### Trend Tracer [#trend-tracer-1]
Enable the selected Trend Tracer condition to be used in the custom alert creator.
Specific Trend Tracer condition used in the custom alert creator.
#### Step [#step-3]
Trend Tracer condition step in the custom alert creator sequence.
***
### Trend Catcher [#trend-catcher-1]
Enable the selected Trend Catcher condition to be used in the custom alert creator.
Specific Trend Catcher condition used in the custom alert creator.
#### Step [#step-4]
Trend Catcher condition step in the custom alert creator sequence.
***
### Neo Cloud [#neo-cloud-1]
Enable the selected Neo Cloud condition to be used in the custom alert creator.
Specific Neo Cloud condition used in the custom alert creator.
#### Step [#step-5]
Neo Cloud condition step in the custom alert creator sequence.
### Reversal Zones [#reversal-zones-1]
Enable the selected Reversal Zones condition to be used in the custom alert creator.
Specific Reversal Zones condition used in the custom alert creator.
#### Step [#step-6]
Reversal Zones condition step in the custom alert creator sequence.
### Trend Strength [#trend-strength-1]
Enable the selected Trend Strength condition to be used in the custom alert creator.
Comparison operator used to compare the current Trend Strength value with the inline numerical input.
Value used to compare Trend Strength with.
#### Trend Strength Step [#trend-strength-step]
Trend Strength condition step in the custom alert creator sequence.
### External Condition (1) [#external-condition-1]
Enable the selected External condition to be used in the custom alert creator.
...
Other external indicator outputs can be used as source.
First source input.
Comparison operator used to compare the two selected sources.
...
Other external indicator outputs can be used as source.
Second source input.
#### External Step (1) [#external-step-1]
First external source condition step in the custom alert creator sequence.
### External Condition (2) [#external-condition-2]
Enable the selected External condition to be used in the custom alert creator.
...
Other external indicator outputs can be used as source.
First source input.
Comparison operator used to compare the two selected sources.
...
Other external indicator outputs can be used as source.
Second source input.
#### External Step (2) [#external-step-2]
Second external source condition step in the custom alert creator sequence.
### External Condition (3) [#external-condition-3]
Enable the selected External condition to be used in the custom alert creator.
...
Other external indicator outputs can be used as source.
Source input.
Comparison operator used to compare the selected source to the selected numerical value.
Numerical input.
#### External Step (3) [#external-step-3]
Third external source condition step in the custom alert creator sequence.
### Invalidation Behavior [#invalidation-behavior]
No invalidation behavior.
The "Invalidate On Step 1" behavior allows to reset an incomplete sequence of conditions when the condition on step 1 trigger. This prevents the first step condition from happening in between other steps of the condition sequence.
This behavior is useful when the first step of our sequence of conditions needs to never be repeated during the sequence.
Let's take an example where we use 3 regular steps.
Step 1 condition trigger, we will now evaluate step 2 from now on.
Step 2 condition trigger, we will now evaluate step 3 from now on.
Step 1 condition trigger, we start evaluating step 2 from now.
The "Invalidate On Any Repeated Step" behavior allows to reset an incomplete sequence of conditions when a step is triggered such that it does not respect the user-set order of conditions.
This behavior is useful when we want a perfectly ordered sequence of conditions to complete, without any step repeating itself.
Let's take an example where we use 3 regular steps.
Step 1 condition trigger, we will now evaluate step 2 from now on.
Step 2 condition trigger, we will now evaluate step 3 from now on.
Step 1 or 2 conditions trigger, we start evaluating step 1 from now.
Invalidation behaviors allows adding more restrictions to a sequence of conditions, users can use two different invalidation behaviors described below.
### Maximum Step Interval [#maximum-step-interval]
Maximum allowed horizontal distance (in bars) between two steps.
If the amount of bars since a step exceed the selected threshold, then the conditions sequence is reset, and we start evaluating from step 1 again.
### Highlight Custom Alert Triggers [#highlight-custom-alert-triggers]
When a custom alert condition is set, a visual element is displayed at the bottom of the chart in order to more easily visualize when the custom alert conditions occurs (displayed by default).
# Signal Settings (/docs/algos/signals-overlays/signal-settings)
The settings affecting the signal generation algorithm within Signals & overlays plays an important role in using the signals effectively. We give our users the possibility to adjust the settings so that the signals can fit their trading style but we also provide ways to easily adjust settings by using a wide variety of methods.
Each method for adjusting signal settings is designed to fit specific user needs, one method will not necessarily be more accurate than another.
It's critical to understand Confirmation Signals are generally meant to be used as trend confirmations, not direct entries & exits. Focusing on ease of use with the signal settings & using other features within our toolkits will likely be the best decision for you rather than trying to find the "holy grail" of optimized signal settings & following the signals alone.
## Manual Adjustments [#manual-adjustments]
Manual adjustment of signals settings allow the user to fit the signals to their trading style and allows a greater degree of customizability.
### Confirmation Signals [#confirmation-signals]
Confirmation signals are affected by the **Signals Sensitivity** setting. Increasing this setting will allow the trader to make decisions for longer-term trends.
### Method For Manually Adjusting Confirmation Signals [#method-for-manually-adjusting-confirmation-signals]
First, identify which price movements you are looking to trade (regardless of timeframes). Depending on how you are on your charts (on any timeframe) you can adjust the sensitivity value higher or lower to catch the price movements you are looking for. If you are looking for shorter term price movements on those timeframes, you should consider using a lower sensitivity. If you are looking for longer term price movements on those timeframes you should consider using a higher sensitivity.
### Contrarian Signals [#contrarian-signals]
Contrarian signals are also affected by the **Signals Sensitivity** setting, increasing it will aim to make contrarian signals spot longer term tops and bottoms.
## Automatic Settings Estimation [#automatic-settings-estimation]
### Autopilot Signal Settings [#autopilot-signal-settings]
The downside of adjusting signal settings is that this task needs to be constantly repeated due to ever-changing market conditions. **Autopilot** is a feature that allows the user to avoid adjusting signal settings completely. Instead, the currently selected signal generation algorithm (Confirmation or Contrarian) adjusts dynamically to the market conditions in order to provide the best signals possible.
This setting can be enabled from the **Advanced Settings** settings section.
Compared to other automatic methods the "Autopilot" feature is the most user-friendly since it avoids adjusting inputs within the indicator entirely.
[](/images/lux-algo/signal-settings/autopilotfreq.png)
The **Autopilot Sensitivity** advanced setting allows autopilot to adjust to shorter or longer term trends depending on user preference.
### Dashboard Optimal Sensitivity [#dashboard-optimal-sensitivity]
The Optimal Sensitivity is a value displayed on the Lux Dashboard showing the optimal **Sensitivity** setting when using Confirmation or Contrarian signal modes. This optimization is based on a grid search algorithm and as such will backtest every generated signals using a sensitivity ranging from 10 to 20 over the most recent 250 bars.
This feature works on any ticker & timeframe as long as at least 250 bars of historical data are available.
## Choosing The Right Method [#choosing-the-right-method]
While the optimal sensitivity provided by the dashboard is the most precise method since it's performing grid search, there is no "best" method for optimizing signals as it's up to the user to understand their style of trading and the price variations they want to trade (regardless of timeframes).
### Manual Adjustments [#manual-adjustments-1]
Do you specifically want to trade **shorter**-term trends on the timeframes you use?
* Consider using lower sensitivity values such as 5-10
Do you specifically want to trade **longer**-term trends on the timeframes you use?
* Consider using higher sensitivity values such as 20+
Alternatively, you can use the default of 12 for trading medium-term trends. This provides simple and responsive signals.
### Automatic Adjustments [#automatic-adjustments]
Do you rely a lot on optimizing signals and are you ok with updating these manually over time?
* Use the Optimal Sensitivity provided by the dashboard to find more precise signal settings.
Do you completely dislike the process of adjusting signal settings altogether?
* Use the Autopilot sensitivity to allow the signals to adjust dynamically and work without the need of any user interaction.
Using Autopilot or the default settings are overall the simplest user experience as it allows you to completely avoid adjusting settings altogether.
# Signal Modes (/docs/algos/signals-overlays/signals)
The Signals & Overlays® toolkit displays signals that can indicate the current trend direction in the price and aim to support the analysis of a trader. There are two main signal modes available, each one fitting a different trading style, **Confirmation** signals, and **Contrarian** signals. The following sections on this page describe these two methodologies in detail.
Focusing on using other features within our toolkit alongside the provided signals will likely be the best decision for you rather than using them alone.
## Confirmation + Exits [#confirmation--exits]
Confirmation signals are based on a performance adaptive trend following methodology. As the name suggests, they aim to confirm any potential action a trader might take and are more effective when used in confluence with other features like our indicator overlays.
There are two types of Confirmation signals, **normal** signals, and **strong (+)** signals. Strong (+) signals are signals that are in accordance with the current estimated trend, while normal signals can be caused by a retracement.
The Confirmation signals mode includes exit signals (represented by colored crosses). A bullish exit signal is displayed as a blue cross, while a bearish exit is displayed as an orange cross.
These exits signals aim to help traders find areas to consider exiting a position based on a previous confirmation signal at the highest price possible. Also, note that these exits would always exit a previous confirmation signal on a win.
Successive exit signals can occur during longer-term trends, as such the user can do partial exits instead of exiting an entire position. These exit signals can also be used within a user's analysis as potential reversal points, as such they do not necessarily have to be used as take profits using the Signals & Overlays toolkit.
## Contrarian + Exits [#contrarian--exits]
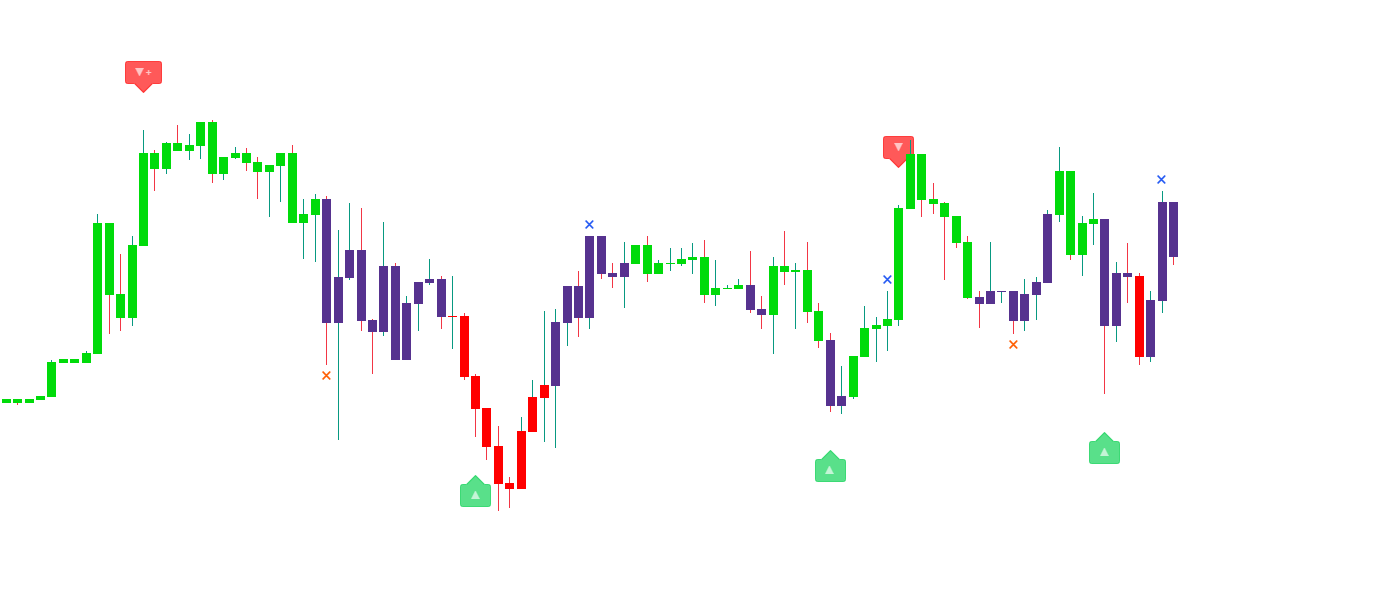
Contrarian signals by design go in opposition to the current trend and aim to deliver extremely fast decision timing. More simply put, Contrarian signals aim to spot potential tops and bottoms.
The advantage of Contrarian methodologies is that they are less subject to lag than most trend-following methodologies, thus allowing for potentially higher profits, however, it is important to note that going against the trend exposes a trader to larger price variations, which means potentially **higher losses**.
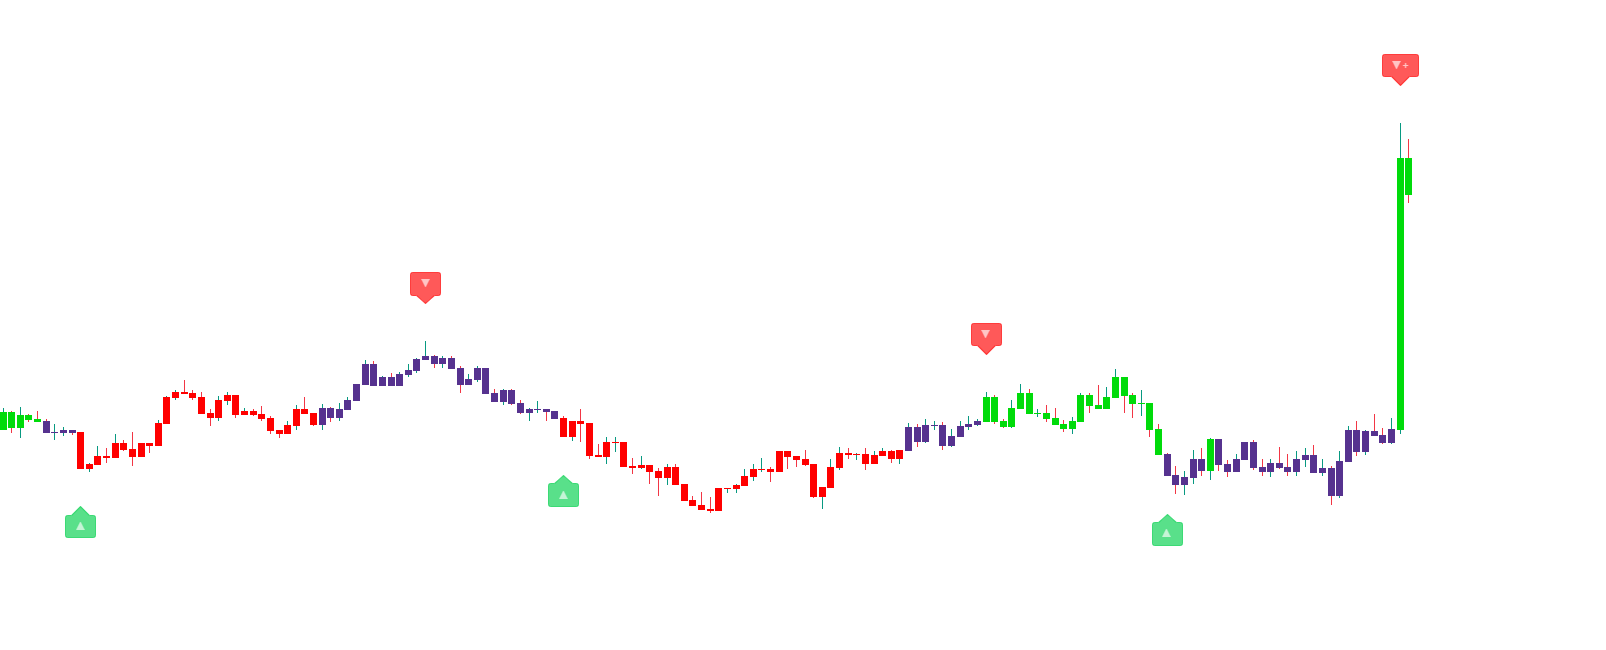
Like Confirmation signals, some Contrarian signals can also be labeled as **strong (+)**. These strong signals occur when the price is excessively overbought or oversold and can have more of a chance of indicating a potential reversal.
Extra confluence such as declining volume or the occurrence of the signal near a significant support/resistance can be useful to tell when a signal is indicative of a reversal.
You can also use the Contrarian signals more safely as an alternative exit point for a position. Timing tops/bottoms is very challenging, however, these can be useful for the natural reversal trader in combination with other features within the Signals & Overlays toolkit.
The Contrarian signals mode also includes exit signals. A bullish exit signal is displayed as a blue cross, while a bearish exit is displayed as an orange cross.
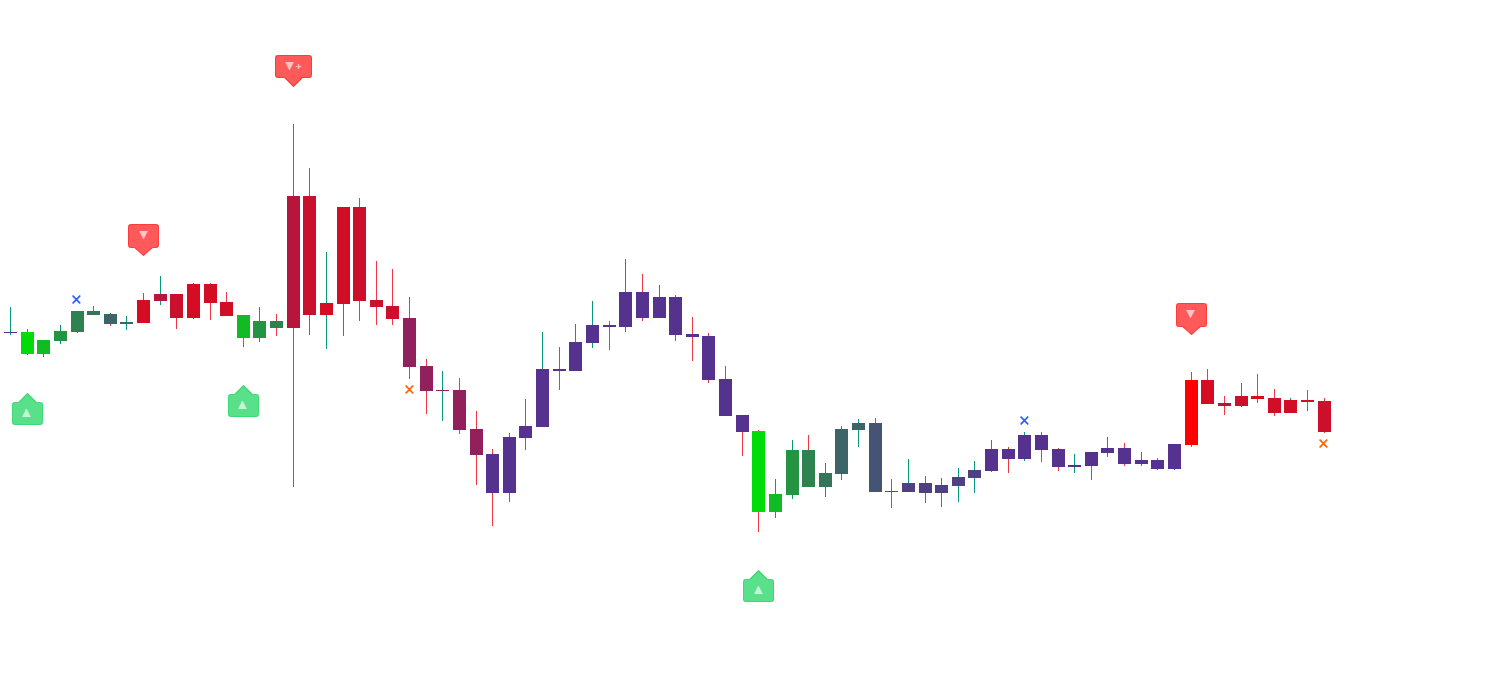
Like Confirmation signals, Contrarian exit signals would always exit a previous confirmation signal on a win. Do note that successive exits will not occur for Contrarian signals.
Contrarian Exits can be particularly useful for when price temporarily moves in accordance with a displayed Contrarian signal before reversing, rendering the signal as false for a larger trend reversal.
If the user is confident that a larger reversal might still occur in accordance with a previously displayed Contrarian signal, the exit can be ignored or could lead to a partial exit only for a "scalp" trade.
## ML Classifier [#ml-classifier]
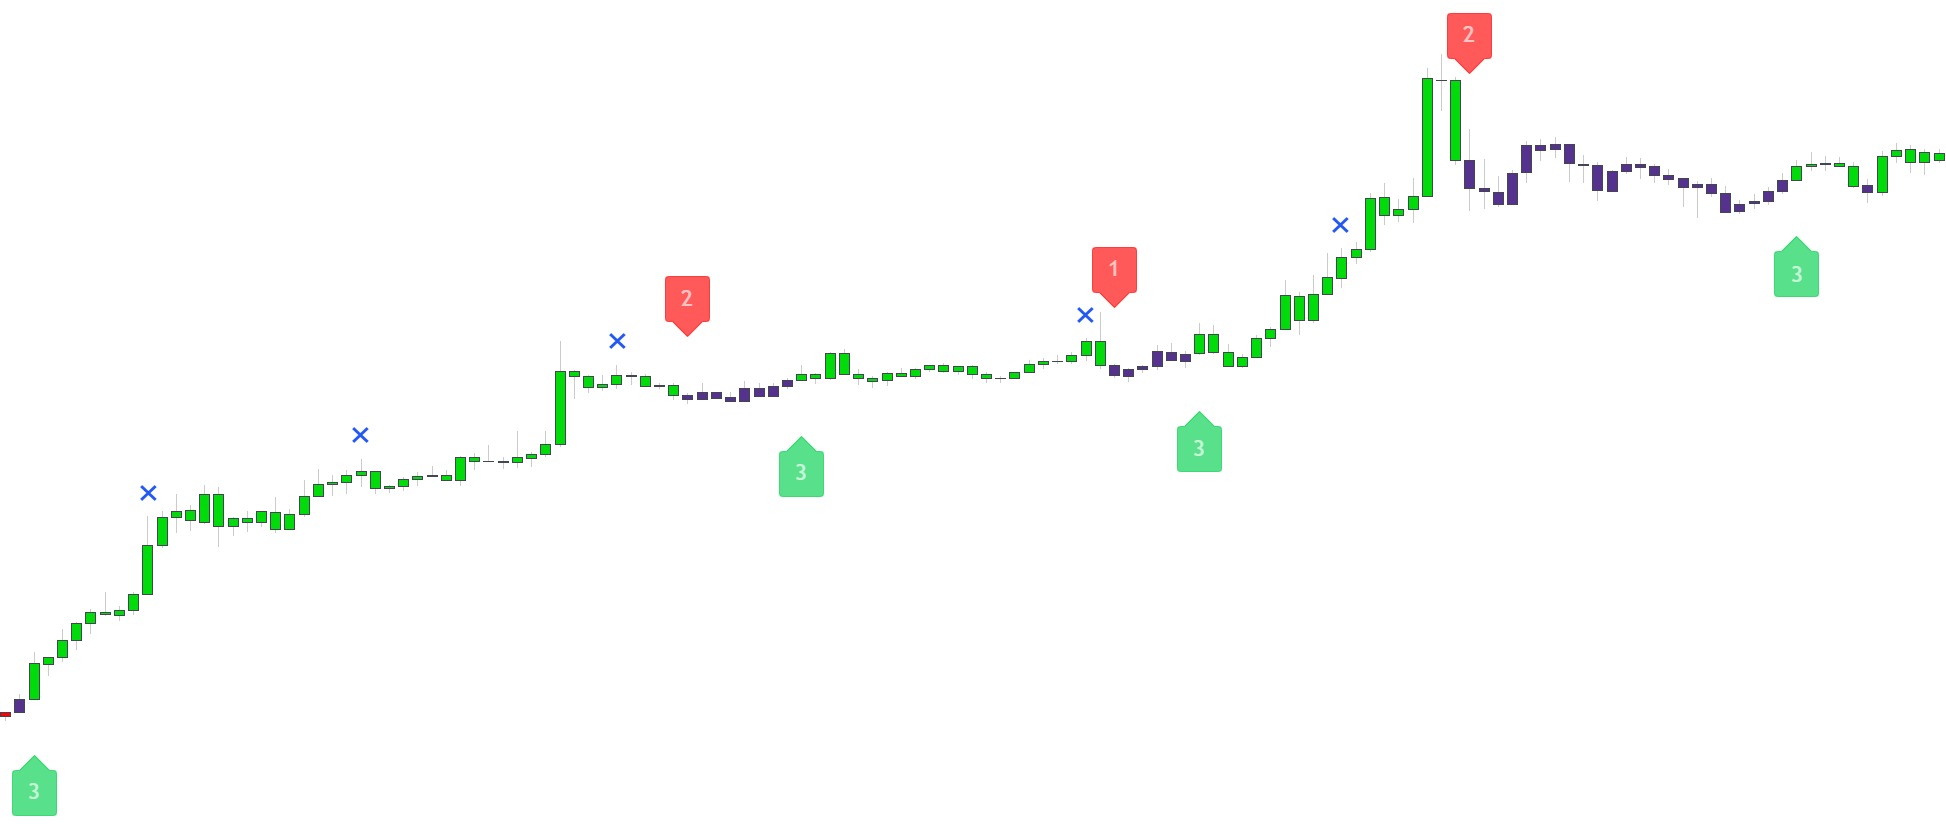
For users who want a deeper interpretation of signals, an adaptive threshold classifier is built-in to optionally enable at the top of the settings menu that automatically classifies both Confirmation & Contrarian signals between a range of 1 to 4 directly on the signal labels.
The displayed number indicates a degree of strength to your signals & can give user a deeper interpretation rather than just showing the base layer of normal vs strong. Do note the base layer of detecting normal vs strong trends is still displayed within the Confirmation Simple candle coloring mode which is on by default.
For Confirmation signals, lower-numbered signals (1-2) can be indicative of a potential reversal or retracement, while higher-numbered signals (3-4) can be more indicative of a trend continuation.
For Contrarian signals lower numbered signals can be indicative of an early trend with a lower chance of a larger reversal. Whereas higher numbers (3-4) will tend to occur on more developed trends, with a higher chance of larger trend reversal.
### ML Classifier Filter [#ml-classifier-filter]
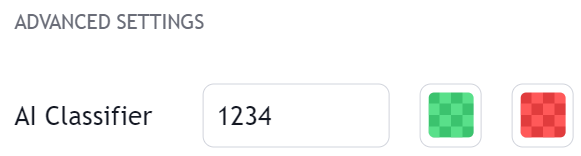
Users can take their analysis even deeper by filtering out specific numbered signals from the advanced settings by entering the numbers that should stay on the chart. By default it shows "1234" as this would show all signals with the ML Classifier.
As an example, users could type into this box "12" to only display 1's and 2's on their chart. The same with "134" to only display 1's, 3's, and 4's on their chart depending on their preference for filtering specific signals.
## Display [#display]
It is possible to choose what type of signals you want to display here as well as displaying no signals at all, this is done from the settings menu in the **Signal Mode** drop-down menu.
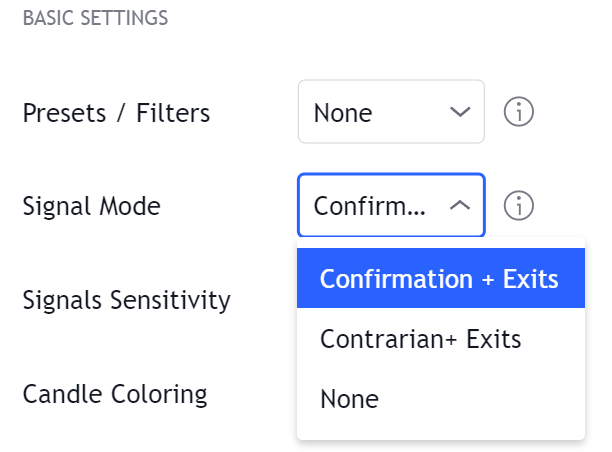
By default, **Confirmation + Exits** is selected. **None** will not display any signal on the chart.
Signals are confirmed at the opening of the next candle, if you see a signal displayed on the most recent candle remember that it might be subject to change.
*CFTC Rule 4.41 - Hypothetical or Simulated performance results have certain limitations, unlike an actual performance record, simulated results do not represent actual trading. Also, since the trades have not been executed, the results may have under-or-over compensated for the impact, if any, of certain market factors, such as lack of liquidity. Simulated trading programs in general are also subject to the fact that they are designed with the benefit of hindsight. No representation is being made that any account will or is likely to achieve profit or losses similar to those shown.*
# TP/SL Points (/docs/algos/signals-overlays/tp-sl-points)
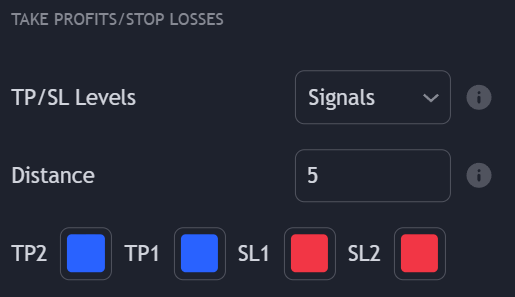
The TP/SL feature displays 4 take profits/stop losses levels and aims to help the user set stop losses and take profits by estimating points of potential support/resistance from an initial user-selected condition.
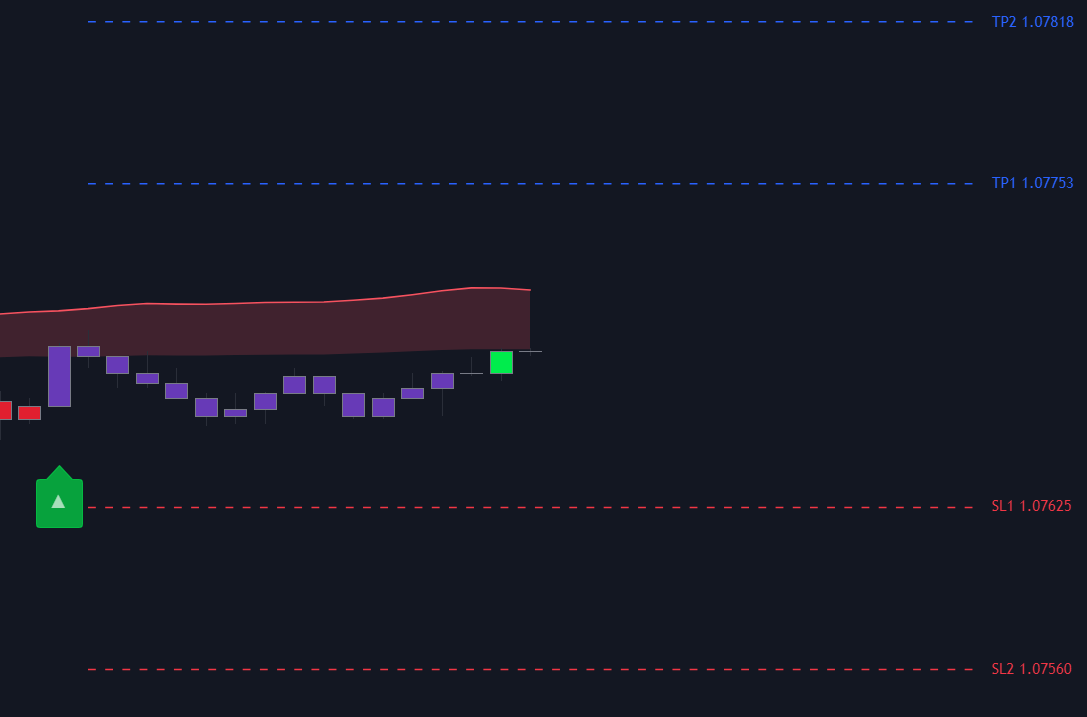
Take-profits/stop-loss levels are based on the option selected in the "TP/SL Levels" dropdown menu. Options include the following:
| Option | Description |
| ---------------------- | --------------------------------------------------------------------------------------------------------------------------------------------------------------------------------------------------------------------------------------------------------------------------- |
| `Signals` | Will calculate new take-profits/stop-losses when a new Confirmation or Contrarian signal is detected. If the signal is bullish, take profits will be located above the price and stop losses below; if bearish, the opposite applies. |
| `Smart Trail` | Will calculate new take-profits/stop-losses when the Smart Trail turns bullish or bearish. If it turns bullish, take profits will be located above the price and stop losses below; if bearish, the opposite applies. |
| `Reversal Zones` | Will calculate new take-profits/stop-losses when the price reaches the Reversal Zones outer bands. If the price goes below the bottom zone, take profits will be located below the price and stop losses above; if the price goes above the top zone, the opposite applies. |
| `Trend Catcher` | Will calculate new take-profits/stop-losses when the Trend Catcher turns bullish or bearish. If it turns bullish, take profits will be located above the price and stop losses below; if bearish, the opposite applies. |
| `Trend Tracer` | Will calculate new take-profits/stop-losses when the Trend Tracer turns bullish or bearish. If it turns bullish, take profits will be located above the price and stop losses below; if bearish, the opposite applies. |
| `Neo Cloud` | Will calculate new take-profits/stop-losses when the Neo Cloud turns bullish or bearish. If it turns bullish, take profits will be located above the price and stop losses below; if bearish, the opposite applies. |
| `Custom Alert Creator` | Will calculate new take-profits/stop-losses when the user-set custom alert creator condition is true. |
When the price significantly deviates from the highest take profit or lowest stop loss, these will update, returning new relevant take profits and stop losses.
Users can notice when a tp/sl has updated based on where their levels start, if the levels start where the initial condition is located then it hasn't updated.
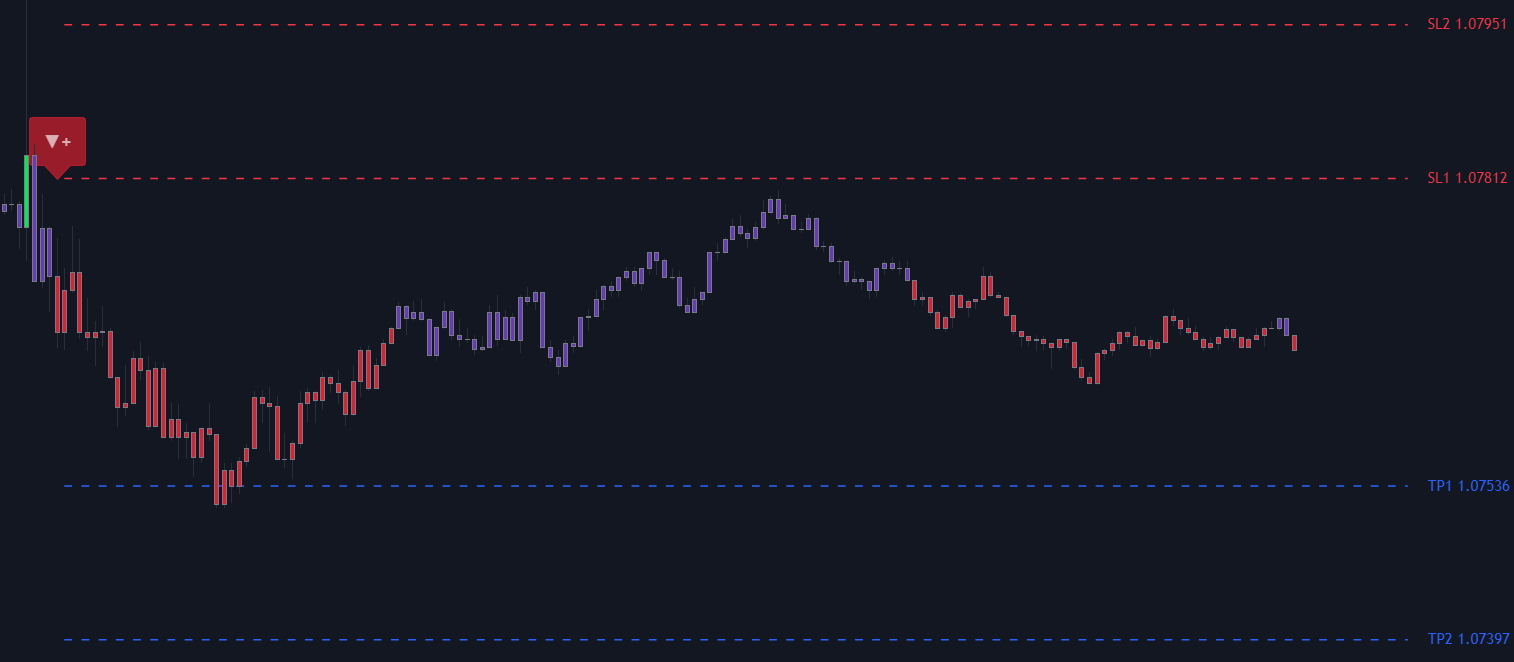
Users can control the distance between the price and the take profits/stop losses using the "Distance" setting, with higher values returning take profits/stop losses farther away from the price.
Make sure to adjust this setting according to the price variations you are trading. If you are trading large price variations, use a higher setting value.
### Alerts [#alerts]
Users can be alerted when the price reaches a take profit or stop loss level using the "Take Profit" and/or "Stop Loss" "any alert() function call" conditions. This alert triggers once per bar.
#### TP/SL Placeholders [#tpsl-placeholders]
Plots for accessing take profits and stop losses levels are available in order for users to set alerts based on them.
Use the placeholder `{{plot("Take Profit")}}` for accessing the nearest take profit value and `{{plot("Stop Loss")}}` for accessing the nearest stop loss value.
*CFTC Rule 4.41 - Hypothetical or Simulated performance results have certain limitations, unlike an actual performance record, simulated results do not represent actual trading. Also, since the trades have not been executed, the results may have under-or-over compensated for the impact, if any, of certain market factors, such as lack of liquidity. Simulated trading programs in general are also subject to the fact that they are designed with the benefit of hindsight. No representation is being made that any account will or is likely to achieve profit or losses similar to those shown.*
# Entry Rules (/docs/ai-backtesting/backtesters/osc/entry)
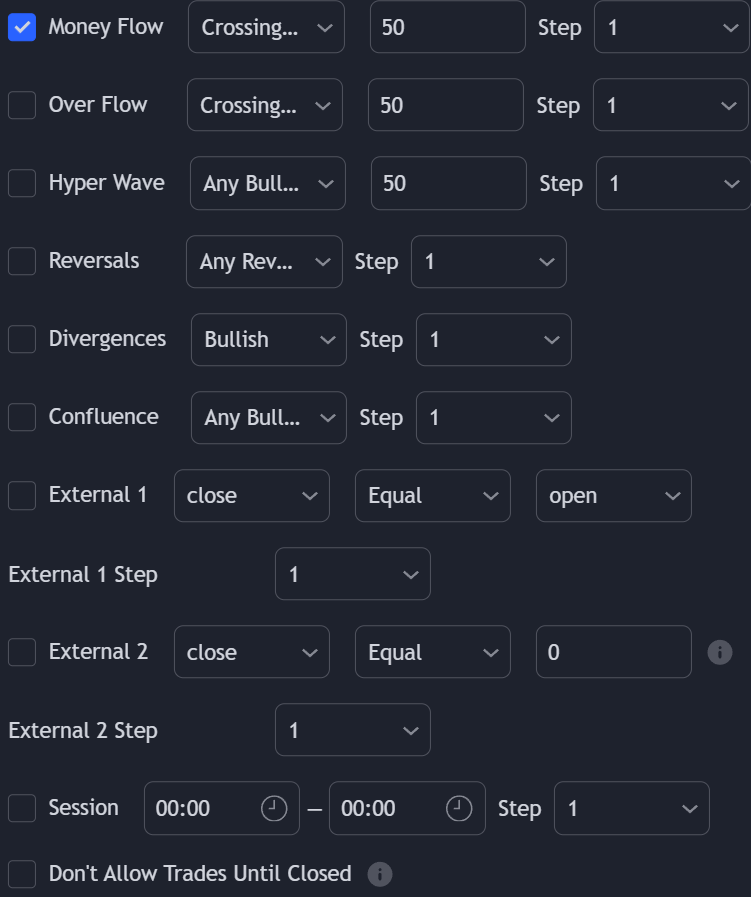
Backtester (OSC) allows users to set their own long/short entry rules from features of the Oscillator Matrix® as well as external indicators.
Entry rules can be created separately for both long and short entries, and can be set using up to 8 different user set conditions. Each can be enabled by toggling them on using the toggle input on the left of each condition, if the enabled conditions are valid, the strategy will open a corresponding market order.
## Oscillator Matrix® Conditions [#oscillator-matrix-conditions]
Conditions for 6 features of the Oscillator Matrix® are included. These include:
* Money Flow conditions
* OverFlow conditions
* HyperWave conditions
* Reversal conditions
* Divergences conditions
* Confluence conditions
The first dropdown determines the specific condition used for that feature, these can include generic conditional operators such as `Greater Than` or `Crossing`, or conditions proper to certain features such as `Any Bullish` in the HyperWave conditions.
The second input setting allows the user to enter a numerical values, which is used when `Greater Than`, `Lower Than`, `Equal`, `Crossing Over`, `Crossing Under`, or `Crossing` are used.
For example, if the user wants to go **Long** when the HyperWave oscillator crosses over 80, the following settings would be used:
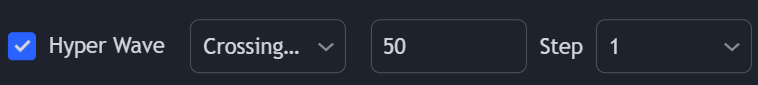
## External Conditions [#external-conditions]
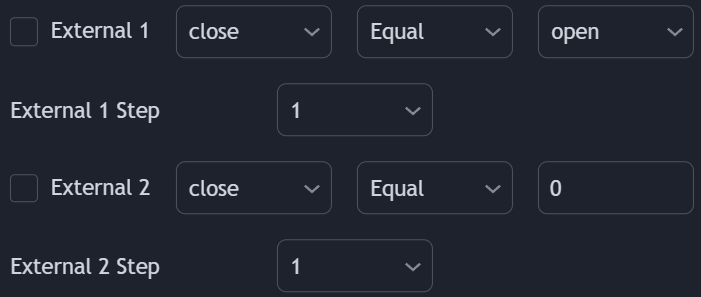
Users can use the output of external indicators on the chart as input to set entry conditions.
The second dropdown of external condition settings determines which conditional operator to use on both external outputs. These include:
* Greater Than
* Lower Than
* Equal
* Crossing Over
* Crossing Under
* Crossing
The third external condition works similarly, but instead of comparing two external outputs, the condition will compare an external output specified in the condition first dropdown with a user set value in the third dropdown using a conditional operator set on the second dropdown. This last condition is particularly useful for oscillators.
Here is an example of the third external condition being set for an RSI crossing over 50.
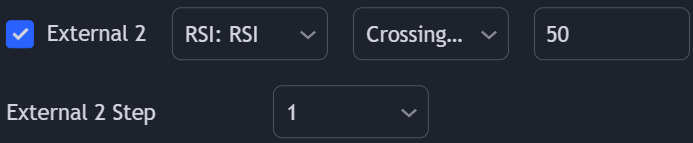
## Using Conditions Together [#using-conditions-together]
More complex entry rules can be created by using multiple conditions together, this is done thanks to the **Step** dropdown setting on the right of each condition (below each condition for conditions 4 and 5).
The *Step* setting is directly related to the Step & Match algorithm and work in two ways:
* When two or more conditions have the same step number, both conditions are evaluated. Used to test matching conditions.
* When two or more conditions have different step numbers, each conditions will be evaluated in order, testing for the first step and switching to the next step once the previous one is true. When the final step is true, the strategy will open a market order. Used to create a sequence of conditions.
This operation is complementary, as you can create a sequence of conditions with one step consisting of two or more matching conditions as long as they have the same step number.
A user wanting to go long when a bullish divergence occurs after any bullish reversal while money flow was bullish (over 50) could do it as follows:
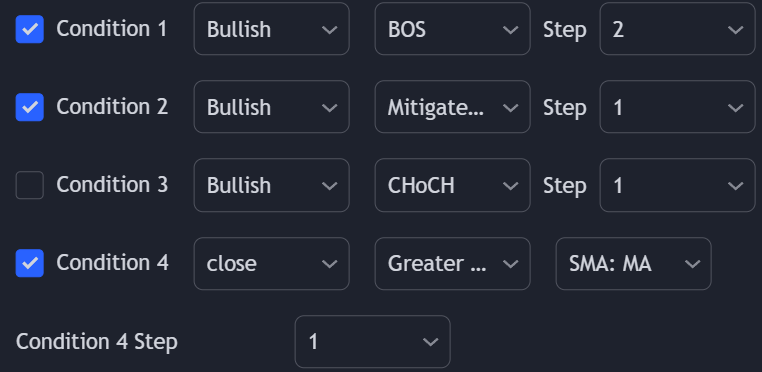
### Invalidate Step [#invalidate-step]
The "Invalidate" step allows setting a condition as an "invalidation condition". When this condition is triggered while a sequence of conditions is incomplete, the sequence will restart at step 1.
If multiple steps are set as "Invalidate" any of the conditions being true will reset the sequence of conditions, as such not all of them are required to be true for the sequence of conditions to reset.
Let's take an example where we use 2 regular steps and one "Invalidate" step. The position will be opened when step 2 trigger after step 1 has been triggered.
Step 1 condition trigger, we will now evaluate step 2 from now on.
Invalidation step condition trigger, we reset the sequence and evaluate step 1 just after.
### Invalidation Behaviors [#invalidation-behaviors]
Invalidation behaviors allow adding more restrictions to a sequence of conditions; users can use two different invalidation behaviors described below:
#### Invalidate On Step 1 [#invalidate-on-step-1]
The "Invalidate On Step 1" behavior allows resetting an incomplete sequence of conditions when the condition on step 1 triggers. This prevents the first step condition from happening in between other steps of the condition sequence.
This behavior is useful when the first step of our sequence of conditions needs to never be repeated during the sequence.
Let's take an example where we use 3 regular steps.
Step 1 condition trigger, we will now evaluate step 2 from now on.
Step 2 condition trigger, we will now evaluate step 3 from now on.
Step 1 condition trigger, we start evaluating step 2 from now.
#### Invalidate On Any Repeated Step [#invalidate-on-any-repeated-step]
The "Invalidate On Any Repeated Step" behavior allows to reset an incomplete sequence of conditions when a step is triggered such that it does not respect the set order of conditions.
This behavior is useful when we want a perfectly ordered sequence of conditions to complete, without any step repeating itself.
Let's take an example where we use 3 regular steps.
Step 1 condition trigger, we will now evaluate step 2 from now on.
Step 2 condition trigger, we will now evaluate step 3 from now on.
Step 1 or 2 conditions trigger, we start evaluating step 1 from now.
## Limit / Stop Orders [#limit--stop-orders]
Limit, stop, and stop-limit orders provide better control over the price at which a trade is executed.
These can be enabled for long and short positions respectively.
### Limit Orders [#limit-orders]
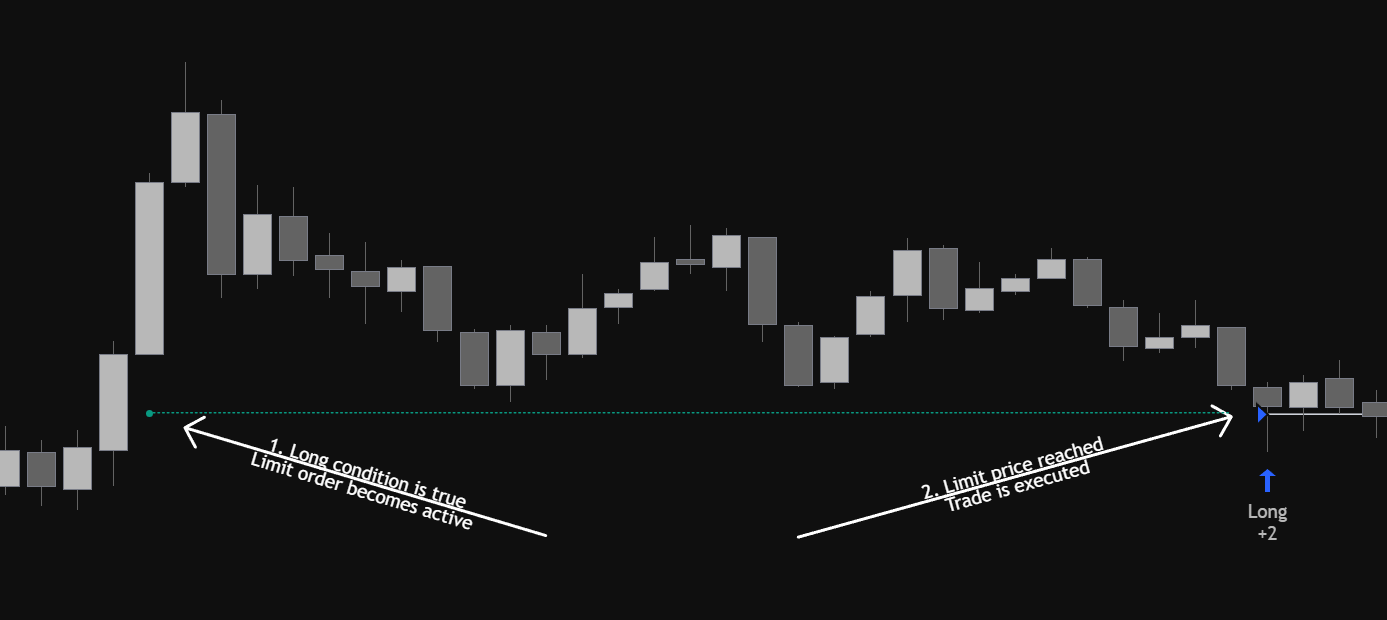
Limit orders execute at a specified price or better. For long positions, a limit order is generally placed below the current market price; for short positions, it is placed higher.
Limit orders can be enabled by toggling the "Long Limit Value" setting.
Limit orders are represented by a dotted line.
A dot is displayed to indicate when a long condition is true, thus updating the limit order price.
### Stop Orders [#stop-orders]
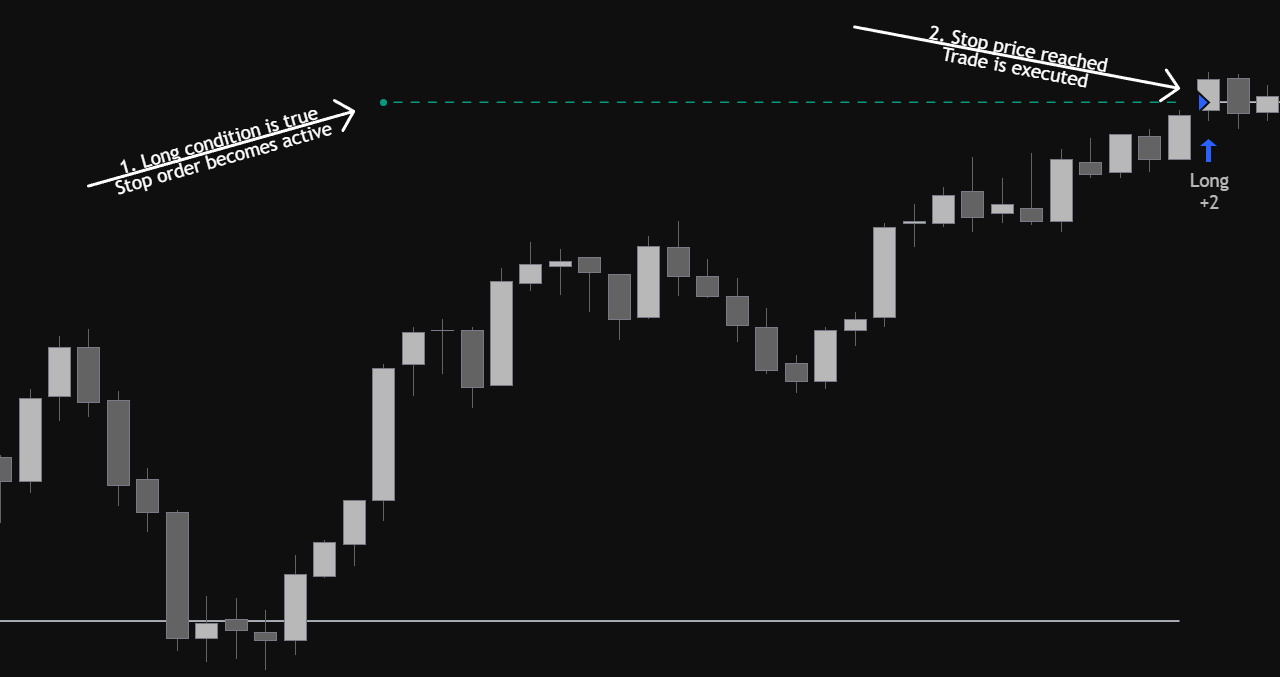
Stop orders execute at a specified price or worse. For long positions, a stop order is generally placed above the current market price; for short positions, it is placed lower.
Stop orders can be enabled by toggling the "Long Stop Value" setting.
Stop orders are represented by a dashed line.
A dot is displayed to indicate when a long condition is true, thus updating the stop order price.
### Stop-Limit Orders [#stop-limit-orders]
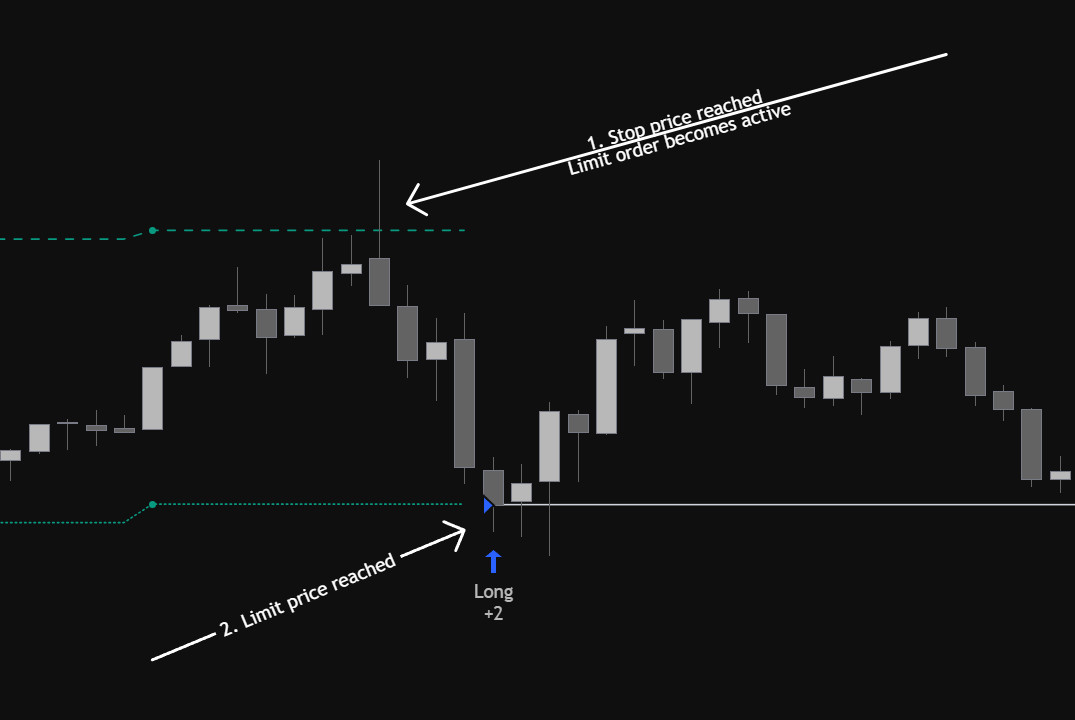
Stop-limit orders use both limit and stop orders together, providing more control over the price at which a trade is executed.
In a stop-limit order, when the specified stop price is reached, the limit order becomes active. Once this limit price is reached, the trade is executed.
### Limit / Stop Orders Price [#limit--stop-orders-price]
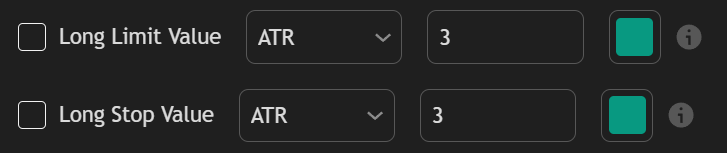
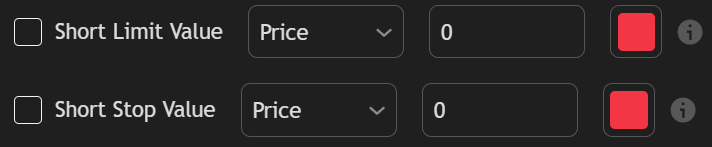
The price of limit and stop orders is specified in "Long Limit Value"/"Short Limit Value" and "Long Stop Value"/"Short Stop Value," respectively. These settings are located at the bottom of the Long/Short Conditions settings groups.
Similar to TP/SL, various options to determine the order price are available:
| Option | Description |
| :------: | :--------------------------------------------------------------------------------------------------------------------------------------------------------: |
| Price |
Set the limit/stop orders at the specified price.
|
| Currency |
Set the limit/stop orders a specified amount of currency away from where the entry condition is met.
|
| Ticks |
Set the limit/stop orders a specified amount of ticks away from where the entry condition is met.
|
| % |
Set the limit/stop orders a specified percentage away from where the entry condition is met.
|
| ATR |
Set the limit/stop orders *N* average true ranges away from where the entry condition is met, where *N* is a specified multiplier.
|
| Forecast |
Use a percentile of a returned forecast to the order price. Forecasts must be enabled in order for this to work.
|
For convenience, all options (except "Price") are adjusted based on the order type; for example, limit orders will be below the current price for longs and above for shorts, while stop orders will be above the price for longs and below for shorts. These can always be inverted using a negative value.
The price of a limit/stop order is updated every time the specified long/short condition is true.
## No Existing Positions Requirement [#no-existing-positions-requirement]
Users can enable the **Don't Allow Trades Until Closed** setting in order to only open trade when no existing positions are open. This setting allows waiting for a position to be closed before one can be opened.
Enabling **Don't Allow Trades Until Closed** for long positions will prevent opening shorts as long as a long position is opened.
If this same setting is not enabled for short conditions then shorts can effectively be closed by new long positions.
# Exit Conditions (/docs/ai-backtesting/backtesters/osc/exits)
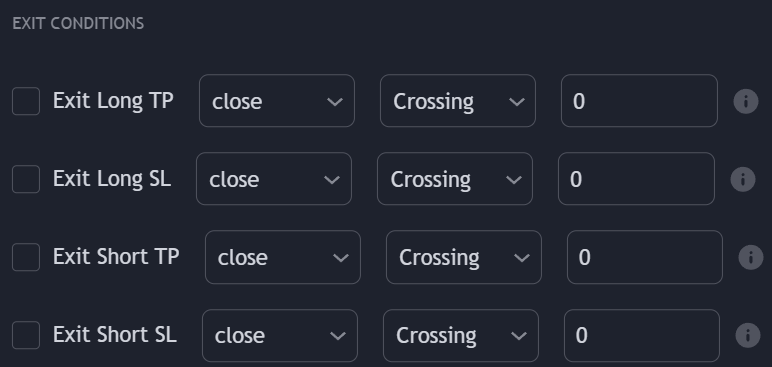
Users can close any position on a profit or loss using specific crossing conditions obtained from external sources. Exits conditions can be enabled in the **EXIT CONDITIONS** settings section.
Oscillators are intended to be used as external source when it comes to TP/SL conditions, but users can directly create scripts returning scaled outputs from overlay indicators.
### Exit Take Profit [#exit-take-profit]
Long/Short take profits exits conditions will exit a long or short position when a set condition is met such that the position exit on a profit.
Take profits conditions are triggered if they are toggled on for a specific order (Long/Short) and if the selected external source is either **Crossing**, **Crossing Up**, or **Crossing Down**, **Greater Than**, **Lower Than**, or **Equal** to the numerical value specified by the user.
### Exit Stop Losses [#exit-stop-losses]
Long/Short stop losses exits conditions will exit a long or short order when a set condition is met such that the position exit on a loss.
Stop losses conditions are triggered if they are toggled on for a specific order (Long/Short) and if the selected external source is either **Crossing**, **Crossing Up**, or **Crossing Down**, **Greater Than**, **Lower Than**, or **Equal** to the numerical value specified by the user.
### Time Exits [#time-exits]
Time exits allow users to exit trade from a specific time of the day. Note that trades are still exited at the opening of the next bar.
The timezone is the same as the one of the chart symbol.
### Placeholders [#placeholders]

Users who do not wish to use a numerical value to evaluate a condition with an external source may use a placeholder instead, which allows using prices. The following placeholders are supported:
* `open` : Opening price
* `high` : High price
* `low` : Low price
* `close` : Closing price
* `hl2` : Median price
* `ohlc4` : Average price
* `hlc3` : Typical price
* `hlcc4` : Weighted price
## Exit on Entry [#exit-on-entry]
Enabling the **Exit On Entry** setting will close any existing position when an entry condition leading to a new opposite position is met.
## Partial Exits [#partial-exits]
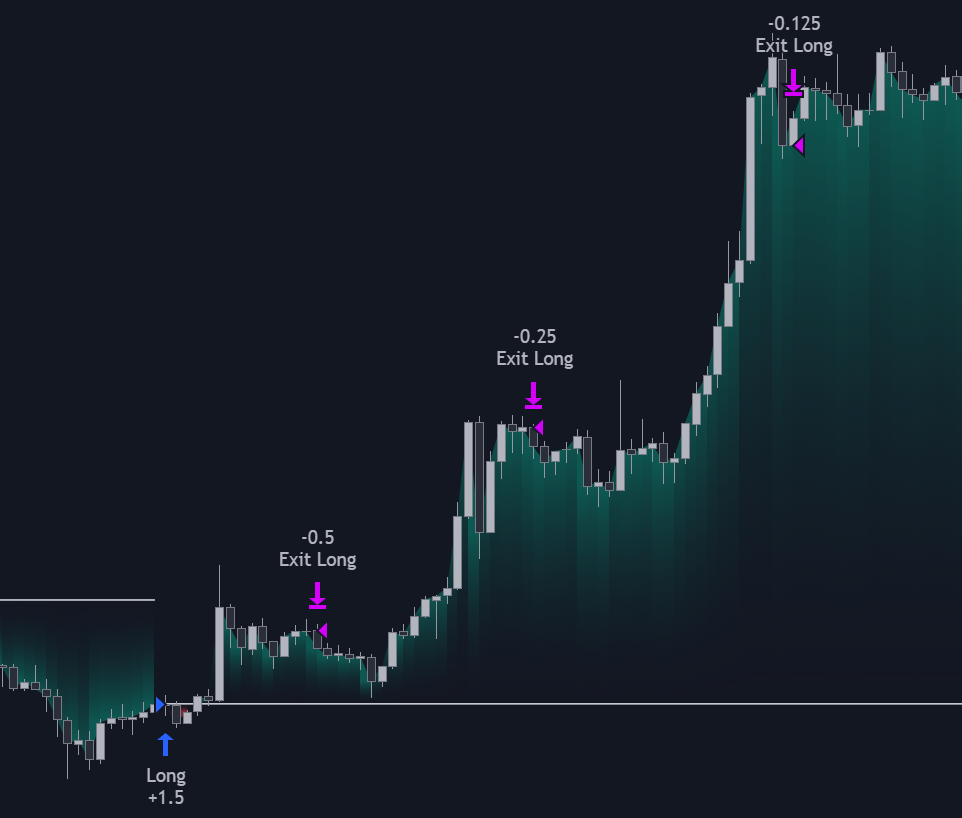
Users can exit a percentage of an existing position by specifying a percentage lower than 100%. This can lead to sequential exit, with reduced exposure each time an exit is triggered.
## Only Exit On A Profit [#only-exit-on-a-profit]
Enabling "Only Exit On A Profit" allows only triggering an exit if this exit leads to a profit, effectively preventing any exit that would lead to a loss.
This can be useful to increase winrates of strategies.
Enabling this setting alongside "Dont allow trades until closed" can prevent any losing trade from being exited, leading to a theoretical 100% winrate without a stop-loss.
Do note however that a unprofitable trade can be held for an unlimited amount of time, leading to unrealistic scenarios.
# Introduction (/docs/ai-backtesting/backtesters/osc/introduction)
Backtester (OSC) is a script that allows users to perform backtests using features from our [Oscillator Matrix®](/docs/algos/oscillator-matrix/introduction) toolkit. Users can create their own entry & exit conditions as well as control take-profit and stop-loss placement. Each core component of the backtester are described in the following pages:
# Backtest Parameters [#backtest-parameters]
The Backtester (OSC) use the following default properties:
| Property | Default | Description |
| ------------------------- | ---------------- | ---------------------------------------------------------------------------------------------------------------------------------------------------------------------------------------------------------------------------------------------------------------------------------------------------------------------------------------- |
| Backtesting Window | Bars | Determines how the backtesting interval is set. If `Bars` is selected the most recent specified amount (in `Window (Bars)`) will be used to backtest the strategy. If `Date` is selected the interval will be set using the specified starting and ending dates, while using "Entire History" will use all the available historical data |
| Window (Bars) | 2000 | Amount of the most recent bars used to backtest the strategy if `Bars` is selected in `Backtesting Window` |
| Window Start | 2024-01-01 00:00 | Starting date of the backtesting strategy if `Date` is selected in `Backtesting Window` |
| Window End | 2024-01-01 00:00 | Ending date of the backtesting strategy if `Date` is selected in `Backtesting Window` and if the `Window End` toggle is enabled |
| Initial Capital | 10 000 | Initial amount of funds available at the start of the backtest |
| Base Currency | Default | Currency used for performing the backtest, backtest statistics will be expressed using this curreny. If `Default` is selected the symbol currency is used |
| Order Size | 1 Contract | Determines the amount of contracts/currency to buy or sell, can be expressed in contracts, currency, or percent of equity |
| Commission | 0% | Fees paid per clotured trades, can be expressed as currency per contracts, currency per order, or % of the total transation value |
| Margin for long position | 0% | Equity percentage required to fund a position |
| Margin for short position | 0% | Equity percentage required to fund a position |
These should be adjusted to return more precise and accurate results of the real performance of a trading strategy.
# Disclaimer [#disclaimer]
Backtests are not indicative of future results. Backtesting strategies on synthetic data does not return representative results of a strategy. Backtests should be performed on charts returning real closing prices. See [here](https://www.tradingview.com/script/q9laJNG9-Backtesting-on-Non-Standard-Charts-Caution-PineCoders-FAQ/) for more information.
*CFTC Rule 4.41 - Hypothetical or Simulated performance results have certain limitations, unlike an actual performance record, simulated results do not represent actual trading. Also, since the trades have not been executed, the results may have under-or-over compensated for the impact, if any, of certain market factors, such as lack of liquidity. Simulated trading programs in general are also subject to the fact that they are designed with the benefit of hindsight. No representation is being made that any account will or is likely to achieve profit or losses similar to those shown.*
# Take Profit & Stop Loss (/docs/ai-backtesting/backtesters/osc/tpsl)
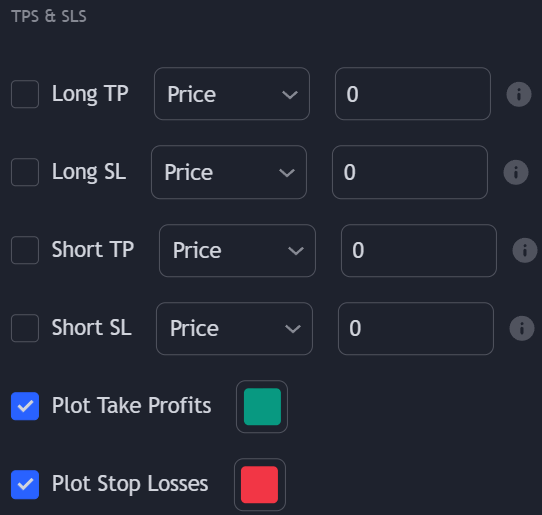
Users can set take profits and stop losses orders allowing a certain degree of money management in the backtest. Take profits and stop loss orders can be enabled and adjusted from the **FIXED TPS & SLS** settings section.
Take profits and stop losses orders are placed relative to the price preceding a trade, and might not be filled at the exact price set by the user.
## TP/SL Options [#tpsl-options]
Take profits and stop losses for specific orders can be enabled from the toggles present in their settings section. Take profits and stop losses can be set using various methods described below:
| Option | Description |
| :-----------: | :----------------------------------------------------------------------------------------------------------------------------------------------------------------------------------------------: |
| Price |
Set the take profit/stop loss orders at the specified price.
|
| Currency |
Set the take profit/stop loss orders a specified amount of currency away from the closing price preceding the entry of a long/short order.
|
| Ticks |
Set the take profit/stop loss orders a specified amount of ticks away from the closing price preceding the entry of a long/short order.
|
| % |
Set the take profit/stop loss orders a specified percentage away from the closing price preceding the entry of a long/short order.
|
| ATR |
Set the take profit/stop loss orders *N* average true ranges away from the closing price preceding the entry of a long/short order, where *N* is a specified multiplier.
|
| Forecast |
(Only available for take profits orders) Use a percentile of a returned forecast to set take profits. Forecasts must be enabled in order for this to work.
|
| Trailing Stop |
(Only available for stop loss orders) Enable a percentage based trailing stop. A position will be exited if price reach the trailing stop.
|
The average true range used to set take profits/stop losses orders make use of a period of 200 bars.
### Trailing Stop [#trailing-stop]
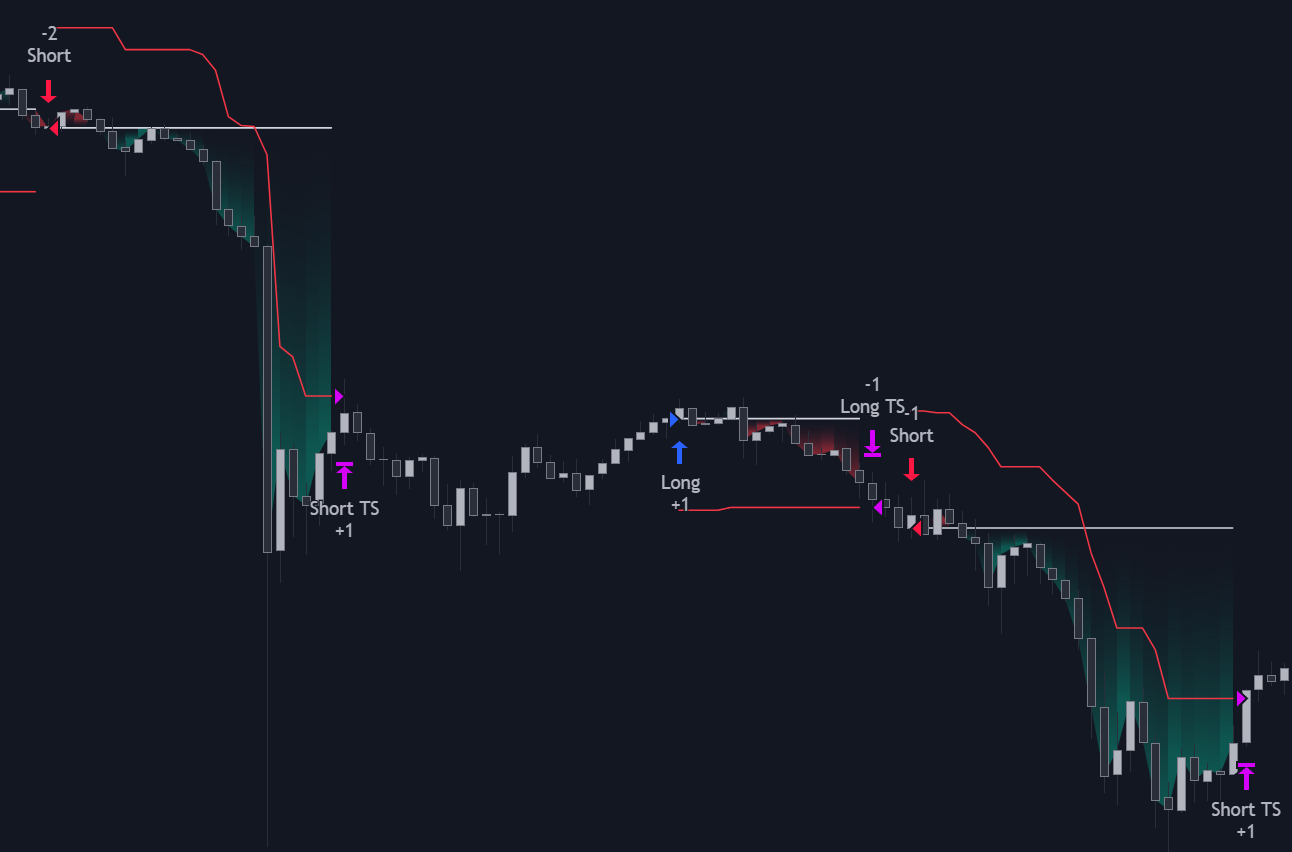
Users can use a percentage based trailing stop to exit positions. The trailing stop will move in the direction of interest if its distance with the low price(in case of long positions) or high price (in case of short positions) is greater than the specified percentage.
### Take Profits Levels From Forecast [#take-profits-levels-from-forecast]
When forecasts are displayed, users can set take profits using the **nth** percentile of a returned forecast. This can be done from the "TPS & SLS" settings, by selecting "Forecast" in the "Long TP" and/or "Short TP".
The numerical setting selected at the right of the drop-down menus determines the percentile used, and should be set within the range \[0, 100] in order to work. Percentiles values can affect the returned levels as follows:
* In case of a long trade, a lower set percentile will return take profits closer to the entry price, potentially triggering sooner.
* In case of a short trade, a lower set percentile will return take profits further away from the entry price, potentially triggering later.
Do note that because forecasts are based on the strategy entries, take profits levels based on it can be subject to repainting, except when using a backtesting window based on a date.
# Entry Rules (/docs/ai-backtesting/backtesters/pac/entry)
Backtester (PAC) allows users to set their own long/short entry rules from price action related concepts as well as external indicators. Entry rules can be built as sequences of conditions, matching conditions, or a mix of both. More details are provided in the section below.
Entry rules can be created separately for both long and short entries, and can be set using up to 6 different user set conditions. Each can enabled by toggling them on using the toggle input on the left of each condition, if the enabled conditions are valid, the strategy will open a corresponding market order.
Three types of distinct conditions are available, each described in the sections below.
## Price Action Conditions [#price-action-conditions]
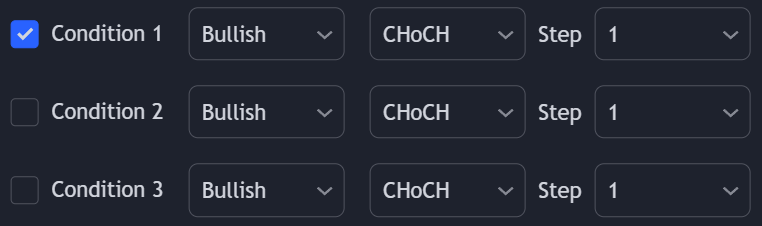
Conditions 1, 2, and 3 work the same way, and allow using conditions from market structures, volumetric order blocks, imbalances, and liquidity grabs.
The first dropdown includes options: *Bullish* and *Bearish*, and determines the origin of the selected condition in the second dropdown.
The second dropdown includes the list of price action related conditions, these include:
| Condition | Description |
| :-----------------: | :-------------------------------------------------------------------------------------------------------------------------------------------------------: |
| CHoCH or BOS | Triggered on a change of character or break of structure |
| CHoCH | Triggered on a change of character |
| BOS | Triggered on a break of structure |
| OB Mitigated | Triggered once price mitigates an order block |
| OB Within | Triggered if price is within the area of an order block |
| OB Entered | Triggered once price enters the area of an order block |
| OB Exited | Triggered once price exits the area of an order block |
| Imbalance Entered | Triggered once price enters the area of an imbalance |
| Imbalance Within | Triggered if price is within the area of an imbalance |
| Imbalance Mitigated | Triggered once price mitigates an imbalance |
| Imbalance Exited | Triggered once price exits an imbalance |
| Liquidity Grab | Triggered once a liquidity grab is detected |
| Trendline Break | Triggered once a trendline is broken. Note that a bullish trendlinereffers to an uptrending trendline, while Bearish reffers to a downtrending trendline. |
For example, if the user wants to go **Long** when a new **Bullish** **CHoCH** the following settings would be used:
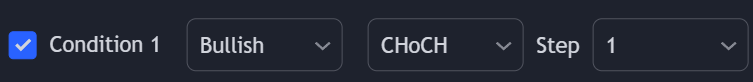
User can change the settings of each price action concept by scrolling down the settings, each concept has its own setting group. To learn more about each concept see:
[Market Structures](/docs/algos/price-action-concepts/market-structures)
[Order Blocks](/docs/algos/price-action-concepts/order-blocks)
[Imbalances](/docs/algos/price-action-concepts/imbalances)
[Liquidity Grabs](/docs/algos/price-action-concepts/liquidity)
## External Conditions [#external-conditions]
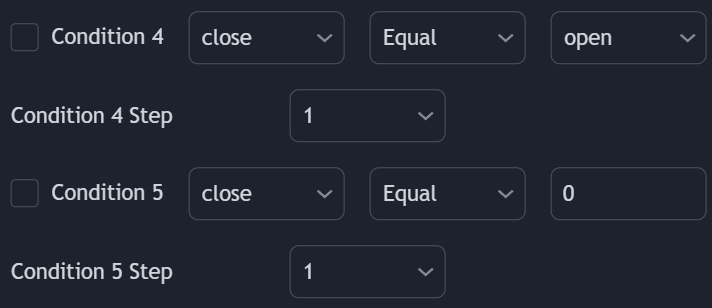
Users can use the output of external indicators on the chart as input to set entry conditions.
The second dropdown of external condition settings determines which conditional operator to use on both external outputs. These include:
* Greater Than
* Lower Than
* Equal
* Crossing Over
* Crossing Under
* Crossing
The third external condition works similarly but instead of comparing two external outputs the condition will compare an external output specified in the condition first dropdown with a user set value in the third dropdown using a conditional operator set on the second dropdown. This last condition is particularly useful for oscillators.
Here is an example of the third external condition being set for price crossing over a simple moving average.
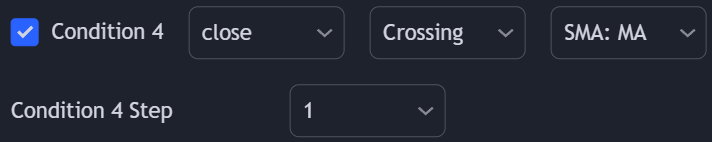
## Session Condition [#session-condition]
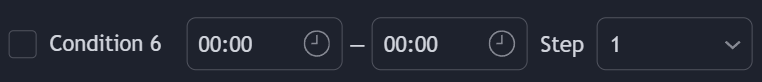
Condition 6 is a session condition, with an active status if current time is within the specified session interval.
Session timezone is the same as the one of the chart symbol exchange (UTC for cryptocurrencies)
## Using Conditions Together [#using-conditions-together]
More complex entry rules can be created by using multiple conditions together, this is done thanks to the **Step** dropdown setting on the right of each condition (below each condition for conditions 4 and 5).
The *Step* setting is directly related to the Step & Match algorithm and work in two ways:
* When two or more conditions have the same step number, both conditions are evaluated. Used to test matching conditions.
* When two or more conditions have different step numbers, each conditions will be evaluated in order, testing for the first step and switching to the next step once the previous one is true. When the final step is true the strategy will open a market order. Used to create sequence of conditions.
This operation is complementary, as you can create a sequence of conditions with one step consisting of two or more matching conditions as long as they have the same step number.
A user wanting to go long when a bullish break of structure occurs after price mitigated a bearish order block while price was above its 20 period moving average could do it as follows:

### Invalidate Step [#invalidate-step]
The "Invalidate" step allows to set a condition as an "invalidation condition". When this condition is triggered while a sequence of conditions is incomplete, the sequence will restart at step 1.
If multiple steps are set as "Invalidate" any of the conditions being true will reset the sequence of conditions, as such not all of them are required to be true for the sequence of conditions to reset.
Let's take an example where we use 2 regular steps and one "Invalidate" step. The position will be opened when step 2 trigger after step 1 has been triggered.
Step 1 condition trigger, we will now evaluate step 2 from now on.
Invalidation step condition trigger, we reset the sequence and evaluate step 1 just after.
### Invalidation Behaviors [#invalidation-behaviors]
Invalidation behaviors allows adding more restrictions to a sequence of conditions, users can use two different invalidation behaviors described below:
#### Invalidate On Step 1 [#invalidate-on-step-1]
The "Invalidate On Step 1" behavior allows to reset an incomplete sequence of conditions when the condition on step 1 trigger. This prevents the first step condition from happening in between other steps of the condition sequence.
This behavior is useful when the first step of our sequence of conditions needs to never be repeated during the sequence.
Let's take an example where we use 3 regular steps.
Step 1 condition trigger, we will now evaluate step 2 from now on.
Step 2 condition trigger, we will now evaluate step 3 from now on.
Step 1 condition trigger, we start evaluating step 2 from now.
#### Invalidate On Any Repeated Step [#invalidate-on-any-repeated-step]
The "Invalidate On Any Repeated Step" behavior allows to reset an incomplete sequence of conditions when a step is triggered such that it does not respect the set order of conditions.
This behavior is useful when we want a perfectly ordered sequence of conditions to complete, without any step repeating itself.
Let's take an example where we use 3 regular steps.
Step 1 condition trigger, we will now evaluate step 2 from now on.
Step 2 condition trigger, we will now evaluate step 3 from now on.
Step 1 or 2 conditions trigger, we start evaluating step 1 from now.
## Limit / Stop Orders [#limit--stop-orders]
Limit, stop, and stop-limit orders provide better control over the price at which a trade is executed.
These can be enabled for long and short positions respectively.
### Limit Orders [#limit-orders]

Limit orders execute at a specified price or better. For long positions, a limit order is generally placed below the current market price; for short positions, it is placed higher.
Limit orders can be enabled by toggling the "Long Limit Value" setting.
Limit orders are represented by a dotted line.
A dot is displayed to indicate when a long condition is true, thus updating the limit order price.
### Stop Orders [#stop-orders]

Stop orders execute at a specified price or worse. For long positions, a stop order is generally placed above the current market price; for short positions, it is placed lower.
Stop orders can be enabled by toggling the "Long Stop Value" setting.
Stop orders are represented by a dashed line.
A dot is displayed to indicate when a long condition is true, thus updating the stop order price.
### Stop-Limit Orders [#stop-limit-orders]

Stop-limit orders use both limit and stop orders together, providing more control over the price at which a trade is executed.
In a stop-limit order, when the specified stop price is reached, the limit order becomes active. Once this limit price is reached, the trade is executed.
### Limit / Stop Orders Price [#limit--stop-orders-price]


The price of limit and stop orders is specified in "Long Limit Value"/"Short Limit Value" and "Long Stop Value"/"Short Stop Value," respectively. These settings are located at the bottom of the Long/Short Conditions settings groups.
Similar to TP/SL, various options to determine the order price are available:
| Option | Description |
| :------: | :--------------------------------------------------------------------------------------------------------------------------------------------------------: |
| Price |
Set the limit/stop orders at the specified price.
|
| Currency |
Set the limit/stop orders a specified amount of currency away from where the entry condition is met.
|
| Ticks |
Set the limit/stop orders a specified amount of ticks away from where the entry condition is met.
|
| % |
Set the limit/stop orders a specified percentage away from where the entry condition is met.
|
| ATR |
Set the limit/stop orders *N* average true ranges away from where the entry condition is met, where *N* is a specified multiplier.
|
| Forecast |
Use a percentile of a returned forecast to the order price. Forecasts must be enabled in order for this to work.
|
For convenience, all options (except "Price") are adjusted based on the order type; for example, limit orders will be below the current price for longs and above for shorts, while stop orders will be above the price for longs and below for shorts. These can always be inverted using a negative value.
The price of a limit/stop order is updated every time the specified long/short condition is true.
## No Existing Positions Requirement [#no-existing-positions-requirement]
Users can enable the **Don't Allow Trades Until Closed** setting in order to only open trade when no existing positions are open. This setting allows waiting for a position to be closed before one can be opened.
Enabling **Don't Allow Trades Until Closed** for long positions will prevent opening shorts as long as a long position is opened.
If this same setting is not enabled for short conditions then shorts can effectively be closed by new long positions.
# Exit Rules (/docs/ai-backtesting/backtesters/pac/exits)
The strategy can include custom long/short orders exits rules. These can be created in a similar way than entry rules by using two available conditions, and can evaluate price action features as well as the output of external indicators on your chart.
## Price Action Conditions [#price-action-conditions]
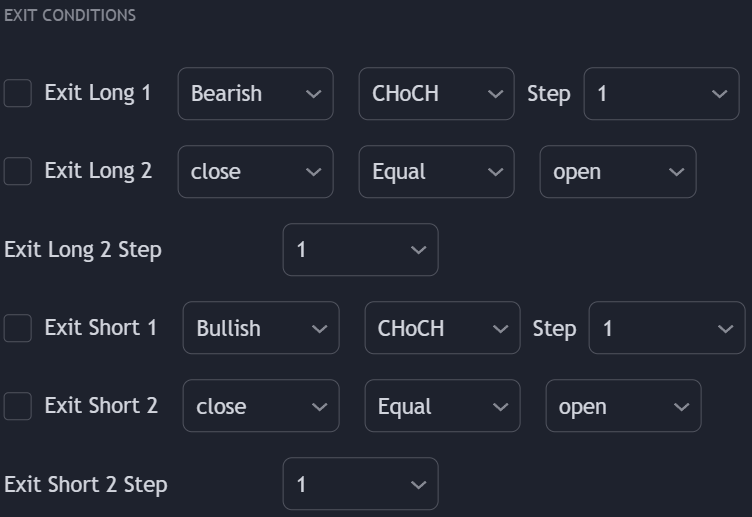
Conditions *Exit Long 1* and *Exit Short 1* allow using conditions from market structures, volumetric order blocks, and imbalances.
The first dropdown includes options: *Bullish* and *Bearish* and determines the origin of the selected condition in the second dropdown.
The second dropdown includes the list of price action related conditions, these include:
| Condition | Description |
| :-----------------: | :------------------------------------------------------: |
| CHoCH or BOS | Triggered on a change of character or break of structure |
| CHoCH | Triggered on a change of character |
| BOS | Triggered on a break of structure |
| Mitigated OB | Triggered once price mitigates an order block |
| Within OB | Triggered if price is within the area of an order block |
| Entered OB | Triggered once price enters the area of an order block |
| Entered Imbalance | Triggered once price enters the area of an imbalance |
| Within Imbalance | Triggered if price is within the area of an imbalance |
| Mitigated Imbalance | Triggered once price mitigates an imbalance |
## External Conditions [#external-conditions]
Conditions *Exit Long 2* and *Exit Short 2* allow the user to use the output of external indicators on the chart as input for setting exit conditions.
These allow setting a condition based on two different external indicators output, with The first and third dropdowns determining which external output to use.
The second dropdown determines which conditional operator to use on both external outputs. These include:
* Greater Than
* Lower Than
* Equal
* Crossing Over
* Crossing Under
* Crossing
## Using Conditions Together [#using-conditions-together]
More complex exit rules can be created by using multiple conditions together, this is done thanks to the **Step** dropdown setting on the right of each condition (below each condition for *Exit Long 2* and *Exit Short 2*).
The *Step* setting is directly related to the Step & Match algorithm and works in two ways:
* When two or more conditions have the same step number, both conditions are evaluated. Used to test matching conditions.
* When two or more conditions have different step numbers, each condition will be evaluated in order, testing for the first step and switching to the next step once the previous one is true. When the final step is true the strategy will open a market order. Used to create sequence of conditions.
This operation is complementary, as you can create a sequence of conditions with one step consisting of two or more matching conditions as long as they have the same step number.
## Time Exits [#time-exits]
Time exits allow users to exit trade from a specific time of the day. Note that trades are still exited at the opening of the next bar.
The timezone is the same as the one of the chart symbol.
## Exit on Entry [#exit-on-entry]
Enabling the **Exit On Entry** setting will close any existing position when an entry condition leading to a new opposite position is met.
## Partial Exits [#partial-exits]

Users can exit a percentage of an existing position by specifying a percentage lower than 100%. This can lead to sequential exit, with reduced exposure each time an exit is triggered.
## Only Exit On A Profit [#only-exit-on-a-profit]
Enabling "Only Exit On A Profit" allows only triggering an exit if this exit leads to a profit, effectively preventing any exit that would lead to a loss.
This can be useful to increase winrates of strategies.
Enabling this setting alongside "Dont allow trades until closed" can prevent any losing trade from being exited, leading to a theoretical 100% winrate without a stop-loss.
Do note however that a unprofitable trade can be held for an unlimited amount of time, leading to unrealistic scenarios.
# Introduction (/docs/ai-backtesting/backtesters/pac/introduction)
Backtester (PAC) is a script that allows users to perform advanced backtests on all features from our [Price Action Concepts®](../../docs/algos/price-action-concepts/introduction) toolkit. Users can create their own entry & exit conditions as well as control take-profit & stop-loss placement. Each core components of the system is described on the following pages:
# Backtest Parameters [#backtest-parameters]
The Backtester (PAC) uses the following default properties:
| Property | Default | Description |
| ------------------------- | ---------------- | ---------------------------------------------------------------------------------------------------------------------------------------------------------------------------------------------------------------------------------------------------------------------------------------------------------------------------------------- |
| Backtesting Window | Bars | Determines how the backtesting interval is set. If `Bars` is selected the most recent specified amount (in `Window (Bars)`) will be used to backtest the strategy. If `Date` is selected the interval will be set using the specified starting and ending dates, while using "Entire History" will use all the available historical data |
| Window (Bars) | 2000 | Amount of the most recent bars used to backtest the strategy if `Bars` is selected in `Backtesting Window` |
| Window Start | 2024-01-01 00:00 | Starting date of the backtesting strategy if `Date` is selected in `Backtesting Window` |
| Window End | 2024-01-01 00:00 | Ending date of the backtesting strategy if `Date` is selected in `Backtesting Window` and if the `Window End` toggle is enabled |
| Initial Capital | 10 000 | Initital amount of funds available at the start of the backtest |
| Base Currency | Default | Currency used for performing the backtest, backtest statistics will be expressed using this curreny. If `Default` is selected the symbol currency is used |
| Order Size | 1 Contract | Determines the amount of contracts/currency to buy or sell, can be expressed in contracts, currency, or percent of equity |
| Commission | 0% | Fees paid per clotured trades, can be expressed as currency per contracts, currency per order, or % of the total transaction value |
| Margin for long position | 0% | Equity percentage required to fund a position |
| Margin for short position | 0% | Equity percentage required to fund a position |
These should be adjusted to return more precise and accurate results of the real performance of a trading strategy.
# Disclaimer [#disclaimer]
Backtests are not indicative of future results. Backtesting strategies on synthetic data does not return representative results of a strategy. Backtests should be performed on charts returning real closing prices. See [here](https://www.tradingview.com/script/q9laJNG9-Backtesting-on-Non-Standard-Charts-Caution-PineCoders-FAQ/) for more information.
*CFTC Rule 4.41 - Hypothetical or Simulated performance results have certain limitations, unlike an actual performance record, simulated results do not represent actual trading. Also, since the trades have not been executed, the results may have under-or-over compensated for the impact, if any, of certain market factors, such as lack of liquidity. Simulated trading programs in general are also subject to the fact that they are designed with the benefit of hindsight. No representation is being made that any account will or is likely to achieve profit or losses similar to those shown.*
# Take Profit & Stop Loss (/docs/ai-backtesting/backtesters/pac/tpsl)

Users can set take profits and stop losses orders allowing a certain degree of money management in the backtest. Take profits and stop loss orders can be enabled and adjusted from the **FIXED TPS & SLS** settings section.
Take profits and stop losses orders are placed relative to the price preceding a trade, and might not be filled at the exact price set by the user.
## TP/SL Options [#tpsl-options]
Take profits and stop losses for specific orders can be enabled from the toggles present in their settings section. Take profits and stop losses can be set using various methods described below:
| Option | Description |
| :-----------: | :----------------------------------------------------------------------------------------------------------------------------------------------------------------------------------------------: |
| Price |
Set the take profit/stop loss orders at the specified price.
|
| Currency |
Set the take profit/stop loss orders a specified amount of currency away from the closing price preceding the entry of a long/short order.
|
| Ticks |
Set the take profit/stop loss orders a specified amount of ticks away from the closing price preceding the entry of a long/short order.
|
| % |
Set the take profit/stop loss orders a specified percentage away from the closing price preceding the entry of a long/short order.
|
| ATR |
Set the take profit/stop loss orders *N* average true ranges away from the closing price preceding the entry of a long/short order, where *N* is a specified multiplier.
|
| Forecast |
(Only available for take profits orders) Use a percentile of a returned forecast to set take profits. Forecasts must be enabled in order for this to work.
|
| Trailing Stop |
(Only available for stop loss orders) Enable a percentage based trailing stop. A position will be exited if price reach the trailing stop.
|
The average true range used to set take profits/stop losses orders make use of a period of 200 bars.
### Trailing Stop [#trailing-stop]

Users can use a percentage based trailing stop to exit positions. The trailing stop will move in the direction of interest if its distance with the low price(in case of long positions) or high price (in case of short positions) is greater than the specified percentage.
### Take Profits Levels From Forecast [#take-profits-levels-from-forecast]
When forecasts are displayed, users can set take profits using the **nth** percentile of a returned forecast. This can be done from the "TPS & SLS" settings, by selecting "Forecast" in the "Long TP" and/or "Short TP".
The numerical setting selected at the right of the drop-down menus determines the percentile used, and should be set within the range \[0, 100] in order to work. Percentiles values can affect the returned levels as follows:
* In case of a long trade, a lower set percentile will return take profits closer to the entry price, potentially triggering sooner.
* In case of a short trade, a lower set percentile will return take profits further away from the entry price, potentially triggering later.
Do note that because forecasts are based on the strategy entries, take profits levels based on it can be subject to repainting, except when using a backtesting window based on a date.
# Entry Rules (/docs/ai-backtesting/backtesters/s-o/entry)
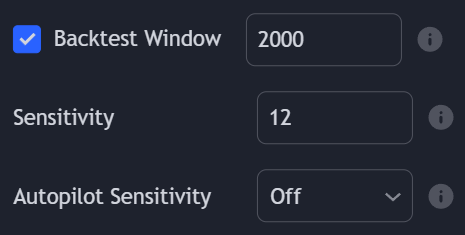
The Signals & Overlays (S\&O) Backtester makes use of various features within the Signals & Overlays® toolkit, such as [Confirmation and Contrarian Signals](/docs/algos/signals-overlays/signals) or [Overlays indicators](/docs/algos/signals-overlays/indicator-overlay), to specify entry rules for your strategy.
More information regarding signal settings can be found [here](/docs/algos/signals-overlays/signal-settings)
By default, backtesting is performed using the most recent 2,000 bars. This value can be changed from the **Backtest Window (Bars)** setting. Users can also perform a backtest between two specified dates using the "Date" options in "Backtesting Window", or use all available chart history via "Entire History" (note that this will disable the optimizer).
## Long / Short Entry Conditions [#long--short-entry-conditions]
Users can specify the long and short entry rules for their strategy from the **LONG CONDITIONS** and **SHORT CONDITIONS** settings sections, using the following available options:
| Condition | Options | Options (2) | Description |
| :------------------: | :---------------------------------------------------------------------------------------------------------------------------------------------------------------------------------------------------------: | :-------------------------------------------------------------------------------------------------------------------------------------------------------------------------------------------------------------------------------: | :---------------------------------------------------------------------------------------------------------------------------------------------------------------------------------------------------------------------------------------------------------------------------------------------------------------------------------------------------------------------------------------------------------------------------------------------------------------------------------------------------: |
| Signal Type |
Confirmation
Contrarian
|
Any Bullish
Any Bearish
Normal Bullish
Normal Bearish
Strong Bullish
Strong Bearish
Bullish Classifier
Bearish Classifier
|
Enter a position on the occurrence of the specified signal. Users can select between the Confirmation and Contrarian signals algorithm (Long/Short conditions can use different algorithms), which are affected by the selected Sensitivity and Autopilot frequency settings.
Selecting "Bullish Classifier" or "Bearish Classifier" will open positions on the occurrence of a signal with the same classification as the one specified in the rightmost input.
|
| Reversal Zones | Cross Over R3, Cross Over R2, Cross Over R1, Cross Under S1, Cross Under S2, Cross Under S3, Above R3, Within \[R3-R2], Within \[R2-R1], Within \[R1-S1], Within \[S1-S2], Within \[S2-S3], Under S3 |
Enter a position if price is above/under or within the specified extremities.
| |
| Smart Trail |
Bullish
Bearish
Switch Bullish
Switch Bearish
| |
Enter a position if the Smart Trail switches bullish/bearish or if it is currently bullish or bearish.
|
| Trend Tracer |
Bullish
Bearish
Switch Bullish
Switch Bearish
| |
Enter a position if the Trend Tracer switches bullish/bearish or if it is currently bullish or bearish.
|
| Trend Catcher |
Bullish
Bearish
Switch Bullish
Switch Bearish
| |
Enter a position if the Trend Catcher switches bullish/bearish or if it is currently bullish or bearish.
|
| Neo Cloud |
Bullish
Bearish
Switch Bullish
Switch Bearish
Lead Step Up
Lead Step Down
Lag Step Up
Lag Step Down
| |
Enter a position if the Neo Cloud switches bullish/bearish or if it is currently bullish or bearish.
|
| Trend Strength |
Greater Than
Lower Than
| |
Enter a position if the Trend Strength is greater or lower than the specified value.
|
| Session | Session interval | |
Enter a position if it is within the specified session interval.
|
| External Condition 1 |
Greater Than
Lower Than
Equal
Crossing Over
Crossing Under
Crossing
| |
Enter a position if the condition between the first and second specified external sources is true.
|
| External Condition 2 |
Greater Than
Lower Than
Equal
Crossing Over
Crossing Under
Crossing
| |
Enter a position if the condition between the first and second specified external sources is true.
|
| External Condition 3 |
Greater Than
Lower Than
Equal
Crossing Over
Crossing Under
Crossing
| |
Enter a position if the condition between the first and second specified external sources is true. Users can use price placeholders such as open, high, low, close, hl2, ohlc4, hlc3, and hlcc4 instead of a numerical value in the second source input.
|
Multiple conditions can be enabled at the same time, in which case the backtester requires all conditions to be true in order to execute an order.
If the **Exit On Signal** setting is enabled, existing positions will be exited on the occurrence of a confirmation/contrarian signal.
## Limit / Stop Orders [#limit--stop-orders]
Limit, stop, and stop-limit orders provide better control over the price at which a trade is executed.
These can be enabled for long and short positions respectively.
### Limit Orders [#limit-orders]

Limit orders execute at a specified price or better. For long positions, a limit order is generally placed below the current market price; for short positions, it is placed higher.
Limit orders can be enabled by toggling the "Long Limit Value" setting.
Limit orders are represented by a dotted line.
A dot is displayed to indicate when a long condition is true, thus updating the limit order price.
### Stop Orders [#stop-orders]

Stop orders execute at a specified price or worse. For long positions, a stop order is generally placed above the current market price; for short positions, it is placed lower.
Stop orders can be enabled by toggling the "Long Stop Value" setting.
Stop orders are represented by a dashed line.
A dot is displayed to indicate when a long condition is true, thus updating the stop order price.
### Stop-Limit Orders [#stop-limit-orders]

Stop-limit orders use both limit and stop orders together, providing more control over the price at which a trade is executed.
In a stop-limit order, when the specified stop price is reached, the limit order becomes active. Once this limit price is reached, the trade is executed.
### Limit / Stop Orders Price [#limit--stop-orders-price]


The price of limit and stop orders is specified in "Long Limit Value"/"Short Limit Value" and "Long Stop Value"/"Short Stop Value," respectively. These settings are located at the bottom of the Long/Short Conditions settings groups.
Similar to TP/SL, various options to determine the order price are available:
| Option | Description |
| :------: | :--------------------------------------------------------------------------------------------------------------------------------------------------------: |
| Price |
Set the limit/stop orders at the specified price.
|
| Currency |
Set the limit/stop orders a specified amount of currency away from where the entry condition is met.
|
| Ticks |
Set the limit/stop orders a specified amount of ticks away from where the entry condition is met.
|
| % |
Set the limit/stop orders a specified percentage away from where the entry condition is met.
|
| ATR |
Set the limit/stop orders *N* average true ranges away from where the entry condition is met, where *N* is a specified multiplier.
|
| Forecast |
Use a percentile of a returned forecast to the order price. Forecasts must be enabled in order for this to work.
|
For convenience, all options (except "Price") are adjusted based on the order type; for example, limit orders will be below the current price for longs and above for shorts, while stop orders will be above the price for longs and below for shorts. These can always be inverted using a negative value.
The price of a limit/stop order is updated every time the specified long/short condition is true.
## No Existing Positions Requirement [#no-existing-positions-requirement]
Users can enable the **Don't Allow Trades Until Closed** setting to only open trades when no existing positions are active. This setting allows waiting for a position to be closed before another can be opened.
Enabling **Don't Allow Trades Until Closed** for long positions will prevent opening shorts as long as a long position is open.
If this same setting is not enabled for short conditions, then shorts can effectively be closed by new long positions.
# Exit Conditions (/docs/ai-backtesting/backtesters/s-o/exits)
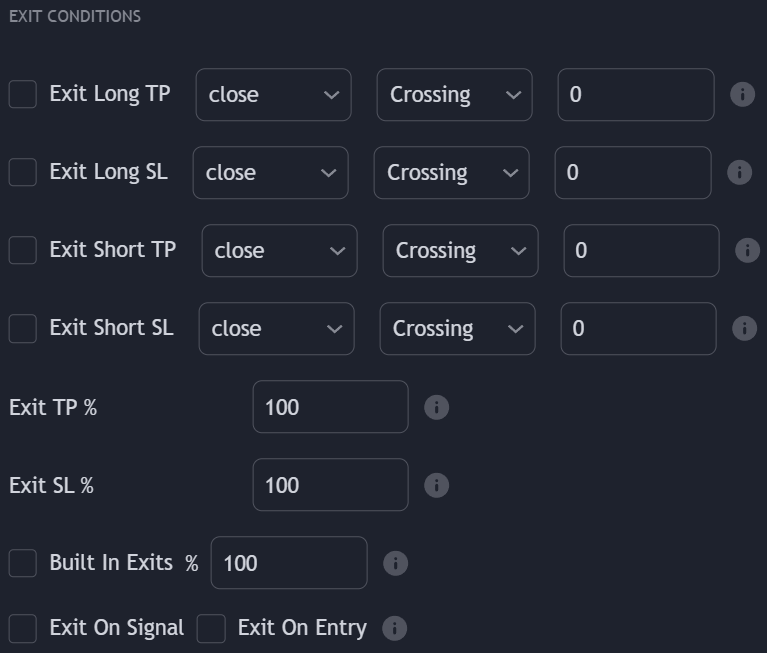
Users can close any position on a profit or loss using specific crossing conditions obtained from a user-selected external source and/or by using our builtins exits. Exit conditions can be enabled in the **EXIT CONDITIONS** settings section.
## External Exits [#external-exits]
### Exit Take Profit [#exit-take-profit]
Long/Short take profits exit conditions will exit a long or short position when a set condition is met such that the position exits on a profit.
Take profits conditions are triggered if they are toggled on for a specific order (Long/Short) and if the selected external source is either **Crossing**, **Crossing Up**, or **Crossing Down**, **Greater Than**, **Lower Than**, or **Equal** to the numerical value specified by the user.
### Exit Stop Losses [#exit-stop-losses]
Long/Short stop-losses exit conditions will exit a long or short order when a set condition is met such that the position exits on a loss.
Stop losses conditions are triggered if they are toggled on for a specific order (Long/Short) and if the selected external source is either **Crossing**, **Crossing Up**, or **Crossing Down**, **Greater Than**, **Lower Than**, or **Equal** to the numerical value specified by the user.
### Placeholders [#placeholders]
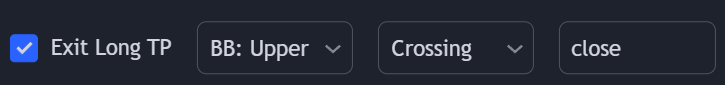
Users who do not wish to use a numerical value to evaluate a condition with an external source may use a placeholder instead, which allows price data to be used. The following placeholders are supported:
* `open` : Opening price
* `high` : High price
* `low` : Low price
* `close` : Closing price
* `hl2` : Median price
* `ohlc4` : Average price
* `hlc3` : Typical price
* `hlcc4` : Weighted price
## Builtins Exits [#builtins-exits]
Built-in exits are included for the selected signal algorithm, these are the same as the ones present in the Signals & Overlays® toolkit and can be used in the Backtester to exit positions.
Built-in exits will always exit a position on a profit.
## Time Exits [#time-exits]
Time exits allow users to exit trade at a specific time of the day. Note that trades are still exited at the opening of the next bar.
The timezone is the same as the one on the chart symbol.
## Exit On Signal [#exit-on-signal]
Enabling the **Exit On Signal** setting will close any position once a new confirmation or contrarian signal is generated (if enabled).
## Exit on Entry [#exit-on-entry]
Enabling the **Exit On Entry** setting will close any existing position when an entry condition leading to a new opposite position is met.
## Partial Exits [#partial-exits]

Users can exit a percentage of an existing position by specifying a percentage lower than 100%.
This can lead to sequential exits, with reduced exposure each time an exit is triggered.
# Introduction (/docs/ai-backtesting/backtesters/s-o/introduction)
Backtester (S\&O) is a script that allows users to perform backtests using features from our [Signals & Overlays®](/docs/algos/signals-overlays/introduction) toolkit. Many options are included to provide more complete & diverse backtests to the user, and each core component of the system are described in the following pages:
# Backtest Parameters [#backtest-parameters]
The Backtester (S\&O) use the following default properties:
| Property | Default | Description |
| ------------------------- | ---------------- | ---------------------------------------------------------------------------------------------------------------------------------------------------------------------------------------------------------------------------------------------------------------------------------------------------------------------------------------- |
| Backtesting Window | Bars | Determines how the backtesting interval is set. If `Bars` is selected the most recent specified amount (in `Window (Bars)`) will be used to backtest the strategy. If `Date` is selected the interval will be set using the specified starting and ending dates, while using "Entire History" will use all the available historical data |
| Window (Bars) | 2000 | Amount of the most recent bars used to backtest the strategy if `Bars` is selected in `Backtesting Window` |
| Window Start | 2024-01-01 00:00 | Starting date of the backtesting strategy if `Date` is selected in `Backtesting Window` |
| Window End | 2024-01-01 00:00 | Ending date of the backtesting strategy if `Date` is selected in `Backtesting Window` and if the `Window End` toggle is enabled |
| Initial Capital | 10 000 | Initial amount of funds available at the start of the backtest |
| Base Currency | Default | Currency used for performing the backtest, backtest statistics will be expressed using this curreny. If `Default` is selected the symbol currency is used |
| Order Size | 1 Contract | Determines the amount of contracts/currency to buy or sell, can be expressed in contracts, currency, or percent of equity |
| Commission | 0% | Fees paid per closed trades, can be expressed as currency per contracts, currency per order, or % of the total transation value |
| Margin for long position | 0% | Equity percentage required to fund a position |
| Margin for short position | 0% | Equity percentage required to fund a position |
These should be adjusted to return more precise and accurate results of the real performance of a trading strategy.
# Disclaimer [#disclaimer]
Backtests are not indicative of future results. Backtesting strategies on synthetic data does not return representative results of a strategy. Backtests should be performed on charts returning real closing prices. See [here](https://www.tradingview.com/script/q9laJNG9-Backtesting-on-Non-Standard-Charts-Caution-PineCoders-FAQ/) for more information.
*CFTC Rule 4.41 - Hypothetical or Simulated performance results have certain limitations, unlike an actual performance record, simulated results do not represent actual trading. Also, since the trades have not been executed, the results may have under-or-over compensated for the impact, if any, of certain market factors, such as lack of liquidity. Simulated trading programs in general are also subject to the fact that they are designed with the benefit of hindsight. No representation is being made that any account will or is likely to achieve profit or losses similar to those shown.*
# Optimization (/docs/ai-backtesting/backtesters/s-o/optimization)
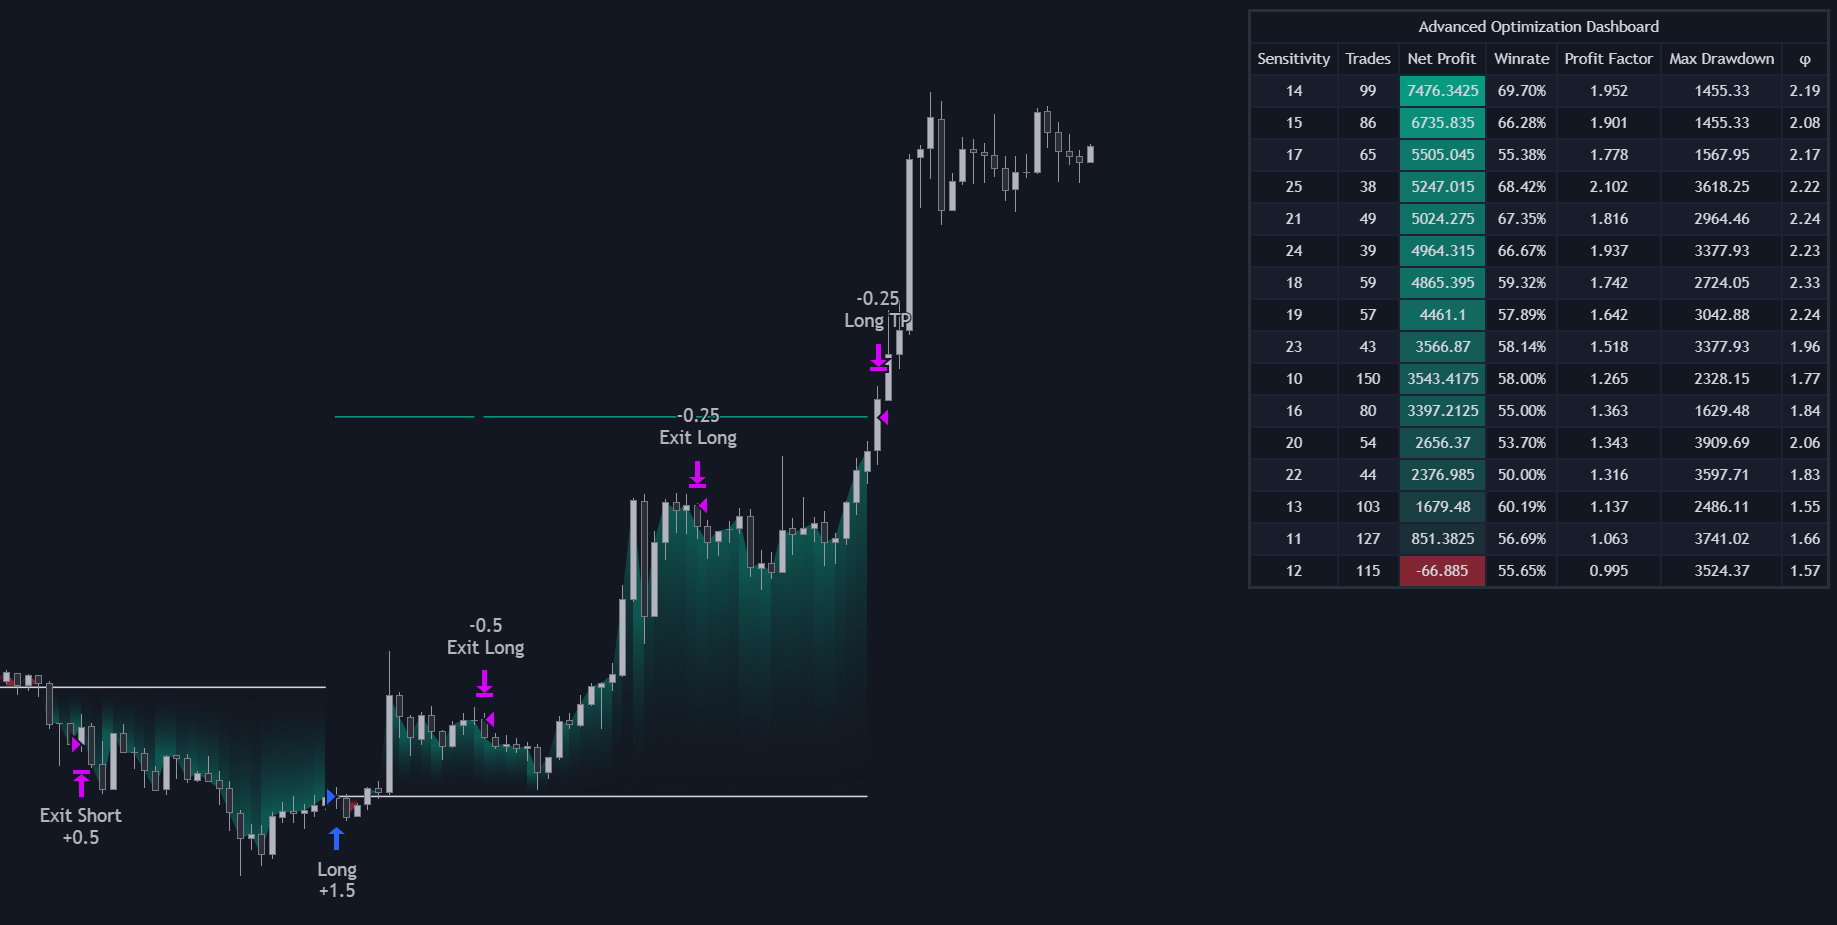
When signals are used to perform a backtest, the Backtester is able to return the **Sensitivity** setting that maximized a user specified statistic such as net profit, winrate, profit factor, or maximum drawdown.
Certain settings will disable the optimization procedure, such as disabling the backtesting window or using autopilot.
## Procedure [#procedure]
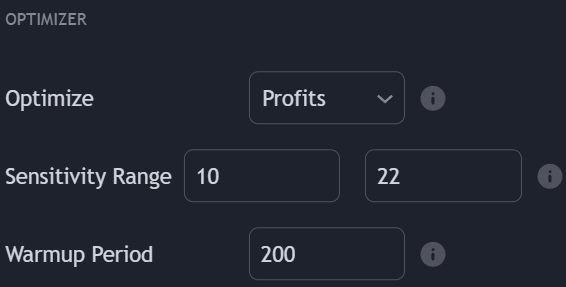
Users can choose to optimize net profit, winrate, profit factor, potential ratio $(\varphi)$ or maximum drawdown depending on the options selected from the **Optimize** drop-down menu within the **OPTIMIZER** settings section.
The overall profit or loss achieved (higher is better).
The percentage of winning trades (higher is better).
The gross profits over gross losses generated by the strategy (higher is better). A value higher than 1 suggest that the strategy generated more profits than losses.
The greatest decline of the strategy relative to the highest net profits (Lower is better).
A lower value is indicative of a strategy less subject to large downside variability.
The ratio between the sum of maximum potential profits you could have made in your trades over the sum of maximum potential losses you could have made in your trades (higher is better).
Higher values indicates that the entries generated by the strategy have the potential to lead to larger profits compared to losses. Lower values however might be indicative of a more risky strategy, with more frequent exposure to larger potential losses.
If the backtest with the highest potential ratio is not the one with the highest potential profit then it can be indicative of a strategy with more potential with a tendency to exit trades potentially too late.
Optimization can be performed on any given range for the **Sensitivity** setting.
Optimizing the **Sensitivity** setting using a large range of values and/or using a large backtest window can increase computation time, potentially returning time-out errors.
Results from the optimizer can vary from the backtest results returned by the strategy, this is due to the difference between how the Tradingview backtesting engine opens positions compared to the internal engine used to perform optimization within the script. Using different signal algorithms for long/short entry rules can return very different results from the optimizer compared to backtesting results.
Take profits and/or stop losses orders are taken into account by the internal engine if these are enabled, however, there can still exist a great degree of disparity between results from the backtest and results returned by the optimizer.
### Warmup Period [#warmup-period]
The warmup period allows the script to compute the signal algorithms *n* bars prior to the backtesting window, where *n* is the selected warmup period. This allows to backtest signals that are closer to the ones returned by the Signals & Overlays® toolkit, returning more accurate optimized settings as a result.
## Optimization Dashboard [#optimization-dashboard]
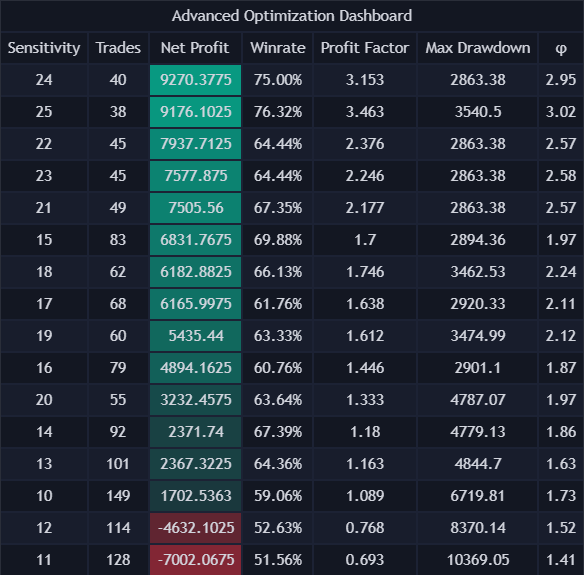
Users can see the backtests results for sensitivity values within the specified optimization range on a dashboard shown on the top-right of their chart. This dashboard presents results in descending order, with results associated to the best optimized statistic appearing on top.
### Simple [#simple]
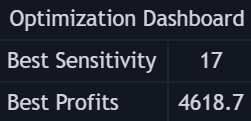
Users that do not wish to have a large dashboard on the chart can use the **Simple** optimization dashboard. This dashboard will only return the **Sensitivity** setting that optimize the selected statistic alongside the statistic of interest.
### Display [#display]
Users can control the location as well as hide the optimization dashboard on the chart from the **DISPLAY** settings section.
A dashboard location set to **None** will hide it from the chart as well as disable the optimizer.
# Take Profit & Stop Loss (/docs/ai-backtesting/backtesters/s-o/tpsl)

Users can set take profits and stop losses orders allowing a certain degree of money management in the backtest. Take profits and stop loss orders can be enabled and adjusted from the **FIXED TPS & SLS** settings section.
Take profits and stop losses orders are placed relative to the price preceding a trade, and might not be filled at the exact price set by the user.
## TP/SL Options [#tpsl-options]
Take profits and stop losses for specific orders can be enabled from the toggles in their settings section. Take profits and stop losses can be set using various methods described below:
| Option | Description |
| :-----------: | :----------------------------------------------------------------------------------------------------------------------------------------------------------------------------------------------: |
| Price |
Set the take profit/stop loss orders at the specified price.
|
| Currency |
Set the take profit/stop loss orders a specified amount of currency away from the closing price preceding the entry of a long/short order.
|
| Ticks |
Set the take profit/stop loss orders a specified amount of ticks away from the closing price preceding the entry of a long/short order.
|
| % |
Set the take profit/stop loss orders a specified percentage away from the closing price preceding the entry of a long/short order.
|
| ATR |
Set the take profit/stop loss orders *N* average true ranges away from the closing price preceding the entry of a long/short order, where *N* is a specified multiplier.
|
| Forecast |
(Only available for take profits orders) Use a percentile of a returned forecast to set take profits. Forecasts must be enabled in order for this to work.
|
| Trailing Stop |
(Only available for stop loss orders) Enable a percentage-based trailing stop. A position will be exited if the price reaches the trailing stop.
|
The average true range used to set take profits/stop losses orders uses a period of 200 bars.
### Trailing Stop [#trailing-stop]

Users can use a percentage-based trailing stop to exit positions. The trailing stop will move in the direction of interest if its distance with the low price (in case of long positions) or high price (in case of short positions) is greater than the specified percentage.
### Take Profits Levels From Forecast [#take-profits-levels-from-forecast]
When forecasts are displayed, users can set take profits using the **nth** percentile of a returned forecast. This can be done from the "TPS & SLS" settings, by selecting "Forecast" in the "Long TP" and/or "Short TP".
The numerical setting selected at the right of the drop-down menus determines the percentile used, and should be set within the range \[0, 100] in order to work. Percentiles values can affect the returned levels as follows:
* In case of a long trade, a lower set percentile will return take profits closer to the entry price, potentially triggering sooner.
* In case of a short trade, a lower set percentile will return take profits further away from the entry price, potentially triggering later.
Do note that because forecasts are based on the strategy entries, take profits levels based on it can be subject to repainting, except when using a backtesting window based on a date.
# Actions (/docs/ai-backtesting/backtesters/strategy-scripting/actions)
**Actions** are elements tied to a user set condition producing a specific effect when the assigned condition is true.
Actions have the structure `@keyword()`, starting with `@`, with an identifier, and `()`.
Some actions can have a condition assigned to them using `=`. When the assigned condition is true the action will trigger.
Like functions in classical programming languages, actions can have arguments located within `()`, adding further degrees of control over the action.
Actions used for scripted alerts are also available for scripted strategies, however, this page only lists the actions that are exclusively used for scripted strategies.
To see a list of other actions, see [scripted alerts actions](/docs/toolkits/alert-scripting/actions-methods)
***
## @long [#long]
The `@long` action allows entering a long position when the associated condition is true.
### Syntax [#syntax]
```js
@long(limit, stop, alert_message)
```
### Arguments [#arguments]
**limit** (float): Optional. Limit price for the order. Accepts data placeholders as values. If specified, a limit order is created.
**stop** (float): Optional. Stop price for the order. Accepts data placeholders as values. If specified, a stop order is created.
If both `limit` and `stop` are specified, a stop-limit order is created.
**alert\_message** (string): Optional. Alert message sent when the order is opened. Data placeholders can be used within the message, these will be replaced by their corresponding value when the alert triggers.
### Examples [#examples]
```js
// Go long when the price is greater than the opening price
@long() = {close} > {open}
```
```js
// Go long with a limit order at the previous high
@long(limit = {high[1]}) = {close} > {open}
```
```js
// Go long with a stop order at the previous low
@long(stop = {low[1]}) = {close} > {open}
```
```js
// Go long with a stop-limit order
@long(limit = {high[1]}, stop = {low[1]}) = {close} > {open}
```
```js
// Go long with an alert message containing the entry price
@long(alert_message = "Long entry at {close}") = {close} > {open}
```
### Remarks [#remarks]
By default a long position is entered at the opening of the next bar. Using "fill on bar close" from the settings in **PROPERTIES** → **FILL ORDERS** will open a position at the close of the bar the condition is true.
***
## @short [#short]
The `@short` action allows entering a short position when the associated condition is true.
### Syntax [#syntax-1]
```js
@short(limit, stop, alert_message)
```
### Arguments [#arguments-1]
**limit** (float): Optional. Limit price for the order. Accepts data placeholders as values. If specified, a limit order is created.
**stop** (float): Optional. Stop price for the order. Accepts data placeholders as values. If specified, a stop order is created.
If both `limit` and `stop` are specified, a stop-limit order is created.
**alert\_message** (string): Optional. Alert message sent when the order is opened. Data placeholders can be used within the message, these will be replaced by their corresponding value when the alert triggers.
### Examples [#examples-1]
```js
// Go short when the price is lower than the opening price
@short() = {close} < {open}
```
```js
// Go short with a limit order at the previous low
@short(limit = {low[1]}) = {close} < {open}
```
```js
// Go short with a stop order at the previous high
@short(stop = {high[1]}) = {close} < {open}
```
```js
// Go short with a stop-limit order
@short(limit = {low[1]}, stop = {high[1]}) = {close} < {open}
```
```js
// Go short with an alert message containing the entry price
@short(alert_message = "Short entry at {close}") = {close} < {open}
```
### Remarks [#remarks-1]
By default a short position is entered at the opening of the next bar. Using "fill on bar close" from the settings in **PROPERTIES** -> **FILL ORDERS** will open a position at the close of the bar the condition is true.
***
## @exit\_long [#exit_long]
The `@exit_long` action closes all open **long** positions when the associated condition is true.
### Syntax [#syntax-2]
```js
@exit_long(qty, alert_message)
```
### Arguments [#arguments-2]
**qty** (float): Optional. Number of contracts/lots/shares/units to close on exit for a long position. If the character `%` is present, the specified % of the long position is closed. If not provied the entire position is closed.
**alert\_message** (string): Optional. Alert message sent when the order is closed. Data placeholders can be used within the message, these will be replaced by their corresponding value when the alert triggers.
### Examples [#examples-2]
```js
// Exit long position when price is below the price 14 bars ago
@exit_long() = {close} < {close[14]}
```
```js
// Exit 50 contracts/lots/shares/units from the long position
// when price is below the price 14 bars ago
@exit_long(50) = {close} < {close[14]}
```
```js
// Exit 50% of the long position
// when price is below the price 14 bars ago
@exit_long(50%) = {close} < {close[14]}
```
```js
// Exit long position with an alert message containing the exit price
@exit_long(alert_message = "Long exit at {close}") = {close} < {close[14]}
```
### Remarks [#remarks-2]
By default, a long position is exited at the opening of the next bar. You can enable "fill on bar close" from **PROPERTIES** → **FILL ORDERS** to trigger the exit at the bar close instead.
***
## @exit\_short [#exit_short]
The `@exit_short` action closes all open **short** positions when the associated condition is true.
### Syntax [#syntax-3]
```js
@exit_short(qty, alert_message)
```
### Arguments [#arguments-3]
**qty** (float): Optional. Number of contracts/lots/shares/units to close on exit for a short position. If the character `%` is present, the specified % of the short position is closed. If not provied the entire position is closed.
**alert\_message** (string): Optional. Alert message sent when the order is closed. Data placeholders can be used within the message, these will be replaced by their corresponding value when the alert triggers.
### Examples [#examples-3]
```js
// Exit short position when the high price is above previous low price
@exit_short() = {high} > {low[1]}
```
```js
// Exit 50 contracts/lots/shares/units from the short position
// when the high price is above previous low price
@exit_short(50) = {high} > {low[1]}
```
```js
// Exit 50% of the short position
// when the high price is above previous low price
@exit_short(50%) = {high} > {low[1]}
```
```js
// Exit short position with an alert message containing the exit price
@exit_short(alert_message = "Short exit at {close}") = {high} > {low[1]}
```
### Remarks [#remarks-3]
By default, a short position is exited at the opening of the next bar. To exit at the close of the bar where the condition is true, enable "fill on bar close" from **PROPERTIES** → **FILL ORDERS**.
***
## @exit\_all [#exit_all]
The `@exit_all` action closes **all open positions** (long or short and scripted/unscripted) when the associated condition is true.
### Syntax [#syntax-4]
```js
@exit_all()
```
### Examples [#examples-4]
```js
// Exit all positions when the closing price is above the previous high price
@exit_all() = {close} > {high[1]}
```
### Remarks [#remarks-4]
This exits both scripted long and short positions, but also any other long/short condition you may have set.
By default, the exit occurs at the next bar’s open unless "fill on bar close" is enabled in **PROPERTIES** → **FILL ORDERS**.
***
## @start\_date [#start_date]
The `@start_date` action determines the starting date of the scripted strategy evaluation using a Datestring placeholder.
### Syntax [#syntax-5]
```js
@start_date({YYYY-MM-DDThh:mm:ss±hh:mm})
```
### Arguments [#arguments-4]
**datestring**: Datestring placeholder, must comply with the ISO 8061 standard. The time and timezone are optional.
### Examples [#examples-5]
```js
@long = {close} > {open}
@short = {close} < {open}
// Only evaluate the strategy starting 2025
@start_date({2025-01-01})
```
### Remarks [#remarks-5]
The **Timezone** setting does not affect this placeholder. Default timezone for this placeholder is UTC-0.
***
## @end\_date [#end_date]
The `@end_date` action determines the starting date of the scripted strategy evaluation using a Datestring placeholder.
### Syntax [#syntax-6]
```js
@end_date({YYYY-MM-DDThh:mm:ss±hh:mm})
```
### Arguments [#arguments-5]
**datestring**: Datestring placeholder, must comply with the ISO 8061 standard. The time and timezone are optional.
### Examples [#examples-6]
```js
@long = {close} > {open}
@short = {close} < {open}
// Only evaluate the strategy prior to 2025
@end_date({2025-01-01})
```
### Remarks [#remarks-6]
The **Timezone** setting does not affect this placeholder. Default timezone for this placeholder is UTC-0.
***
## @only\_scripted [#only_scripted]
The `@only_scripted` action determines if only scripted entries/exits should be considered during the backtest. If `true` it will ignore any other entry condition set in the other Backtester settings.
### Syntax [#syntax-7]
```js
@only_scripted()
```
### Examples [#examples-7]
```js
// Only use the scripted strategy for the backtest
@only_scripted() = true
```
# Strategy Scripting (/docs/ai-backtesting/backtesters/strategy-scripting/introduction)
Strategy Scripting is a feature within each of our 3 Backtesters that allows users to create and backtests strategies using our own scripting language. This feature works just like [alert scripting](/docs/toolkits/alert-scripting/introduction) but is adjusted toward backtesting.
To better learn about Strategy Scripting, see the following pages:
Learn how to reference market and backtesting data when scripting strategies.
Learn about the operators you can use to compare data with each other.
Learn how to open, exit trades, and more using actions.
Use any condition from any external LuxAlgo toolkit in your scripted strategy with LUCID connectors.
# LUCID Connectors (/docs/ai-backtesting/backtesters/strategy-scripting/lucid-connectors)
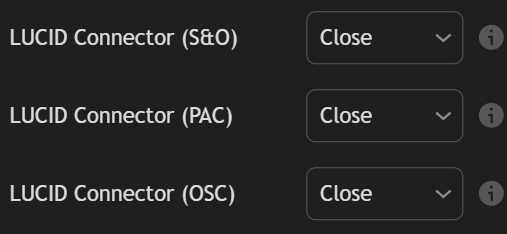
LUCID (LuxAlgo Universal Conditions Identifier) connectors are identifiers used to share the **trigger placeholders** from toolkits directly to any Backtester by simply using them as a source in the appropriate inputs.
One usage of LUCID connectors is being able to backtest strategies based on both the Signals & Overlays™ indicators and Oscillator Matrix™ using the PAC Backtester.
LUCID Connectors are only available starting from the following toolkit versions
* LuxAlgo® - Signals & Overlays™: 7.0
* LuxAlgo® - Price Action Concepts™: 3.0
* LuxAlgo® - Oscillator Matrix™: 7.0
And can be used only starting from the following Backtester versions:
* Backtester (S\&O): 3.0
* Backtester (PAC): 2.0
* Backtester (OSC): 2.0
## Connectors [#connectors]
Each toolkit connector can be identified from their name:
* **"LuxAlgo® - Signals & Overlays™: LUCID Connector"**
* **"LuxAlgo® - Price Action Concepts™: LUCID Connector"**
* **"LuxAlgo® - Oscillator Matrix™: LUCID Connector"**
## Available Placeholders [#available-placeholders]
Only the trigger placeholders of each toolkit are supported, to get a list of those placeholders see:
* [Signals & Overlays™ trigger placeholders](/docs/toolkits/alert-scripting/placeholders#trigger-placeholders)
* [Price Action Concepts™ trigger placeholders](/docs/toolkits/alert-scripting/placeholders#trigger-placeholders-2)
* [Oscillator Matrix™ trigger placeholders](/docs/toolkits/alert-scripting/placeholders#trigger-placeholders-3)
## How To Use [#how-to-use]
Let's suppose that we want to backtest a strategy with the following entry conditions:
* long: bullish CHoCH while the neo cloud is bullish and the market is trending
* short: bearish CHoCH while the neo cloud is bearish and the market is trending
For this example, we will use the PAC Backtester, as such we need the Signals & Overlays™ toolkit to share information about the Neo Cloud and Trend Strength indicators.
First, we can add the PAC Backtester and Signals & Overlays™ toolkit to our chart.
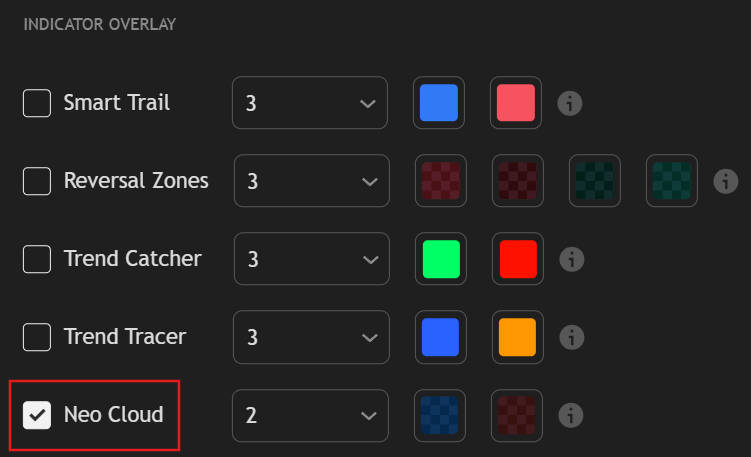
Once done, let's make sure the Neo Cloud overlay is enabled in the Signals & Overlays™ toolkit.
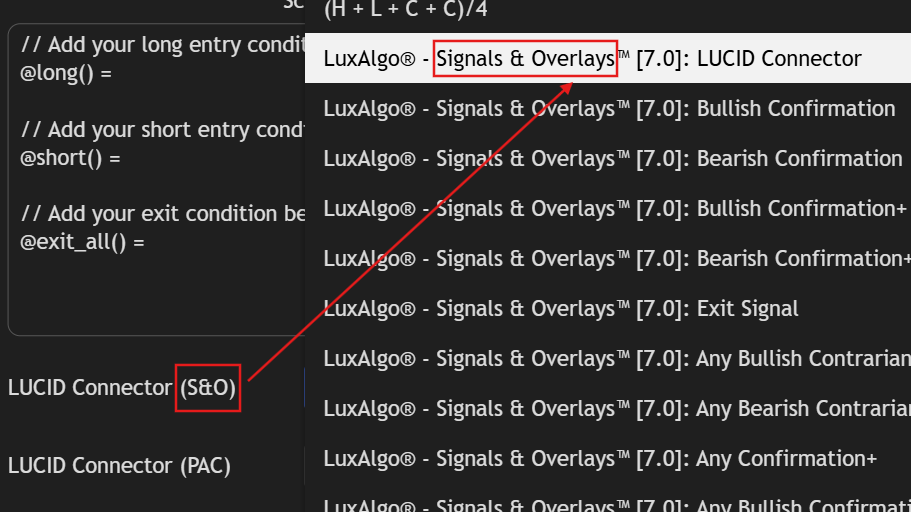
Once the Neo Cloud is enabled, go to the PAC Backtester settings, locate the **CONDITIONS (ADVANCED)** section, then locate the **LUCID Connector (S\&O)** setting, open its dropdown and select **"LuxAlgo® - Signals & Overlays™: LUCID Connector"**.
When using the LUCID connector of a specific toolkit make sure to select it from the correct input setting.
For example having in the **LUCID Connector (S\&O)** setting the LUCID connector for the Price Action Concepts™ toolkit **"LuxAlgo® - Price Action Concepts™: LUCID Connector"** will result in unexpected results.
Now we simply need to script our strategies. THe PAC Backtester already includes placeholders for bullish and bearish CHoCH's, `{bullish_choch}` and `{bearish_choch}`. For the Signals & Overlays, the trigger placeholders of interest are `{bullish_neo}`, `{bearish_neo}`, and `{trend_strength_trending}`,
This leads to the following scripted strategy:
```js
// Add your long entry condition below
@long() = {bullish_choch} and {bullish_neo} and {trend_strength_trending}
// Add your short entry condition below
@short() = {bearish_choch} and {bearish_neo} and {trend_strength_trending}
```
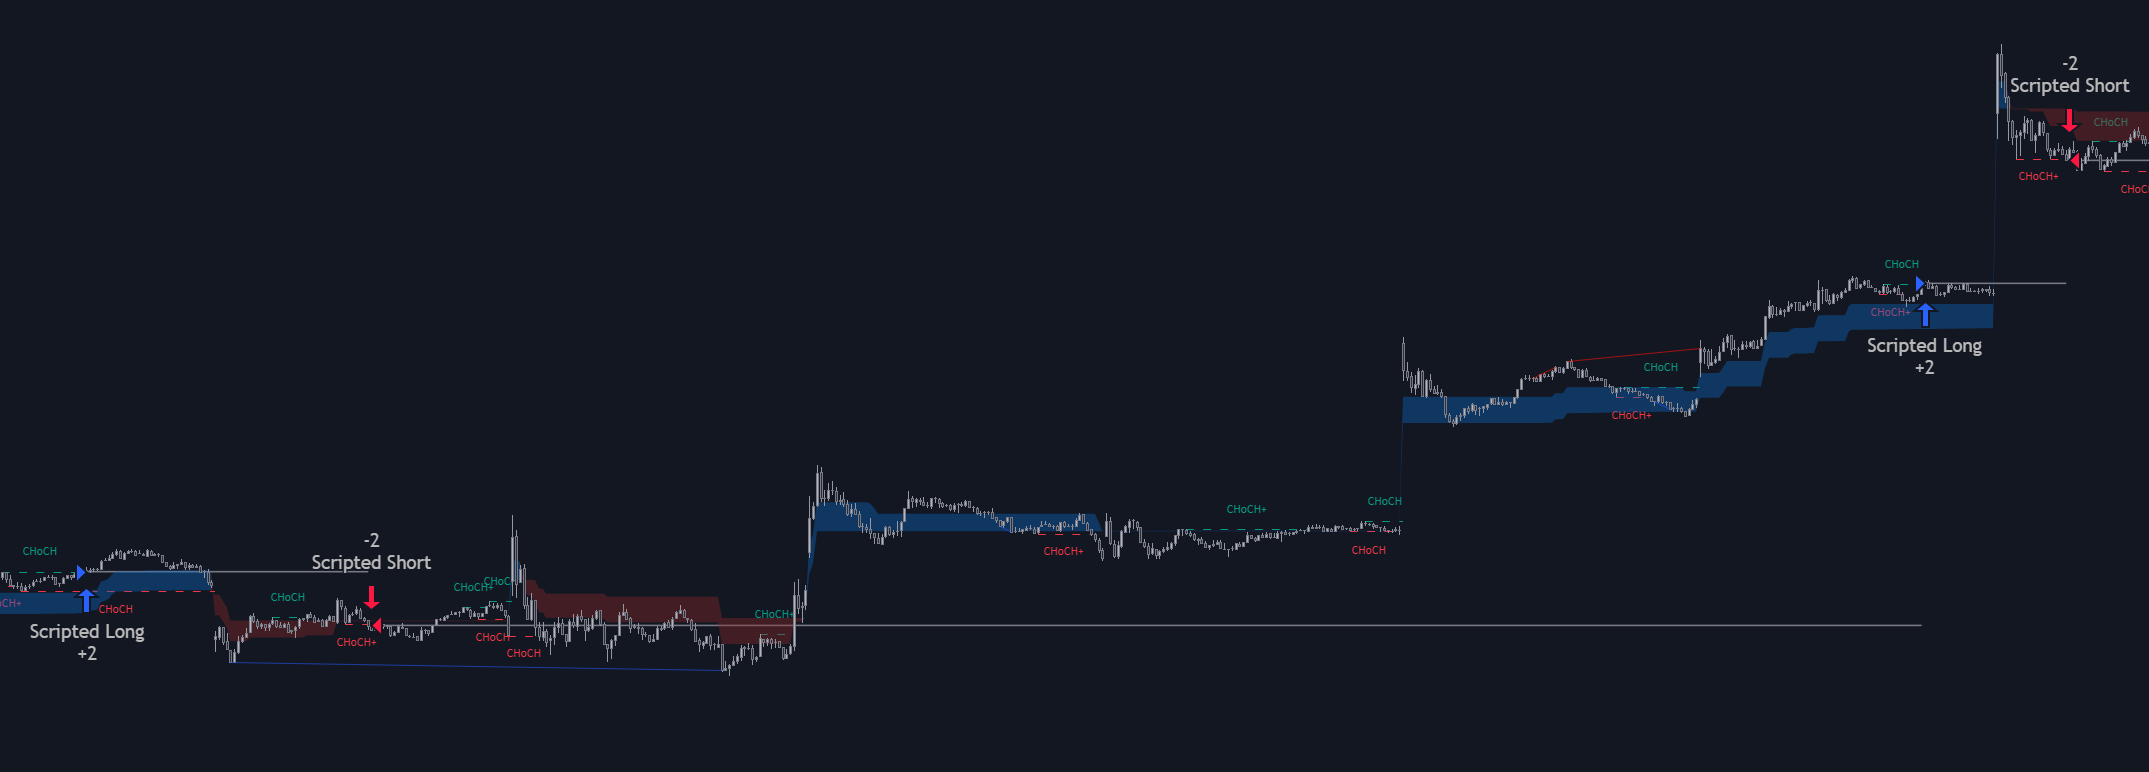
As we can see above we are indeed filtering CHoCH's with the help of the Signals & Overlays.
# Placeholders (/docs/ai-backtesting/backtesters/strategy-scripting/placeholders)
Placeholders are strings that refer to a specific series of values or events, and have the form `{placeholder_title}`, where `placeholder_title` is the name of the placeholder to access and `{}` makes sure the string is recognized as a placeholder.
With scripted strategies, placeholders allow accessing market data such as ohlc prices, volume, but also strategy data such as net profit, winrate, entry prices...etc.
## Market Data Placeholders [#market-data-placeholders]
Market data placeholder allows referencing typical market data such as ohlc prices and volume.
These placeholders are available for all toolkits.
| Placeholder | Description |
| ----------- | ------------------------------------------------------------- |
| `{open}` | Open price of the bar |
| `{high}` | High price of the bar |
| `{low}` | Low price of the bar |
| `{close}` | Close price of the bar |
| `{hl2}` | Median price `(high + low) / 2` |
| `{ohlc4}` | Average price `(open + high + low + close) / 4` |
| `{hlc3}` | Typical price `(high + low + close) / 3` |
| `{hlcc4}` | Weighted average of hlc prices `(high + low + 2 * close) / 4` |
| `{volume}` | Volume for the bar |
| `{range}` | Difference between High and Low prices |
| `{tr}` | True Range |
## Time Related Placeholders [#time-related-placeholders]
Time placeholder allows referencing time related information such as the bar hour and minute, day, bar index...etc.
These placeholders are available for all toolkits.
| Placeholder | Description |
| ----------------------------- | ------------------------------------------------------------------------------------------------------------------------------------------------------------- |
| `{barindex}` | Index of the current bar |
| `{last_barindex}` | Index of the most recent bar |
| `{second}` | Current bar second |
| `{minute}` | Current bar minute |
| `{hour}` | Current bar hour |
| `{dayofweek}` | Current bar day of the week ranging from 1 to 7, with 1 for sunday |
| `{dayofmonth}` | Current bar day of the month |
| `{weekofyear}` | Current bar week of the year |
| `{month}` | Current bar month of the year |
| `{year}` | Current bar year (with timezone) |
| `{time}` | Unix timestamp of the bar |
| `{unix_ts}` | Unix timestamp of the bar (Deprecated, use `{time}`) |
| `{timeframe}` | Chart timeframe in minutes |
| `{hhmm-hhmm}` | Session placeholder, `True` when the bar is located within the specific session interval, see [here](./placeholders#session-placeholder) for more information |
| `{YYYY-MM-DDThh:mm:ss±hh:mm}` | Datestring placeholder, equal to the timestamp of the specified date, see [here](./placeholders#datestring-placeholder) for more information |
Note that `{dayofweek}` returns the day based on the time of the bar's open. For overnight sessions (e.g. EURUSD, where Monday session starts on Sunday, 17:00) this value can be lower by 1 than the day of the trading day.
The timezone for the time related placeholders (with the exception of `time`, and the datestring placeholder) is defined by the `Timezone` dropdown setting, defining the timezone using UTC. Default value is `exchange`, which uses the exchange timezones to get the value of the time related placeholders.
### Datestring Placeholder [#datestring-placeholder]
You can easily define dates and optionally th time and timezone using the **Datestring** placeholder, following the ISO 8601 standard. The syntax of the placeholder is as follows:
```text Example
{YYYY-MM-DDThh:mm:ss±hh:mm}
```
* `YYYY`: Year
* `MM`: Month
* `DD`: Day
* `hh`: Hour
* `mm`: Minute
* `±hh:mm`: Timezone offset, default timezone is UTC-0 (optional)
The **Datestring** placeholder is not affected by the **Timezone** setting
This placeholder can be useful alongside `{time}` to constraint the evaluation of conditions to a specific date interval. For example:
```text Example
{close} > {open} and {time} >= {2025-01-01}
```
The above script will only trigger if the closing price is above the opening price while the time is on or after January 1st, 2025.
Dates and times are separated by `T`, for example `{2025-01-01T04:00}`. `±hh:mm` can be used to offset the timezones, as such if the timezone of interest is the New York timezone (UTC-4), we would use:
```text Example
{2025-01-01T04:00-04:00}
```
### Session Placeholder [#session-placeholder]
You can easily detect if the current bar is within a specific session (time interval) by using the session placeholder with pattern `{hhmm-hhmm}`, where `hh` is the hour and `mm` the minute.
The value of this placeholder will be `True` when the bar time is located between the start time `{hhmm-` and end time `-hhmm}`.
For example, if we want to detect when the bar is located in the session starting at 14:30 and ending at 16:45 we would simply use:
```python Example
{1430-1645}
```
## Strategy Statistics Placeholders [#strategy-statistics-placeholders]
It is possible to use the actual strategy results made over time as part of our entry or exit conditions using the following data placeholders:
| Placeholder | Description |
| ------------------------ | ------------------------------------------- |
| `{entry_price}` | Average entry price of the current position |
| `{net_profit}` | Total net profit from all closed trades |
| `{equity}` | Current equity including open trades |
| `{open_profit}` | Unrealized profit/loss of open trades |
| `{gross_profit}` | Total gross profit from winning trades |
| `{gross_loss}` | Total gross loss from losing trades |
| `{gross_profit_percent}` | Gross profit expressed as a percentage |
| `{gross_loss_percent}` | Gross loss expressed as a percentage |
| `{profit_factor}` | Ratio of gross profit to gross loss |
| `{winrate}` | Percentage of closed trades that were wins |
| `{closed_trades}` | Number of closed trades |
| `{open_trades}` | Number of currently open trades |
| `{win_trades}` | Number of winning closed trades |
| `{loss_trades}` | Number of losing closed trades |
| `{avg_trade}` | Average profit/loss per trade |
| `{avg_winning_trade}` | Average profit of winning trades |
| `{avg_losing_trade}` | Average loss of losing trades |
| `{max_drawdown}` | Maximum drawdown in account value |
| `{max_drawdown_percent}` | Max drawdown expressed as a percentage |
| `{max_runup}` | Maximum runup in account value |
| `{max_runup_percent}` | Max runup expressed as a percentage |
| `{position_size}` | Current position size |
## External Placeholders [#external-placeholders]

Users can refer to a series of values outside the toolkit by using external placeholder. A maximum of 3 external placeholders can be used:
* `{external1}`
* `{external2}`
* `{external3}`
In order to use external placeholders, users must first select the external source from the provided dropdowns located in the Strategy Scripting settings. Once selected, external sources can be referred from their respective placeholders.
## User Defined Placeholders (UDP) [#user-defined-placeholders-udp]
User defined placeholders (UDPs) are custom placeholders defined by users and assigned to a specific condition set by the user. These placeholders can later be referenced as part of other conditions or UDPs.
To define an UDP a line must start with a placeholder with a unique name, followed by an equal sign `=`, then followed by the condition we want to assign to this placeholder, for example `{my_placeholder} = {close} > {open}`
Let's take a more complex example and say we want to go long on a new bullish fair value gap while we also had one on the previous bar.
Doing this could involve a long and messy script, to make things easier we can create an UDP that refers to the condition of a bullish fair value gaps:
```
{bull_fvg} = {low} > {high[2]} and {close[1]} > {high[2]}
@long() = {bull_fvg} and {bull_fvg[1]}
```
## Backtester Trigger Placeholders [#backtester-trigger-placeholders]
The trigger placeholders below are unique to their respective Backtesters, and refer to their respective features.
### Backtester (S\&O) Trigger Placeholders [#backtester-so-trigger-placeholders]
| Placeholder | Description |
| ------------------------------ | ----------------------------------------------------------------------------- |
| `{bullish_confirmation}` | `True` on a new normal bullish confirmation signal |
| `{bullish_confirmation+}` | `True` on a new strong bullish confirmation signal |
| `{bullish_confirmation_any}` | `True` on a any new bullish confirmation signal |
| `{bullish_confirmation_turn+}` | `True` when a normal bullish confirmation signal turns strong |
| `{bearish_confirmation}` | `True` on a new normal bearish confirmation signal |
| `{bearish_confirmation+}` | `True` on a new strong bearish confirmation signal |
| `{bearish_confirmation_any}` | `True` on any new bearish confirmation signal |
| `{bearish_confirmation_turn+}` | `True` when a normal bearish confirmation signal turns strong |
| `{bullish_contrarian}` | `True` on a new normal bullish contrarian signal |
| `{bullish_contrarian+}` | `True` on a new strong bullish contrarian signal |
| `{bullish_contrarian_any}` | `True` on any new bullish contrarian signal |
| `{bearish_contrarian}` | `True` on a new normal bearish contrarian signal |
| `{bearish_contrarian+}` | `True` on a new strong bearish contrarian signal |
| `{bearish_contrarian_any}` | `True` on any new bearish contrarian signal |
| `{confirmation_exits}` | `True` on a new exit buy or sell confirmation signal |
| `{contrarian_exits}` | `True` on a new exit buy or sell contrarian signal |
| `{exit_sell}` | `True` on a new exit sell signal |
| `{bullish_smart_trail}` | `True` if Smart Trail is up-trending |
| `{bearish_smart_trail}` | `True` if Smart Trail is down-trending |
| `{switch_bullish_smart_trail}` | `True` if Smart Trail switches to bullish |
| `{switch_bearish_smart_trail}` | `True` if Smart Trail switches to bearish |
| `{price_above_rzr1}` | `True` if the closing price is above the lower Reversal Zones resistance R1 |
| `{price_below_rzs1}` | `True` if the closing price is below the upper Reversal Zones support S1 |
| `{price_co_rzr1}` | `True` if the closing price cross over the lower Reversal Zones resistance R1 |
| `{price_cu_rzs1}` | `True` if the closing price cross under the upper Reversal Zones support S1 |
| `{bullish_catcher}` | `True` if Trend Catcher is up-trending |
| `{bearish_catcher}` | `True` if Trend Catcher is down-trending |
| `{switch_bullish_catcher}` | `True` if Trend Catcher switches to bullish |
| `{switch_bearish_catcher}` | `True` if Trend Catcher switches to bearish |
| `{bullish_tracer}` | `True` if Trend Tracer is up-trending |
| `{bearish_tracer}` | `True` if Trend Tracer is down-trending |
| `{switch_bullish_tracer}` | `True` if Trend Tracer switches to bullish |
| `{switch_bearish_tracer}` | `True` if Trend Tracer switches to bearish |
| `{bullish_neo}` | `True` if Neo Cloud is up-trending |
| `{bearish_neo}` | `True` if Neo Cloud is down-trending |
| `{switch_bullish_neo}` | `True` if Neo Cloud switches to bullish |
| `{switch_bearish_neo}` | `True` if Neo Cloud switches to bearish |
| `{confirmation_uptrend}` | `True` when confirmation signal indicates an uptrend |
| `{confirmation_downtrend}` | `True` when confirmation signal indicates a downtrend |
| `{contrarian_uptrend}` | `True` when contrarian signal indicates an uptrend |
| `{contrarian_downtrend}` | `True` when contrarian signal indicates a downtrend |
| `{trend_strength_trending}` | `True` when trend strength indicates a trending market (above 50) |
| `{trend_strength_ranging}` | `True` when trend strength indicates a ranging market (under 50) |
| `{confirmation_exits}` | `True` when confirmation-based exit condition is met |
| `{contrarian_exits}` | `True` when contrarian-based exit condition is met |
| `{price_cross_rz_avg}` | `True` when price crosses the average of The Reversal Zones |
### Backtester (PAC) Trigger Placeholders [#backtester-pac-trigger-placeholders]
| Placeholder | Description |
| --------------------------- | --------------------------------------------------------- |
| `{bullish_choch}` | `True` when a bullish Change of Character (CHoCH) occurs |
| `{bearish_choch}` | `True` when a bearish Change of Character (CHoCH) occurs |
| `{bullish_bos}` | `True` when a bullish Break of Structure (BOS) occurs |
| `{bearish_bos}` | `True` when a bearish Break of Structure (BOS) occurs |
| `{bullish_trend}` | `True` when market structure trend is bullish |
| `{bearish_trend}` | `True` when market structure trend is bearish |
| `{bullish_ob_exited}` | `True` when price exits a bullish order block |
| `{bearish_ob_exited}` | `True` when price exits a bearish order block |
| `{bullish_new_fvg}` | `True` on detection of a new bullish Fair Value Gap (FVG) |
| `{bearish_new_fvg}` | `True` on detection of a new bearish Fair Value Gap (FVG) |
| `{bullish_fvg_mitigated}` | `True` when bullish FVG is mitigated |
| `{bearish_fvg_mitigated}` | `True` when bearish FVG is mitigated |
| `{bullish_fvg_entered}` | `True` when price enters bullish FVG |
| `{bearish_fvg_entered}` | `True` when price enters bearish FVG |
| `{bullish_fvg_within}` | `True` when price is within bullish FVG |
| `{bearish_fvg_within}` | `True` when price is within bearish FVG |
| `{bullish_fvg_exited}` | `True` when price exits bullish FVG |
| `{bearish_fvg_exited}` | `True` when price exits bearish FVG |
| `{bullish_new_ifvg}` | `True` on detection of a new bullish Inverse FVG |
| `{bearish_new_ifvg}` | `True` on detection of a new bearish Inverse FVG |
| `{bullish_ifvg_mitigated}` | `True` when bullish Inverse FVG is mitigated |
| `{bearish_ifvg_mitigated}` | `True` when bearish Inverse FVG is mitigated |
| `{bullish_ifvg_entered}` | `True` when price enters bullish Inverse FVG |
| `{bearish_ifvg_entered}` | `True` when price enters bearish Inverse FVG |
| `{bullish_ifvg_within}` | `True` when price is within bullish Inverse FVG |
| `{bearish_ifvg_within}` | `True` when price is within bearish Inverse FVG |
| `{bullish_ifvg_exited}` | `True` when price exits bullish Inverse FVG |
| `{bearish_ifvg_exited}` | `True` when price exits bearish Inverse FVG |
| `{bullish_new_dfvg}` | `True` on detection of a new bullish Double FVG |
| `{bearish_new_dfvg}` | `True` on detection of a new bearish Double FVG |
| `{bullish_dfvg_mitigated}` | `True` when bullish Double FVG is mitigated |
| `{bearish_dfvg_mitigated}` | `True` when bearish Double FVG is mitigated |
| `{bullish_dfvg_entered}` | `True` when price enters bullish Double FVG |
| `{bearish_dfvg_entered}` | `True` when price enters bearish Double FVG |
| `{bullish_dfvg_within}` | `True` when price is within bullish Double FVG |
| `{bearish_dfvg_within}` | `True` when price is within bearish Double FVG |
| `{bullish_dfvg_exited}` | `True` when price exits bullish Double FVG |
| `{bearish_dfvg_exited}` | `True` when price exits bearish Double FVG |
| `{bullish_new_vi}` | `True` on detection of a new bullish Volume Imbalance |
| `{bearish_new_vi}` | `True` on detection of a new bearish Volume Imbalance |
| `{bullish_vi_mitigated}` | `True` when bullish Volume Imbalance is mitigated |
| `{bearish_vi_mitigated}` | `True` when bearish Volume Imbalance is mitigated |
| `{bullish_vi_entered}` | `True` when price enters bullish Volume Imbalance |
| `{bearish_vi_entered}` | `True` when price enters bearish Volume Imbalance |
| `{bullish_vi_within}` | `True` when price is within bullish Volume Imbalance |
| `{bearish_vi_within}` | `True` when price is within bearish Volume Imbalance |
| `{bullish_vi_exited}` | `True` when price exits bullish Volume Imbalance |
| `{bearish_vi_exited}` | `True` when price exits bearish Volume Imbalance |
| `{bullish_new_og}` | `True` on detection of a new bullish Opening Gap |
| `{bearish_new_og}` | `True` on detection of a new bearish Opening Gap |
| `{bullish_og_mitigated}` | `True` when bullish Opening Gap is mitigated |
| `{bearish_og_mitigated}` | `True` when bearish Opening Gap is mitigated |
| `{bullish_og_entered}` | `True` when price enters bullish Opening Gap |
| `{bearish_og_entered}` | `True` when price enters bearish Opening Gap |
| `{bullish_og_within}` | `True` when price is within bullish Opening Gap |
| `{bearish_og_within}` | `True` when price is within bearish Opening Gap |
| `{bullish_og_exited}` | `True` when price exits bullish Opening Gap |
| `{bearish_og_exited}` | `True` when price exits bearish Opening Gap |
| `{bullish_liquidity_grab}` | `True` on detection of a bullish liquidity grab |
| `{bearish_liquidity_grab}` | `True` on detection of a bearish liquidity grab |
| `{bullish_trendline_break}` | `True` on a bullish trendline break |
| `{bearish_trendline_break}` | `True` on a bearish trendline break |
### Backtester (OSC) Trigger Placeholders [#backtester-osc-trigger-placeholders]
| Placeholder | Description |
| --------------------------------------- | --------------------------------------------------- |
| `{regular_bullish_hyperwave_signal}` | `True` on a new regular bullish HyperWave signal |
| `{regular_bearish_hyperwave_signal}` | `True` on a new regular bearish HyperWave signal |
| `{oversold_bullish_hyperwave_signal}` | `True` on a new oversold bullish HyperWave signal |
| `{overbought_bearish_hyperwave_signal}` | `True` on a new overbought bearish HyperWave signal |
| `{hyperwave_co_80}` | `True` when HyperWave crosses over 80 |
| `{hyperwave_cu_20}` | `True` when HyperWave crosses under 20 |
| `{hyperwave_co_50}` | `True` when HyperWave crosses over 50 |
| `{hyperwave_cu_50}` | `True` when HyperWave crosses under 50 |
| `{hyperwave_above_80}` | `True` when HyperWave is above 80 |
| `{hyperwave_below_20}` | `True` when HyperWave is below 20 |
| `{hyperwave_above_50}` | `True` when HyperWave is above 50 |
| `{hyperwave_below_50}` | `True` when HyperWave is below 50 |
| `{moneyflow_co_50}` | `True` when Money Flow crosses over 50 |
| `{moneyflow_cu_50}` | `True` when Money Flow crosses under 50 |
| `{moneyflow_above_50}` | `True` when Money Flow is above 50 |
| `{moneyflow_below_50}` | `True` when Money Flow is below 50 |
| `{new_bullish_overflow}` | `True` on a new bullish Overflow signal |
| `{new_bearish_overflow}` | `True` on a new bearish Overflow signal |
| `{bullish_overflow}` | `True` if bullish Overflow is active |
| `{bearish_overflow}` | `True` if bearish Overflow is active |
| `{reversal_any_up}` | `True` on any new bullish reversal signal |
| `{reversal_any_down}` | `True` on any new bearish reversal signal |
| `{bullish_divergence}` | `True` on a new bullish divergence |
| `{bearish_divergence}` | `True` on a new bearish divergence |
| `{weak_bullish_confluence}` | `True` on a new weak bullish confluence |
| `{weak_bearish_confluence}` | `True` on a new weak bearish confluence |
| `{strong_bullish_confluence}` | `True` on a new strong bullish confluence |
| `{strong_bearish_confluence}` | `True` on a new strong bearish confluence |
# Elements (/docs/algos/screeners/osc/elements)
The Screener (OSC) supports various core features from the **Oscillator Matrix®**, each listed out below.
## Screener Elements [#screener-elements]
| Element | Description | Default |
| ---------- | ----------------------------------------------------------------------------------------------------------------------------------------------------------------- | -------- |
| Price | Most recent price value | Enabled |
| Volume | Most recent volume | Disabled |
| %Change | Most recent price percent change | Enabled |
| Change | Most recent price change | Disabled |
| Rating | Most recent ticker rating. The rating is given depending on the percentage of bullish information returned by all enabled screener elements for a specific ticker | Enabled |
| HWO Signal | Most recent HyperWave signal on the ticker | Enabled |
| Money Flow | Most recent Money Flow oscillator value on the ticker | Enabled |
| Overflow | Most recent Overflow value on the ticker | Enabled |
| HyperWave | Most recent Overflow value on the ticker | Enabled |
| Reversal | Most recent Reversal signal detected on the ticker | Enabled |
| Divergence | Most recent divergence detected between the associated ticker price and associated ticker HyperWave | Enabled |
| Confluence | Most recent confluence status detected on the ticker | Enabled |
Each element can be disabled/enabled from the screener settings.
## Ratings [#ratings]
The screener ratings indicate the confluence of all returned screener data for each individual ticker by measuring the percentage of bullish indications returned by the enabled screener elements. Ratings are determined as follows:
* ▲ Strong Bullish (more than 80% of the returned information is bullish)
* △ Bullish (60% to 80% of the returned information is bullish)
* ― Neutral (40% to 60% of the returned information is bullish)
* ▽ Bearish (20% to 60% of the returned information is bullish)
* ▼ Strong Bearish (less than 20% of the returned information is bullish)
## Indicator Settings [#indicator-settings]
Users can control the settings of the included indicators in the screener from their respective settings group, these include:
#### Smart Money Flow [#smart-money-flow]
* Main Length
* Smooth
#### HyperWave [#hyperwave]
* Main Length
* Signal & Signal Length
* Divergence Sensitivity
#### Reversals [#reversals]
* Reversal Factor
## Colors [#colors]
Users are able to change the color of the information returned by each element from the "Screener Elements" settings.
# Filtering (/docs/algos/screeners/osc/filtering)
From the "Screener Elements" settings users are able to filter out undesired information returned by the screener. This is done from the dropdown setting located on each "Screener Elements" settings.
Certain elements returning specific information from a list of supported options will have a filter allowing to select a precise option, while elements returning a value on the screener will make use of conditional operators (Above/Below).
Users can set a filtering condition on multiple elements, allowing them to display the tickers that respect the user set filtering conditions.
# Introduction (/docs/algos/screeners/osc/introduction)
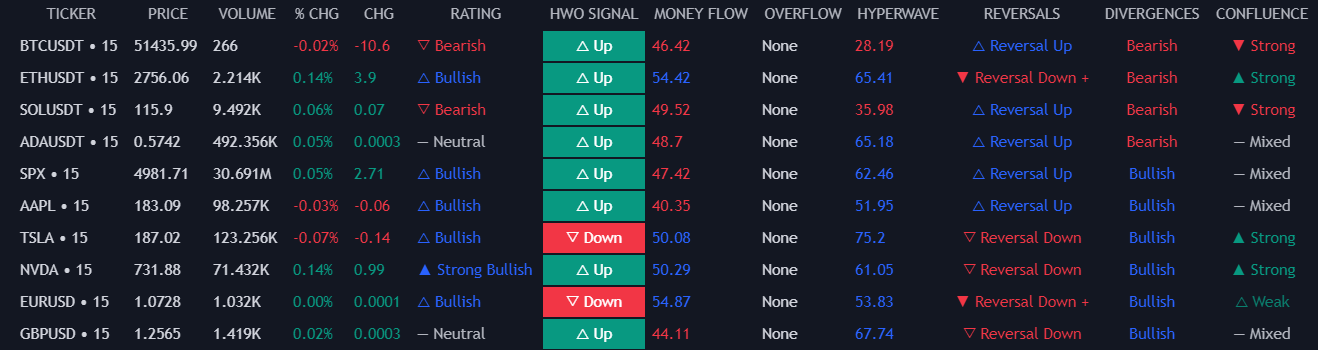
The Screener (OSC) is a useful tool able to return recent information from various features in the **Oscillator Matrix®** toolkit for up to 10 user set tickers with customizable timeframe.
In order to use the screener the best way possible it is first advised to fully understand the [Oscillator Matrix®](/docs/algos/oscillator-matrix/introduction) toolkit.
Provided below are pages describing all key features included.
Having access to the **Oscillator Matrix®** will automatically grant you access to the OSC screener.
## Tickers [#tickers]
Users can change tickers as well as their respective timeframes from the screener settings. Default tickers include:
* BTCUSDT
* ETHUSDT
* SOLUSDT
* ADAUSDT
* SPX
* AAPL
* TSLA
* NVDA
* EURUSD
* GBPUSD
The default timeframe used for all is the user chart timeframe. Supported tickers includes all tickers available on Tradingview (note that this availability can be affected by your Tradingview plan).
Users can also use the same ticker but different timeframes, allowing to perform multi timeframe analysis of the **Oscillator Matrix®** toolkit. However, duplicated tickers with the same timeframe will result in the duplicate ticker to not appear on the screener.
## Display [#display]
Users are offered a high degree of freedom when it comes to the placement of the screener. By default, the screener is located on a different pane, with the options to select the following positions:
* Top Center
* Top Right
* Top Left
* Bottom Center
* Bottom Right
* Bottom Left
It is also common for more compact screeners to be directly on the price chart, this is possible with this screener by drag and dropping it to the user chart, or by moving it to the existing pane above assuming the screener is in a pane below the price chart.
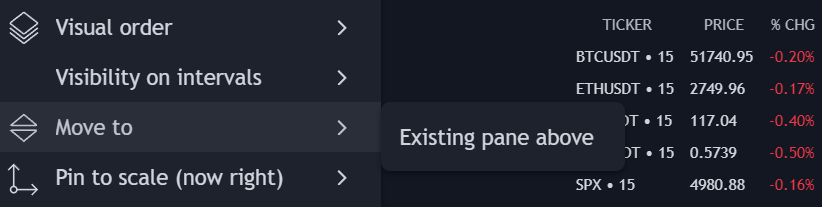
## Notes [#notes]
Tradingview is not a friendly environment when it comes to running more complete screeners, this cause various limitations showcased below:
### Computation [#computation]
The computation of a screener on Tradingview is very intensive, as such you can expect rare calculations timeouts. When this occurs simply force the screener recalculation by modifying one setting or adding the screener again to your chart.
### Inconsistency [#inconsistency]
It is possible to observe inconsistencies when observing the screener on a chart with a specific symbol due to screener tickers having being on different market.
The crypto market operates 24/7 while stock markets have opening and closing times, this can cause the screener to return different information when observing it from a cryptocurrency or stock/currency pair.
# Sorting (/docs/algos/screeners/osc/sorting)

Users can sort certain elements returning/or with an associated numerical information in either a descending or ascending order. This can be useful to see specific tickers first or last depending on the sorted data on the screener.
Supported elements for sorting include:
* Rating
* Money Flow
* HyperWave
* None
When "None" is selected the screener tickers appear as per their order in the Tickers settings.
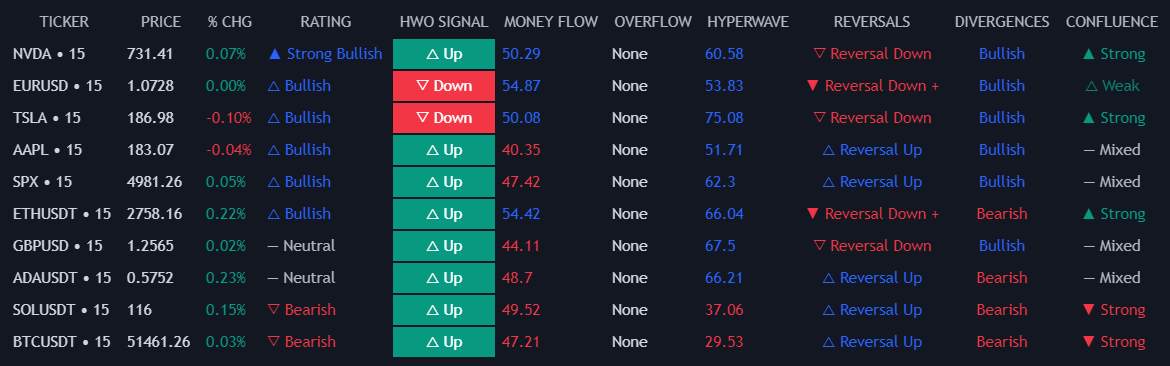
# Elements (/docs/algos/screeners/pac/elements)
The Screener (OSC) supports various core features from the **Price Action Concepts®**, each listed out below.
## Screener Elements [#screener-elements]
| Element | Description | Default |
| --------------- | ----------------------------------------------------------------------------------------------------------------------------------------------------------------- | -------- |
| Price | Most recent price value | Enabled |
| Volume | Most recent volume | Disabled |
| %Change | Most recent price percent change | Enabled |
| Change | Most recent price change | Disabled |
| Rating | Most recent ticker rating. The rating is given depending on the percentage of bullish information returned by all enabled screener elements for a specific ticker | Enabled |
| Structure | Most recent market structure returned on the ticker | Enabled |
| Order Block | Price position relative to the most recent Order Block area detected on the ticker | Enabled |
| Buy OB Volume | Buy volume associated to the most recently detected Order Block on the ticker | Disabled |
| Sell OB Volume | Sell volume associated to the most recently detected Order Block on the ticker | Disabled |
| OB Volume | Total volume associated to the most recently detected Order Block on the ticker | Enabled |
| Imbalances | Status of the most recent detected imbalance | Enabled |
| P\&D Zones | Price position relative to the most recent premium/equilibirum/discount zones on the ticker | Disabled |
| Liquidity Grabs | Most recent detected liquidity grab | Enabled |
| EQHL | Most recent detected equal high/low | Disabled |
Each element can be disabled/enabled from the screener settings.
## Ratings [#ratings]
The screener ratings indicate the confluence of all returned screener data for each individual ticker by measuring the percentage of bullish indications returned by the enabled screener elements. Ratings are determined as follows:
* ▲ Strong Bullish (more than 80% of the returned information is bullish)
* △ Bullish (60% to 80% of the returned information is bullish)
* ― Neutral (40% to 60% of the returned information is bullish)
* ▽ Bearish (20% to 60% of the returned information is bullish)
* ▼ Strong Bearish (less than 20% of the returned information is bullish)
## Indicator Settings [#indicator-settings]
Users can control the settings of the included indicators in the screener from the "Indicator Settings" settings group, these include:
* Market Structure Length
* Order Block Length
* Imbalance Type
* EQHL Period
## Colors [#colors]
Users are able to change the color of the information returned by each element from the "Screener Elements" settings.
# Filtering (/docs/algos/screeners/pac/filtering)
From the "Screener Elements" settings users are able to filter out undesired information returned by the screener. This is done from the dropdown setting located on each "Screener Elements" settings.
Certain elements returning specific information from a list of supported options will have a filter allowing to select a precise option, while elements returning a value on the screener will make use of conditional operators (Above/Below).
Users can set a filtering condition on multiple elements, allowing them to display the tickers that respect the user set filtering conditions.
# Introduction (/docs/algos/screeners/pac/introduction)
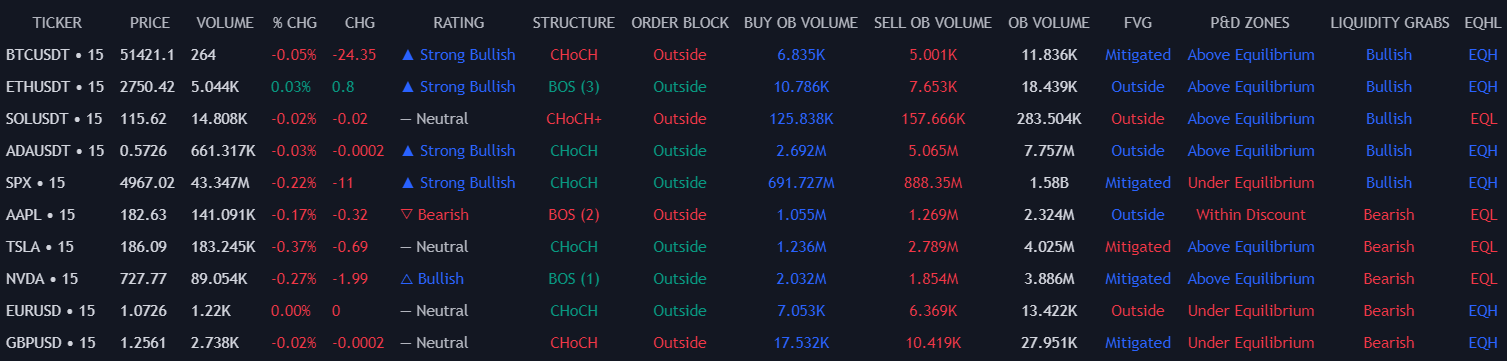
The Screener (PAC) is a useful tool able to return recent information from various features in the **Price Action Concepts®** toolkit for up to 10 user set tickers with customizable timeframe.
In order to use the screener the best way possible it is first advised to fully understand the [Price Action Concepts®](/docs/algos/price-action-concepts/introduction) toolkit.
Provided below are pages describing all key features included.
Having access to the **Price Action Concepts®** will automatically grant you access to the PAC screener.
## Tickers [#tickers]
Users can change tickers as well as their respective timeframes from the screener settings. Default tickers include:
* BTCUSDT
* ETHUSDT
* SOLUSDT
* ADAUSDT
* SPX
* AAPL
* TSLA
* NVDA
* EURUSD
* GBPUSD
The default timeframe used for all is the user chart timeframe. Supported tickers includes all tickers available on Tradingview (note that this availability can be affected by your Tradingview plan).
Users can also use the same ticker but different timeframes, allowing to perform multi timeframe analysis of the **Price Action Concepts®** toolkit. However, duplicated tickers with the same timeframe will result in the duplicate ticker to not appear on the screener.
## Display [#display]
Users are offered a high degree of freedom when it comes to the placement of the screener. By default, the screener is located on a different pane, with the options to select the following positions:
* Top Center
* Top Right
* Top Left
* Bottom Center
* Bottom Right
* Bottom Left
It is also common for more compact screeners to be directly on the price chart, this is possible with this screener by drag and dropping it to the user chart, or by moving it to the existing pane above assuming the screener is in a pane below the price chart.

## Notes [#notes]
Tradingview is not a friendly environment when it comes to running more complete screeners, this cause various limitations showcased below:
### Computation [#computation]
The computation of a screener on Tradingview is very intensive, as such you can expect rare calculations timeouts. When this occurs simply force the screener recalculation by modifying one setting or adding the screener again to your chart.
### Inconsistency [#inconsistency]
It is possible to observe inconsistencies when observing the screener on a chart with a specific symbol due to screener tickers having being on different market.
The crypto market operates 24/7 while stock markets have opening and closing times, this can cause the screener to return different information when observing it from a cryptocurrency or stock/currency pair.
# Sorting (/docs/algos/screeners/pac/sorting)

Users can sort certain elements returning/or with associated numerical information in either a descending or ascending order. This can be useful to see specific tickers first or last depending on the sorted data on the screener.
Supported elements for sorting include:
* Rating
* Structure
* Structure (Absolute)
* OB Volume
* OB Buy Volume
* OB Sell Volume
* None
When "None" is selected the screener tickers appear as per their order in the Tickers settings.

## Structure Sorting [#structure-sorting]
By default, sorting by **Structure** orders rows from the strongest **bearish** structures to the strongest **bullish** ones (and inversely if "Ascending" is toggled on).
The ranking used, from strongest to weakest, is:
* Higher consecutive BOS
* CHoCH+
* CHoCH
This same ranking is applied in both bearish and bullish directions.
### Structure (Absolute) Sorting [#structure-absolute-sorting]
The **Structure (Absolute)** option ignores the direction (bullish or bearish) and sorts all structures purely based on the previous ranking.
# Elements (/docs/algos/screeners/s-o/elements)
The Screener (S\&O) supports various core features from the **Signals & Overlays®**, each listed out below.
## Screener Elements [#screener-elements]
| Element | Description | Default |
| ---------------- | ----------------------------------------------------------------------------------------------------------------------------------------------------------------- | -------- |
| Price | Most recent price value | Enabled |
| Volume | Most recent volume | Disabled |
| %Change | Most recent price percent change | Enabled |
| Change | Most recent price change | Disabled |
| Rating | Most recent ticker rating. The rating is given depending on the percentage of bullish information returned by all enabled screener elements for a specific ticker | Enabled |
| Signal | Most recent confirmation or contrarian signal returned on the ticker | Enabled |
| Exits | Number of exits signals returned since the most recent signal | Enabled |
| Smart Trail | Current Smart Trail Status | Enabled |
| Reversal Zones | Current price position relative to Reversal Zones | Disabled |
| Trend Catcher | Current Trend Catcher Status | Enabled |
| Trend Tracer | Current Trend Tracer Status | Enabled |
| Neo Cloud | Current Neo Cloud Status | Disabled |
| Trend Strength | Current Trend Strength value | Enabled |
| Lux Volatility | Current Lux Volatility value | Enabled |
| Squeeze Index | Current Squeeze Index value | Enabled |
| Volume Sentiment | Current Volume Sentiment value | Disabled |
Each element can be disabled/enabled from the screener settings.
## Ratings [#ratings]
The screener ratings indicate the confluence of all returned screener data for each individual ticker by measuring the percentage of bullish indications returned by the enabled screener elements. Ratings are determined as follows:
* ▲ Strong Bullish (more than 80% of the returned information is bullish)
* △ Bullish (60% to 80% of the returned information is bullish)
* ― Neutral (40% to 60% of the returned information is bullish)
* ▽ Bearish (20% to 60% of the returned information is bullish)
* ▼ Strong Bearish (less than 20% of the returned information is bullish)
## Signal Settings [#signal-settings]
The most recent signal returned by the screener is affected by the "Signal" settings group. These settings allow changing the sensitivity of the signals as well as the signal algorithm, with users having the option to select Confirmation or Contrarian signals.
## Overlays Settings [#overlays-settings]
Overlay indicators screener elements are affected by their respective settings located in the "Overlays" settings group.
Each overlay has an associated setting affecting their output. These settings range from 1 to 5, with higher values allowing the overlay to return indications for longer-term trends.
## Colors [#colors]
Users are able to change the color of the information returned by each element from the "Screener Elements" settings.
# Filtering (/docs/algos/screeners/s-o/filtering)
From the "Screener Elements" settings users are able to filter out undesired information returned by the screener. This is done from the dropdown setting located on each "Screener Elements" settings.
Certain elements returning specific information from a list of supported options will have a filter allowing to select a precise option, while elements returning a value on the screener will make use of conditional operators (Above/Below), except the Lux Volatility.
Users can set a filtering condition on multiple elements, allowing them to display the tickers that respect the user set filtering conditions.
# Introduction (/docs/algos/screeners/s-o/introduction)
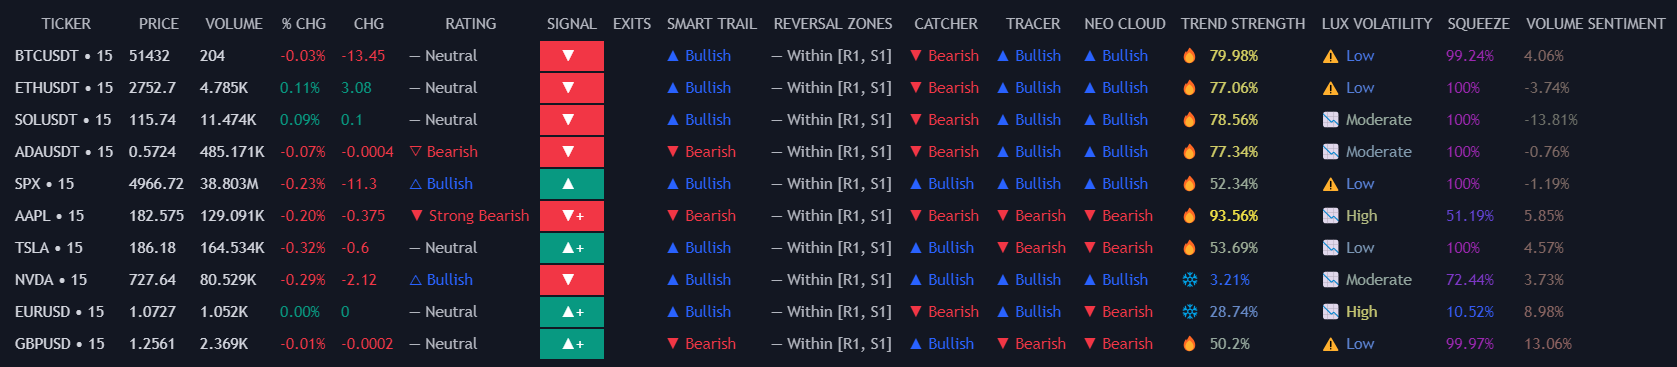
The Screener (S\&O) is a useful tool able to return recent information from various features in the **Signals & Overlays®** toolkit for up to 10 user set tickers with customizable timeframe.
In order to use the screener the best way possible it is first advised to fully understand the [Signals & Overlays®](/docs/algos/signals-overlays/introduction) toolkit.
Provided below are pages describing all key features included.
Having access to the **Signals & Overlays®** will automatically grant you access to the S\&O screener.
## Tickers [#tickers]
Users can change tickers as well as their respective timeframes from the screener settings. Default tickers include:
* BTCUSDT
* ETHUSDT
* SOLUSDT
* ADAUSDT
* SPX
* AAPL
* TSLA
* NVDA
* EURUSD
* GBPUSD
The default timeframe used for all is the user chart timeframe. Supported tickers includes all tickers available on Tradingview (note that this availability can be affected by your Tradingview plan).
Users can also use the same ticker but different timeframes, allowing to perform multi timeframe analysis of the **Signals & Overlays®** toolkit. However, duplicated tickers with the same timeframe will result in the duplicate ticker to not appear on the screener.
## Display [#display]
Users are offered a high degree of freedom when it comes to the placement of the screener. By default, the screener is located on a different pane, with the options to select the following positions:
* Top Center
* Top Right
* Top Left
* Bottom Center
* Bottom Right
* Bottom Left
It is also common for more compact screeners to be directly on the price chart, this is possible with this screener by drag and dropping it to the user chart, or by moving it to the existing pane above assuming the screener is in a pane below the price chart.

## Notes [#notes]
Tradingview is not a friendly environment when it comes to running more complete screeners, this cause various limitations showcased below:
### Computation [#computation]
The computation of a screener on Tradingview is very intensive, as such you can expect rare calculations timeouts. When this occurs simply force the screener recalculation by modifying one setting or adding the screener again to your chart.
### Inconsistency [#inconsistency]
It is possible to observe inconsistencies when observing the screener on a chart with a specific symbol due to screener tickers having being on different market.
The crypto market operates 24/7 while stock markets have opening and closing times, this can cause the screener to return different information when observing it from a cryptocurrency or stock/currency pair.
# Sorting (/docs/algos/screeners/s-o/sorting)

Users can sort certain elements returning/or with an associated numerical information in either a descending or ascending order. This can be useful to see specific tickers first or last depending on the sorted data on the screener.
Supported elements for sorting include:
* Rating
* Trend Strength
* Lux Volatility
* Squeeze Index
* Volume Sentiment
* Exits
* None
When "None" is selected the screener tickers appear as per their order in the Tickers settings.
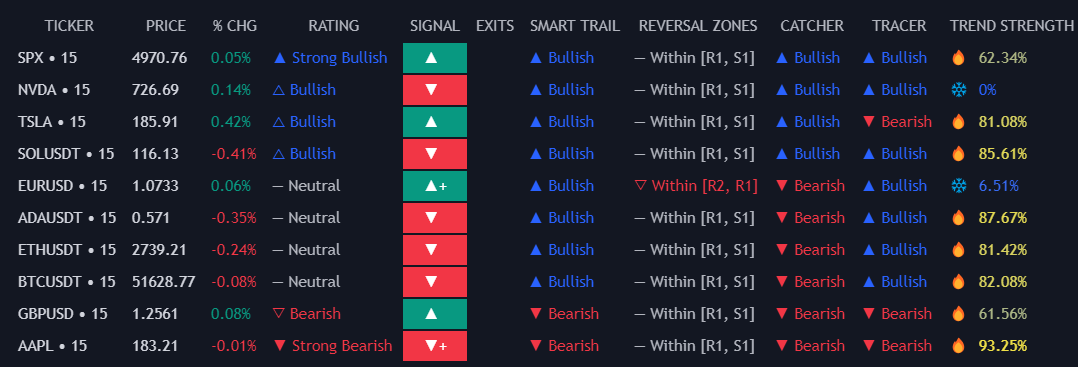
 From the "Screener Elements" settings users are able to filter out undesired information returned by the screener. This is done from the dropdown setting located on each "Screener Elements" settings.
Certain elements returning specific information from a list of supported options will have a filter allowing to select a precise option, while elements returning a value on the screener will make use of conditional operators (Above/Below).
Users can set a filtering condition on multiple elements, allowing them to display the tickers that respect the user set filtering conditions.
# Introduction (/docs/algos/screeners/osc/introduction)

The Screener (OSC) is a useful tool able to return recent information from various features in the **Oscillator Matrix®** toolkit for up to 10 user set tickers with customizable timeframe.
In order to use the screener the best way possible it is first advised to fully understand the [Oscillator Matrix®](/docs/algos/oscillator-matrix/introduction) toolkit.
Provided below are pages describing all key features included.
From the "Screener Elements" settings users are able to filter out undesired information returned by the screener. This is done from the dropdown setting located on each "Screener Elements" settings.
Certain elements returning specific information from a list of supported options will have a filter allowing to select a precise option, while elements returning a value on the screener will make use of conditional operators (Above/Below).
Users can set a filtering condition on multiple elements, allowing them to display the tickers that respect the user set filtering conditions.
# Introduction (/docs/algos/screeners/osc/introduction)

The Screener (OSC) is a useful tool able to return recent information from various features in the **Oscillator Matrix®** toolkit for up to 10 user set tickers with customizable timeframe.
In order to use the screener the best way possible it is first advised to fully understand the [Oscillator Matrix®](/docs/algos/oscillator-matrix/introduction) toolkit.
Provided below are pages describing all key features included.
 From the "Screener Elements" settings users are able to filter out undesired information returned by the screener. This is done from the dropdown setting located on each "Screener Elements" settings.
Certain elements returning specific information from a list of supported options will have a filter allowing to select a precise option, while elements returning a value on the screener will make use of conditional operators (Above/Below).
Users can set a filtering condition on multiple elements, allowing them to display the tickers that respect the user set filtering conditions.
# Introduction (/docs/algos/screeners/pac/introduction)

The Screener (PAC) is a useful tool able to return recent information from various features in the **Price Action Concepts®** toolkit for up to 10 user set tickers with customizable timeframe.
In order to use the screener the best way possible it is first advised to fully understand the [Price Action Concepts®](/docs/algos/price-action-concepts/introduction) toolkit.
Provided below are pages describing all key features included.
From the "Screener Elements" settings users are able to filter out undesired information returned by the screener. This is done from the dropdown setting located on each "Screener Elements" settings.
Certain elements returning specific information from a list of supported options will have a filter allowing to select a precise option, while elements returning a value on the screener will make use of conditional operators (Above/Below).
Users can set a filtering condition on multiple elements, allowing them to display the tickers that respect the user set filtering conditions.
# Introduction (/docs/algos/screeners/pac/introduction)

The Screener (PAC) is a useful tool able to return recent information from various features in the **Price Action Concepts®** toolkit for up to 10 user set tickers with customizable timeframe.
In order to use the screener the best way possible it is first advised to fully understand the [Price Action Concepts®](/docs/algos/price-action-concepts/introduction) toolkit.
Provided below are pages describing all key features included.
 From the "Screener Elements" settings users are able to filter out undesired information returned by the screener. This is done from the dropdown setting located on each "Screener Elements" settings.
Certain elements returning specific information from a list of supported options will have a filter allowing to select a precise option, while elements returning a value on the screener will make use of conditional operators (Above/Below), except the Lux Volatility.
Users can set a filtering condition on multiple elements, allowing them to display the tickers that respect the user set filtering conditions.
# Introduction (/docs/algos/screeners/s-o/introduction)

The Screener (S\&O) is a useful tool able to return recent information from various features in the **Signals & Overlays®** toolkit for up to 10 user set tickers with customizable timeframe.
In order to use the screener the best way possible it is first advised to fully understand the [Signals & Overlays®](/docs/algos/signals-overlays/introduction) toolkit.
Provided below are pages describing all key features included.
From the "Screener Elements" settings users are able to filter out undesired information returned by the screener. This is done from the dropdown setting located on each "Screener Elements" settings.
Certain elements returning specific information from a list of supported options will have a filter allowing to select a precise option, while elements returning a value on the screener will make use of conditional operators (Above/Below), except the Lux Volatility.
Users can set a filtering condition on multiple elements, allowing them to display the tickers that respect the user set filtering conditions.
# Introduction (/docs/algos/screeners/s-o/introduction)

The Screener (S\&O) is a useful tool able to return recent information from various features in the **Signals & Overlays®** toolkit for up to 10 user set tickers with customizable timeframe.
In order to use the screener the best way possible it is first advised to fully understand the [Signals & Overlays®](/docs/algos/signals-overlays/introduction) toolkit.
Provided below are pages describing all key features included.