# Backtest Viewer (/platform/ai-backtesting/backtest-viewer)
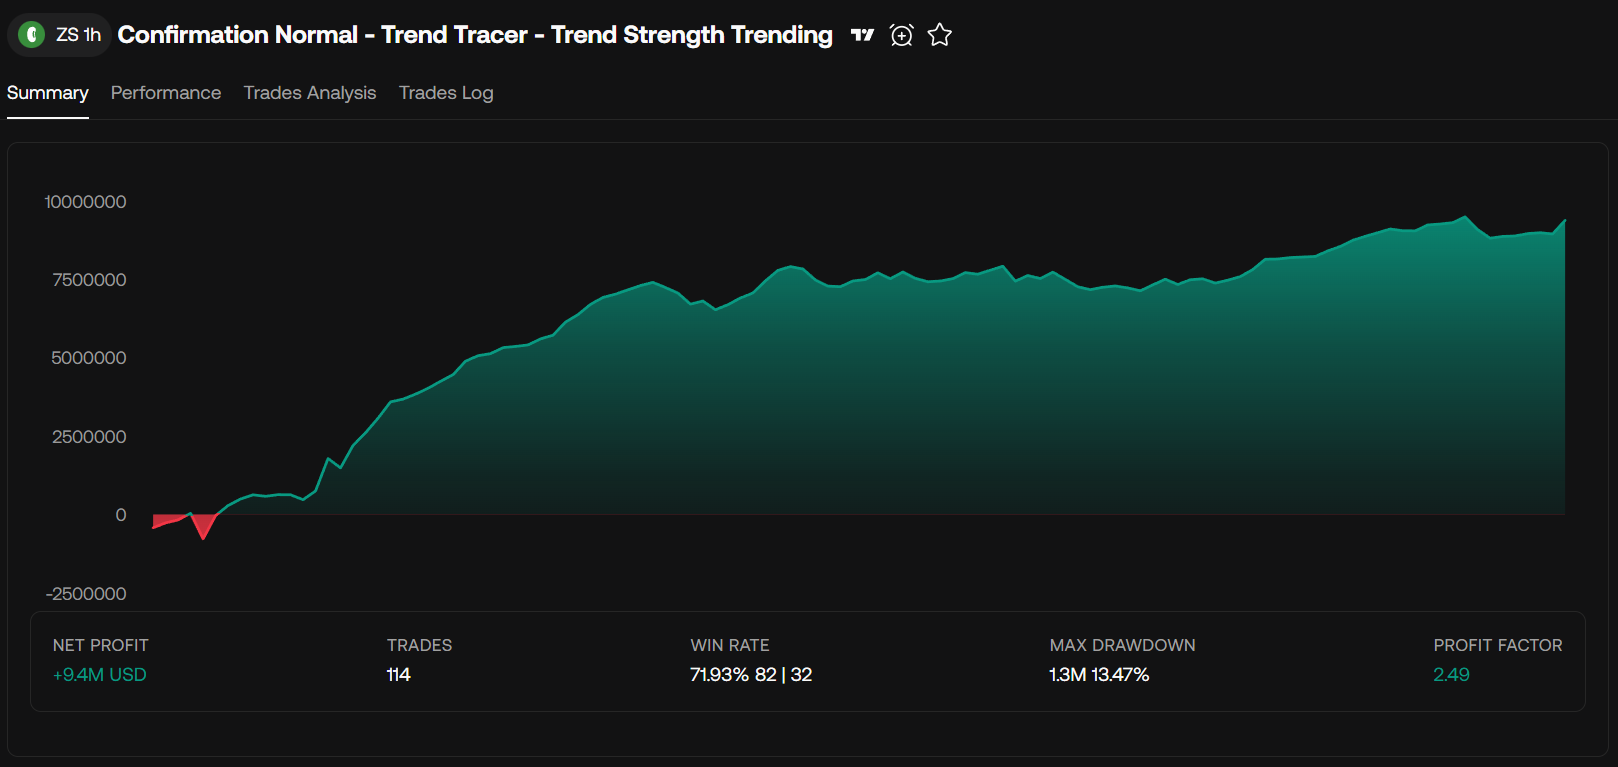
Users have access to a wide variety of useful data and visualisations to evaluate a strategy trough the backtest viewer.
By default the backtest viewer will display backtest information from the most recent fetched strategy in the conversation.
You can check backtest results from previously fetched strategies by simply clicking on the card holding the strategy
## Backtest Statistics [#backtest-statistics]
### Overview [#overview]
* Historical Net Profit
* Net Profit
* Trades
* Win Rate
* Winning Trades (left)
* Losing Trades (right)
* Max Drawdown
* Max Drawdown %
### Performance [#performance]
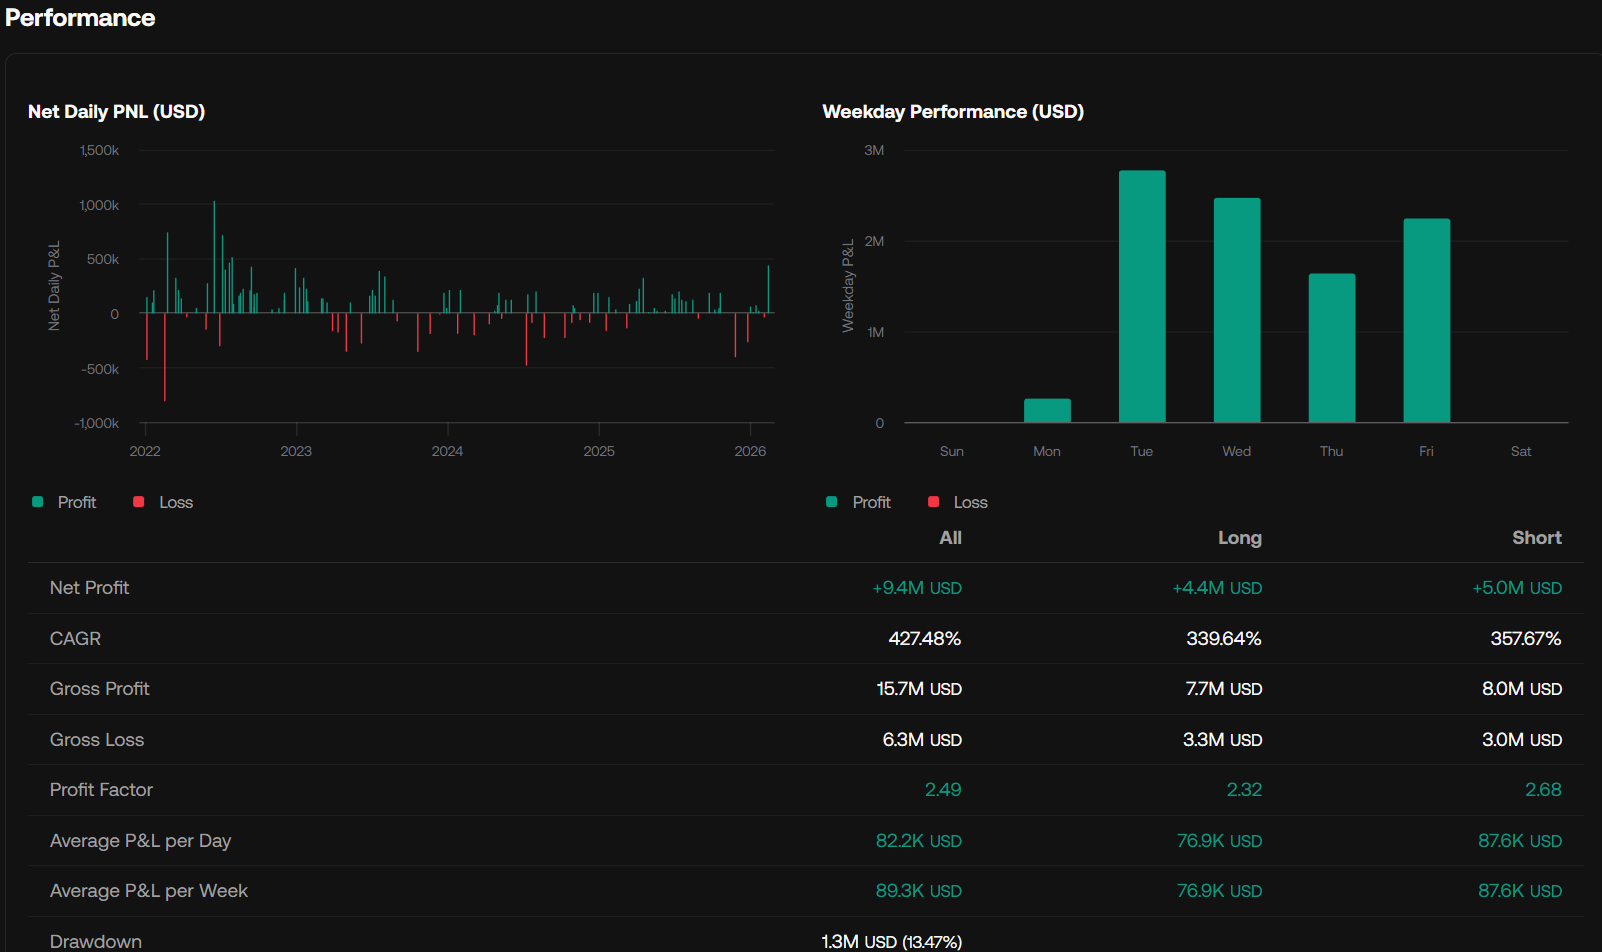
The **Performance** section includes two visualisations:
* Net Daily PNL: Net daily trades result (profit + loss)
* Weekday Performance: Sum of the profit and losses made during a specific day of the week
#### Table [#table]
A performance table is included listing statistics for all trades, only longs, and only shorts. The following statistics are returned:
*
Net Profit
*
CAGR (Compounded annualized growth rate)
*
Gross Profit
*
Gross Loss
*
Profit Factor
*
Average P&L per Day
*
Average P&L per Week
*
Drawdown
*
Drawdown Percent
### Trades Analysis [#trades-analysis]
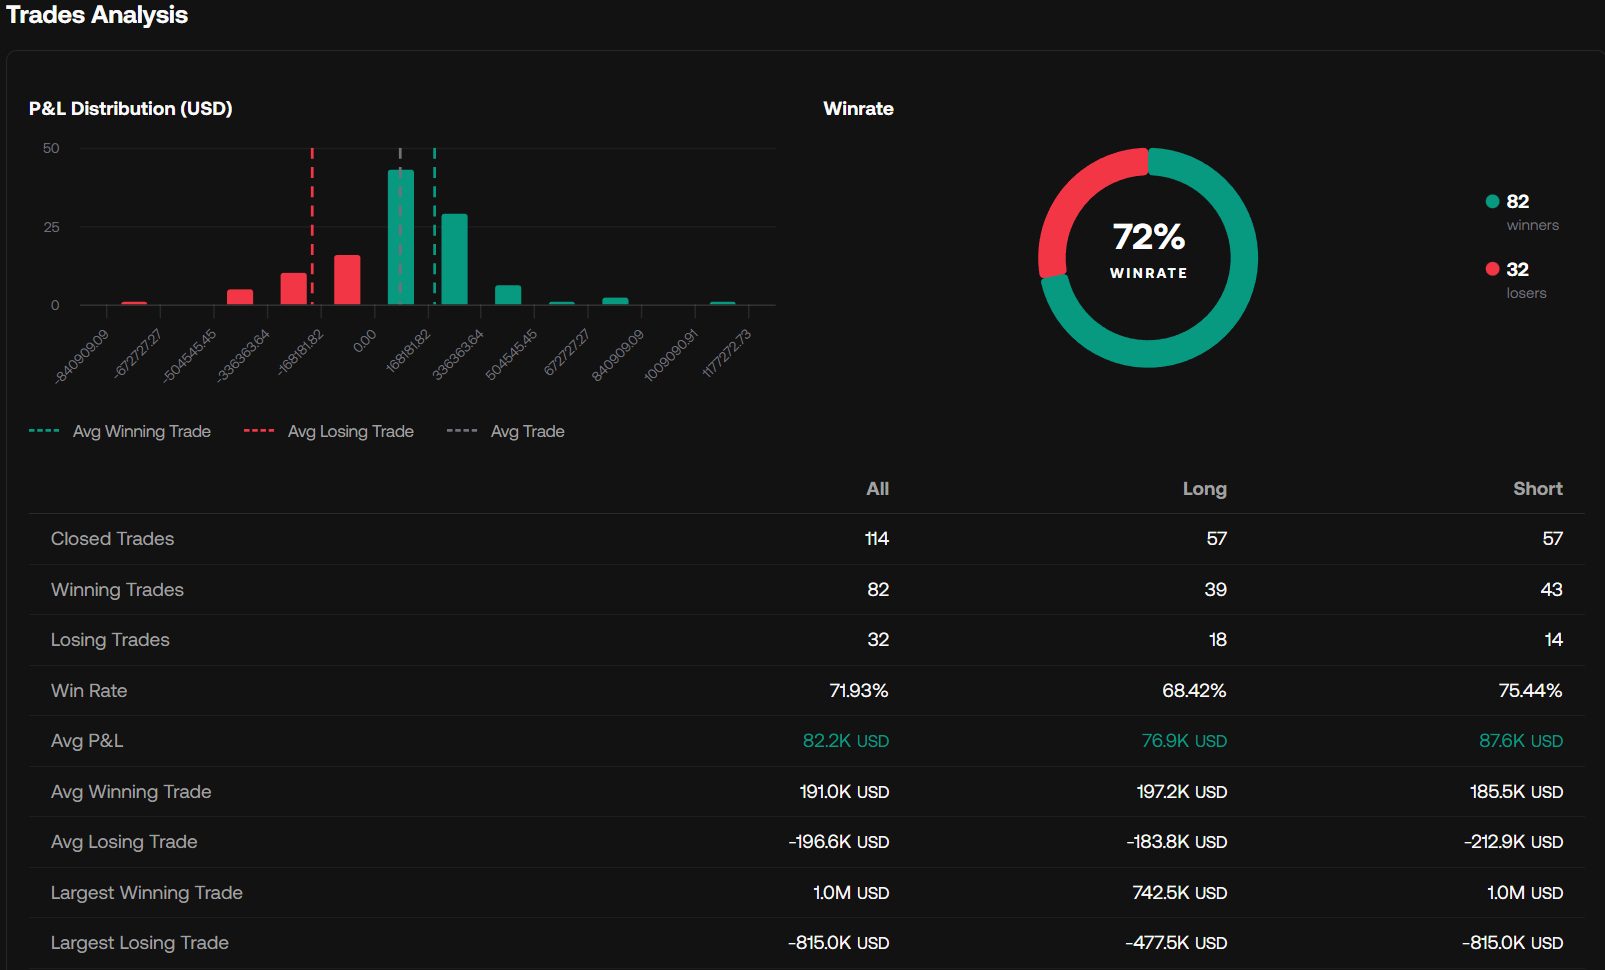
The **Trades Analysis** section includes two visualisations:
* P\&L Distribution: Distribution of trade profit and losses
* Winrate: Shows winrate, winning trades and losing trades
* Duration vs P\&L: Scatter plot showing trade duration (in bars) against the trade result
#### Table [#table-1]
A trades analysis table is included listing statistics for all trades, only longs, and only shorts. The following statistics are returned:
*
Closed Trades
*
Winning Trades
*
Losing Trades
*
Win Rate
*
Avg P&L
*
Avg Winning Trade
*
Avg Losing Trade
*
Largest Winning Trade
*
Largest Losing Trade
#### Duration [#duration]
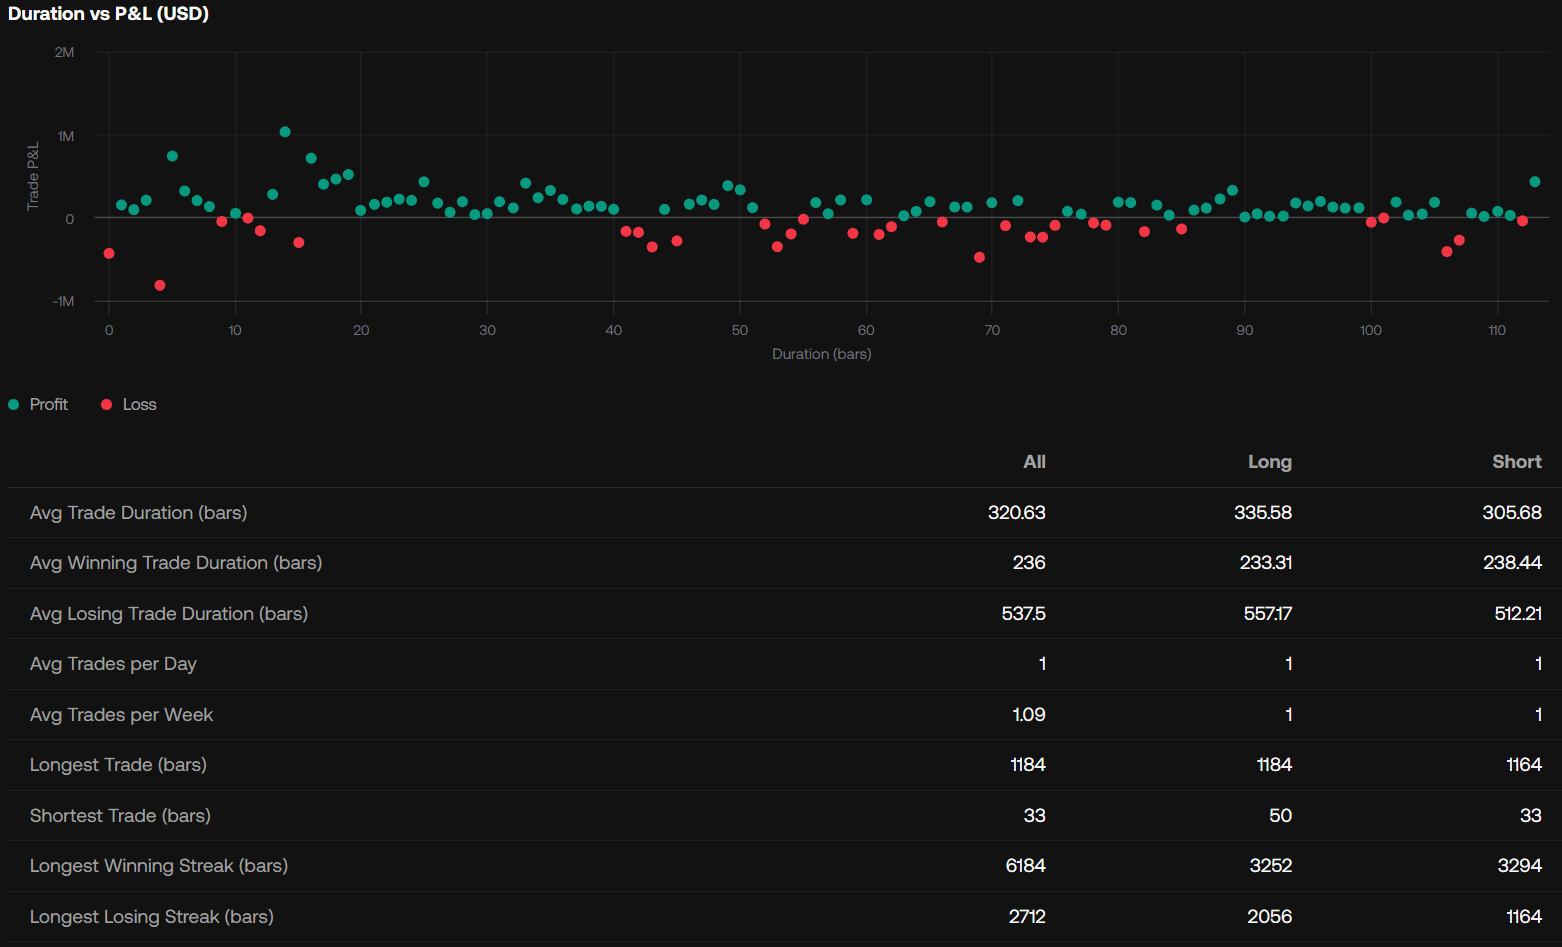
A duration table is included listing statistics for all trades, only longs, and only shorts. The following statistics are returned:
*
Avg Trade Duration (bars)
*
Avg Winning Trade Duration (bars)
*
Avg Losing Trade Duration (bars)
*
Avg Trades per Day
*
Avg Trades per Week
*
Longest Trade (bars)
*
Shortest Trade (bars)
*
Longest Winning Streak (bars)
*
Longest Losing Streak (bars)
## Trades Log [#trades-log]
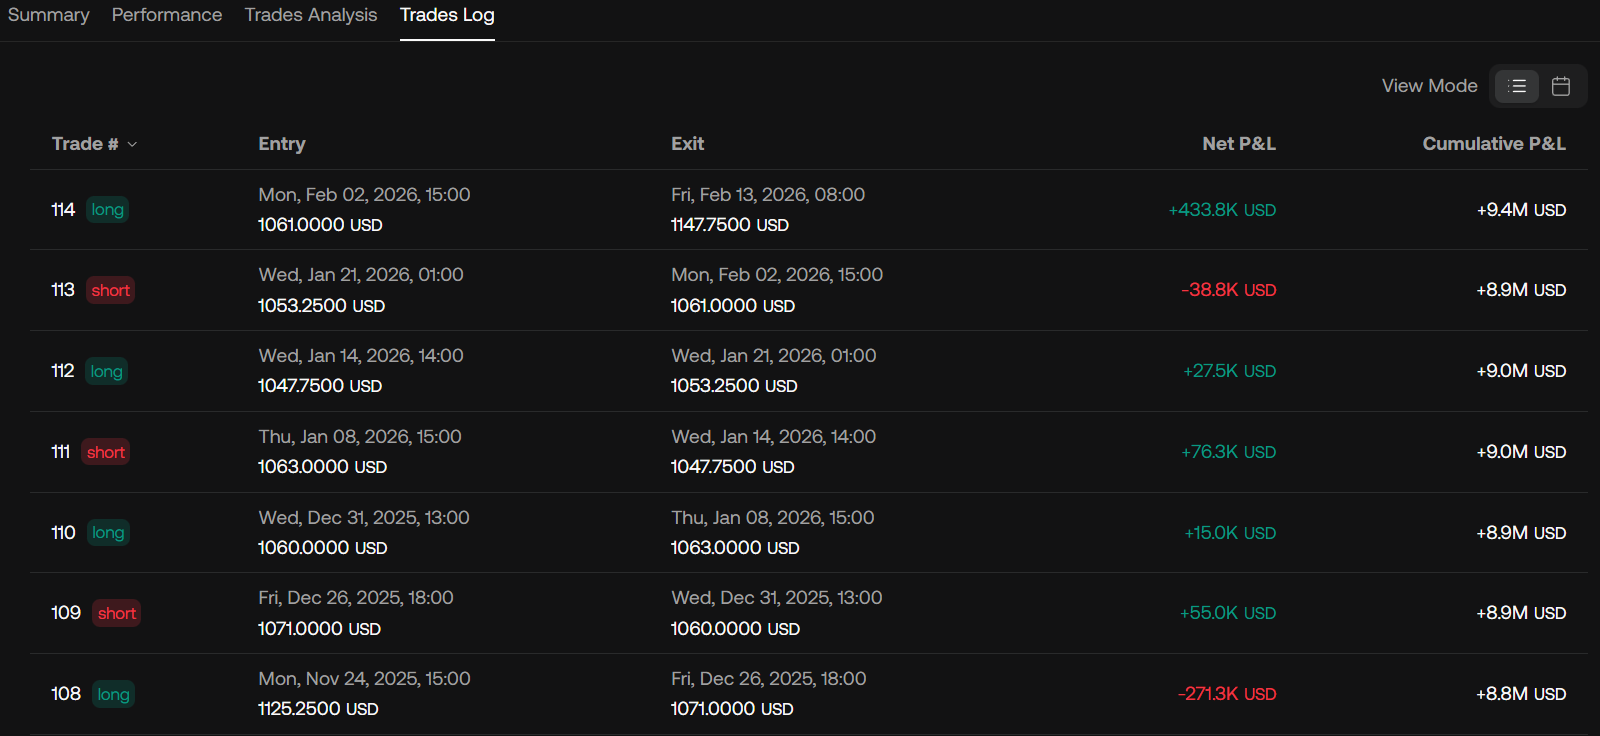
A trades log table is included showing each closed trade in chronological order, including the trade number, trade side, entry, exit, net P\&L, and the running cumulative P\&L after each trade.
Click on a column to sort it ascendingly or descendingly.
### Calendar View [#calendar-view]
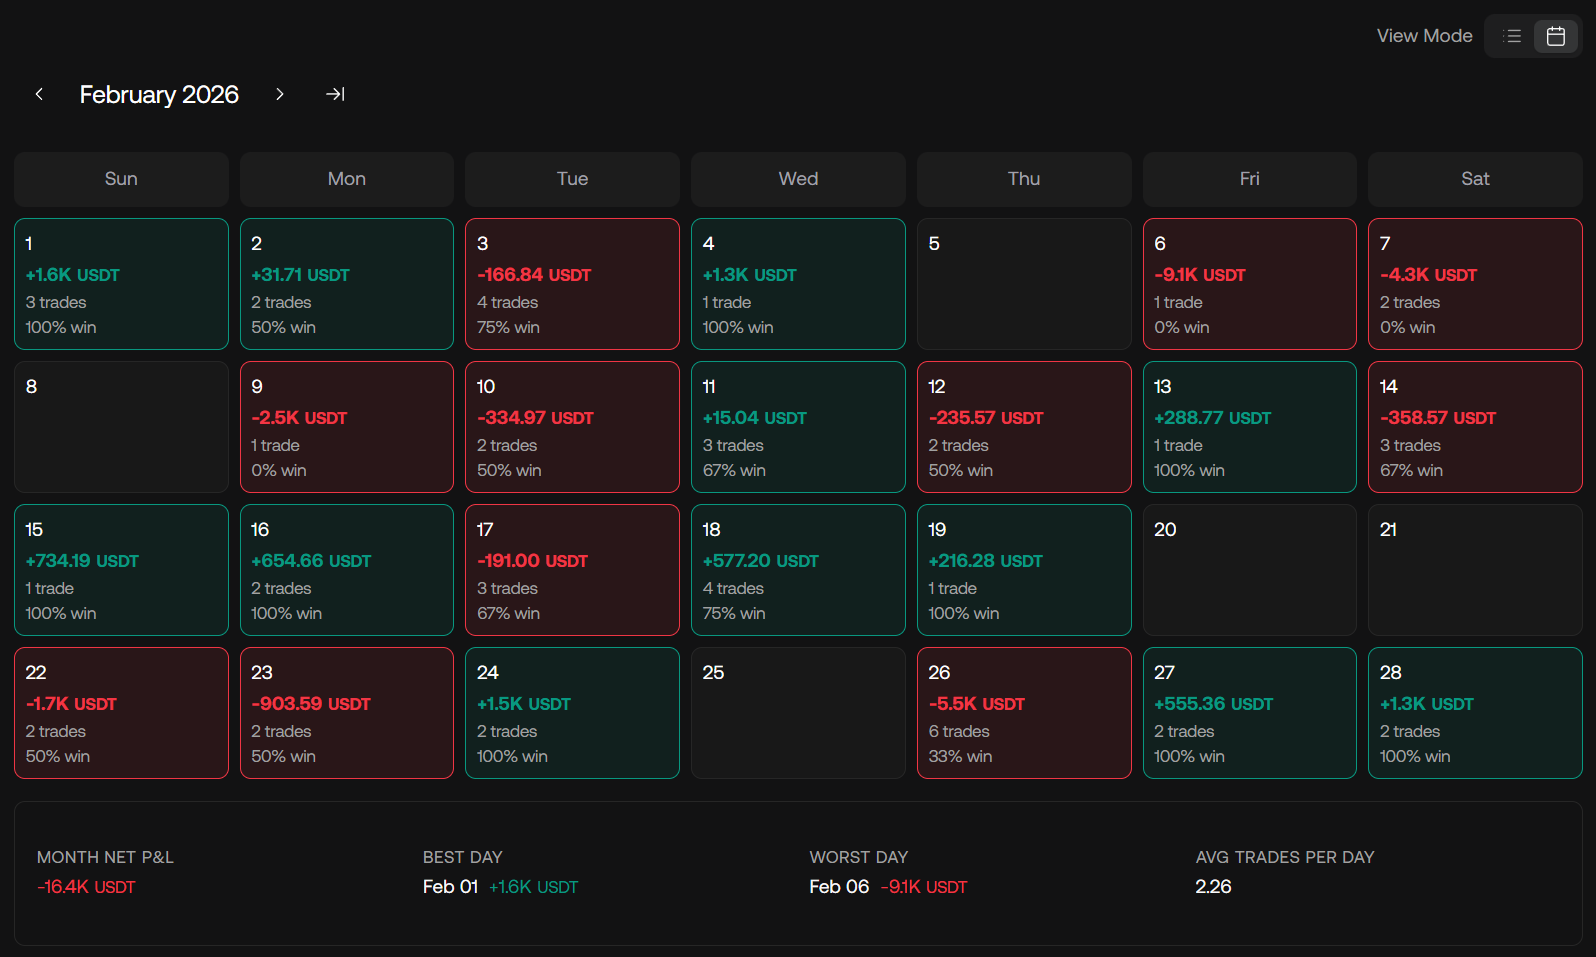
When the `View Mode` is switched to calendar view, trades are grouped by day in a monthly layout with month navigation at the top. Each day can show its net P\&L, number of trades, and win rate, while a summary below highlights the month net P\&L, best day, worst day, and average trades per day.
## Strategy Comparison View [#strategy-comparison-view]
When the Backtesting AI fetches multiple strategies at once, these will eb displayed in a comparison view, allowing for detailed comparisons.
### Comparison Table [#comparison-table]
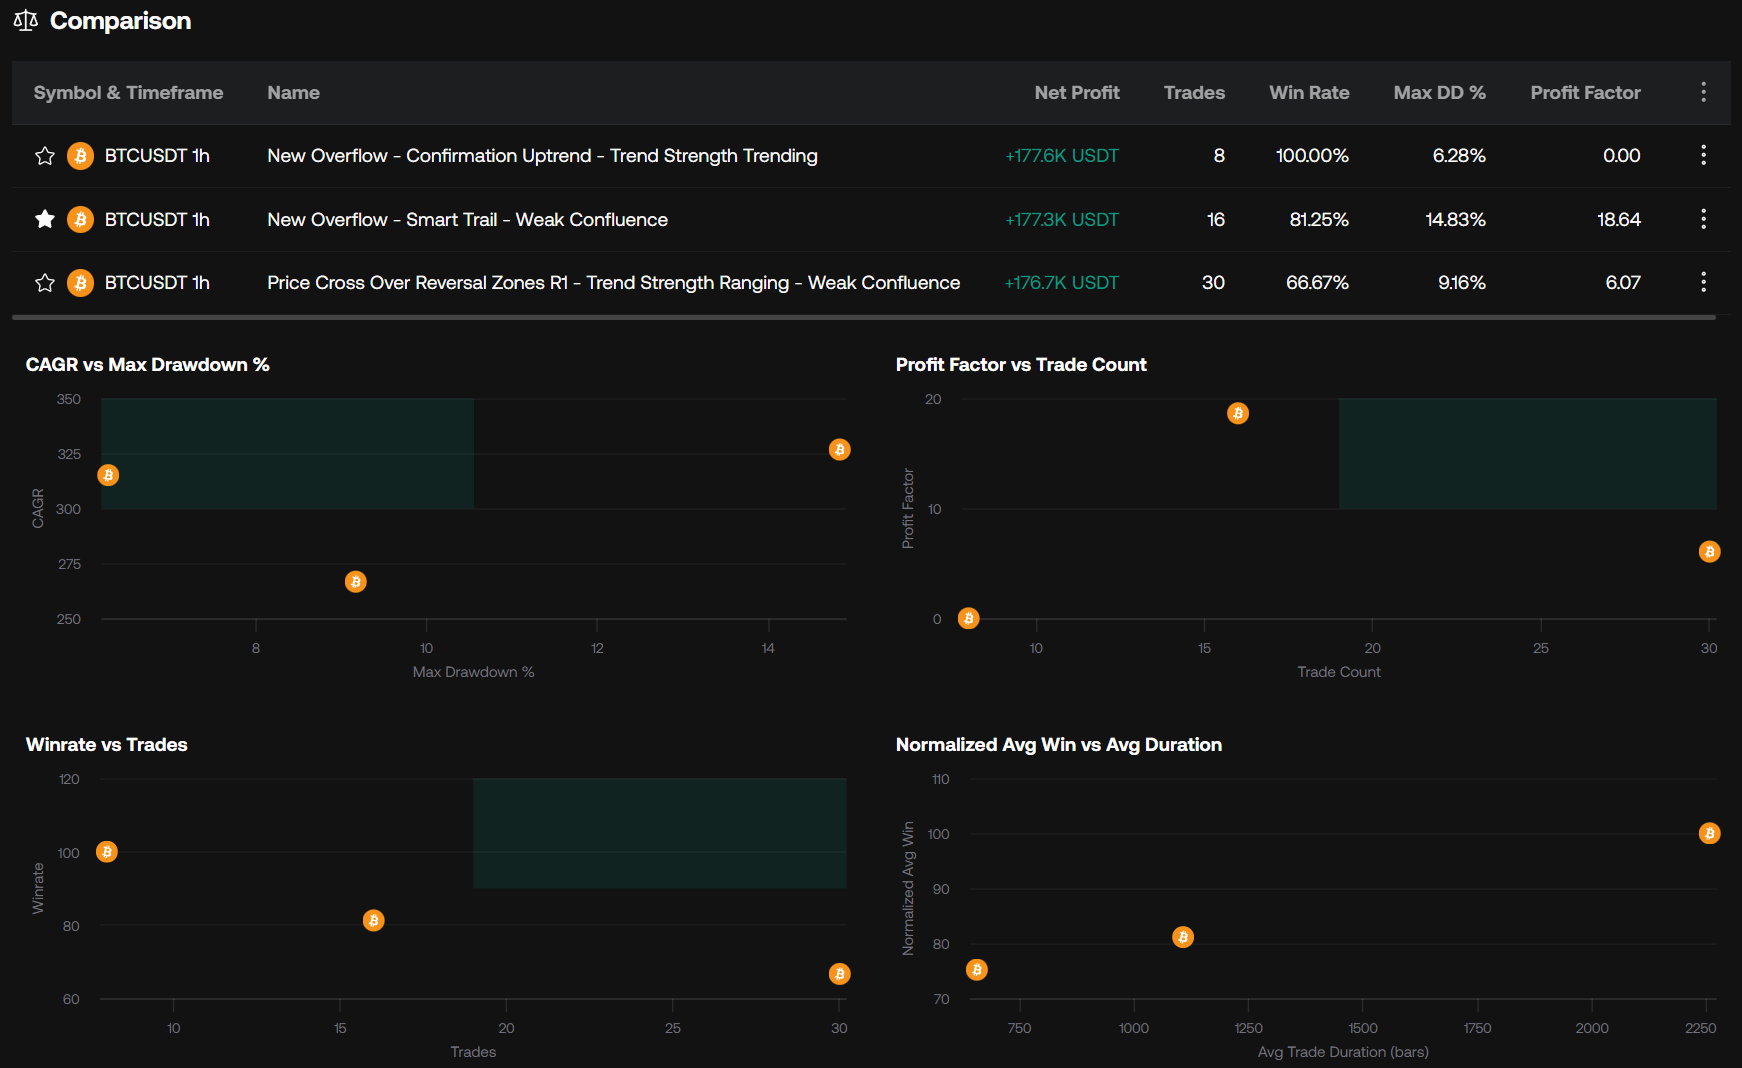
The comparison table displays each strategy side by side, including the symbol and timeframe, strategy name, net profit, trades, win rate, max DD %, and profit factor.
### Comparison Scatter Plots [#comparison-scatter-plots]
The comparison scatter plots help visualize how strategies relate across key metrics, with views such as CAGR vs Max Drawdown %, Profit Factor vs Trade Count, Winrate vs Trades, and Normalized Avg Win vs Avg Duration.
Each point represents a strategy, with strong performers being located in the quadrant in green.
Hovering over a strategy point in the graph shows a tooltip with the relevant strategy details.