# Drawings (/platform/charts/drawings)
The left toolbar holds the drawing tools, grouped by purpose: **Lines**, **Fibonacci**, **Patterns**, **Measurements**, **Shapes**, **Text**, and **Icons**. While the [Journal](/platform/workspaces/journal) is open, **Annotations** also carries **Journal Trade** and **Journal Note** — a click logs a [fill](/platform/workspaces/journal/trades#from-the-chart) or a [day note](/platform/workspaces/journal/notes#from-the-chart) instead of leaving a drawing.
Drawings are anchored in **time and price**, not in screen pixels: they stay attached to the same bars and levels when you pan, zoom, or change timeframe. They belong to the [active chart](/platform/charts/introduction#layouts) and are saved with the [workspace](/platform/workspaces), so they're still there when you come back.
Choose a tool from the left toolbar, or hold **Alt** for the [radial wheel](#the-radial-wheel) of your favorites. Common line tools also have direct shortcuts: `Alt+T` trend line, `Alt+H` horizontal line, `Alt+V` vertical line.
Click the chart to set the tool's anchor points: a horizontal line takes one click, a trend line two. Hold **Shift** while drawing a line to lock its angle to 45° increments. With **Magnet** on, anchors snap to nearby OHLC values instead of landing between prices.
Switch back to **Cursor** to select a drawing and drag it (or its anchor points) around. Middle-click a drawing to delete it, use the **Eraser** to click or drag away several, or manage everything at once from the **Object tree**.
## Toolbar controls [#toolbar-controls]
Beyond the tools themselves, the toolbar carries the controls that change how drawing behaves:
| Control | What it does |
| ------------------------------- | ----------------------------------------------------------------------------------------------------------------------------------------- |
| **Cursor** | Select and move drawings |
| **Capture area for Quant** | Drag a region and [ask Quant](/platform/quant/indicators#from-a-region-on-the-chart) about what's in it. Not a drawing — it does not save |
| **Measure** | Transient ruler between two points. **Shift+click** an empty spot also starts measure |
| **Eraser** | Click or drag to delete drawings |
| **Magnet** | Snap anchor points to OHLC values: off, weak, or strong |
| **Stay in drawing mode** | Keep the tool armed after you place a drawing, for drawing several in a row |
| **Sync drawings on all charts** | Copy drawings across the cells of a multi-chart layout |
**Magnet** is worth turning on whenever your drawings should sit on exact prices (support lines on a candle close, Fibonacci anchors on a swing high/low). The two strengths control how aggressively anchors get pulled to OHLC values.
**Stay in drawing mode** changes the default one-shot behavior. Normally placing a drawing returns you to the cursor; with this on, the tool stays armed, which is useful when marking up many levels in one pass.
## The radial wheel [#the-radial-wheel]
Hold **Alt** with the chart focused and a radial picker of your favorite drawing tools opens around the cursor. Pick a tool without travelling to the toolbar and without memorizing a shortcut per tool. Your hand never leaves the chart.
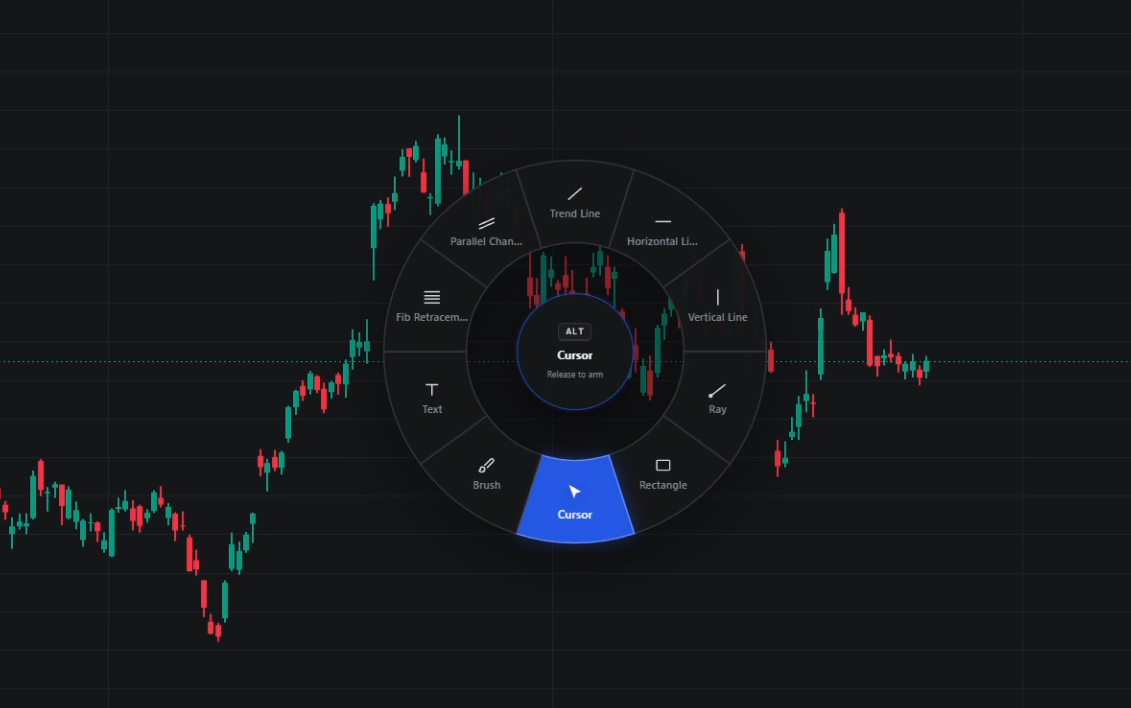
The wheel shows the tools you have favorited, so it's worth curating: keep it to the handful you actually reach for, and the selection stays a single flick of the mouse.
**Cursor** is always on the wheel, pinned at the bottom (6 o'clock), even after you star other tools. A straight-down flick returns you to select/idle — the same as the toolbar's Cursor button — so you never lose the way back.
The wheel complements the fixed shortcuts rather than replacing them: `Alt+T` / `Alt+H` / `Alt+V` are still fastest for trend, horizontal, and vertical lines. Use the wheel for everything else you use often: Fibonacci, boxes, annotations. See [Shortcuts](/platform/charts/shortcuts) for the full list.
## Measure without leaving the keyboard [#measure-without-leaving-the-keyboard]
The **Measure** tool draws a transient ruler: click two points and it reports the distance between them, then disappears on the next click. **Shift+click** an empty spot on the chart starts a measurement instantly, without selecting the tool first.
## Manage drawings [#manage-drawings]
Open the **Object tree** from the topbar to see every drawing and indicator on the chart as a single list. From there you can:
* **Show/hide** a drawing without deleting it
* **Lock** it so a stray click can't move it
* **Reorder** what draws on top of what
* **Remove** it
To copy your markup across every cell in a multi-chart layout, enable **Sync drawings on all charts** on the toolbar. Each cell gets the same drawings, kept in sync as you edit.