# Indicators (/platform/charts/indicators)
Indicators apply to the [active chart](/platform/charts/introduction#layouts). In a multi-chart layout, click the cell you want before adding one.
Click **Indicators** in the chart topbar.
Search by name, browse the groups, or filter the Library by [concept](#luxalgo-library).
Click to add it to the chart. Depending on the study it renders either as an overlay on the price candles or in its own pane below.
## What's in the picker [#whats-in-the-picker]
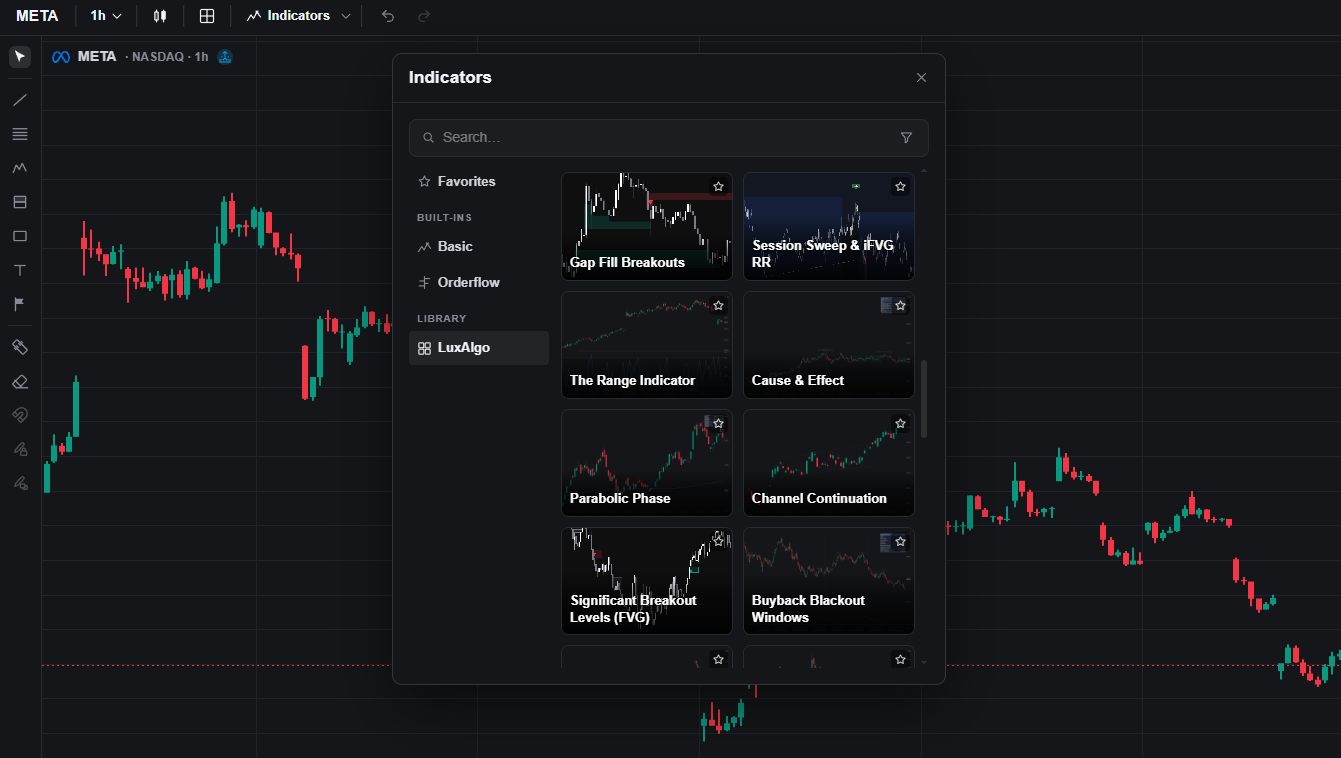
The picker is grouped by source:
* **Favorites**: the studies you have starred, so the ones you reuse sit at the top.
* **Basic**: standard studies such as RSI, MACD, Bollinger Bands, moving averages, and others.
* **Orderflow**: native order-flow tools built on footprint data: volume delta, volume profiles, trade count, and more. These have their own documentation (see [Order Flow](/platform/charts/order-flow/introduction)), and most of them need a symbol whose venue provides footprint data (see [Data](/platform/charts/data)).
* **LuxAlgo Library**: years of in-house studies, native to the picker. Covered [below](#luxalgo-library).
Volume can also plot as a native pane, separate from the indicator system.
## Favorites [#favorites]
Star any indicator you reach for often. The same set shows in the picker's **Favorites** tab and in a **chevron** next to **Indicators** in the topbar — the chevron adds one back onto the chart without opening the full menu.
You can star from three places:
* A star on each picker row (and on each Library preview card)
* A star on the **legend** of anything already on the chart, with the row's other controls
* A star in the **Code** panel header, next to Copy, for the script you are editing
Click a star again to remove it. Starred Library and Quant scripts keep their source, so they can be added again from Favorites after a reload. Favorites follow your account.
## LuxAlgo Library [#luxalgo-library]
The [LuxAlgo Library](https://luxalgo.com/library) is the encyclopedia of trading and technical analysis. Years of in-house implementations of every trading concept in the history of the craft, built to display automatically on your charts: trend, momentum, volatility, structure, SMC/ICT, Wyckoff, Elliott, patterns, machine learning, and more. Hundreds of studies, written by the same team, ready to plot.
It is natively built into the workspace as its own section in the Indicators picker. Open **Indicators**, go to **LuxAlgo Library**, and add a study the same way you add RSI. No import, no script paste, no extra account.
Browsing is a recency-sorted grid of preview cards — screenshot with the title overlaid. Click a card to add it. Typed search switches to a dense list of name matches.
A **funnel** on the search row filters by **concept**. Pick one (RSI, volume, structure, and so on) and the Library shows only the indicators tagged with that idea. The active concept sits at the top of the list with a checkmark; click it again to clear the filter.
Every Library indicator can be customized on the spot with [Quant](/platform/quant/indicators). Describe the change in plain language (colors, signals, extra conditions, a different overlay) and Quant rewrites it on the active chart.
If none of these are what you need, Quant can also generate a custom study from a description or a screenshot. Quant scripts plot on the active chart and are marked in the legend so you can tell them apart from picker studies. A script generated in this workspace is saved with it; a chat opened from another workspace is a preview until you [Add to workspace](/platform/quant/indicators#keep-it-on-the-workspace). If you remove the script, **Add to chart** puts it back on the active cell and saves it again.
On the **Free** plan you can add 5 indicators per chart, plus one Quant script and the volume pane. **Premium**, **Ultimate**, and **AI Ultra** are unlimited.
## Configure [#configure]
Each indicator has its own settings: lengths, sources, colors, visibility of individual plots. Open them from the **gear on the chart legend** next to the indicator's name, or through the **Object tree**.
The **Data window** (topbar) shows the exact value of every plot under the crosshair, which is useful when several studies overlap and you can't tell which line is which.
## Remove and manage [#remove-and-manage]
* Toggle an indicator off in the **Indicators picker**, or remove it from the **Object tree**.
* The Object tree can also **hide** an indicator without removing it, **lock** it, **duplicate** it (handy for running the same study with two different settings), and **reorder** what draws on top.
* Right-click the chart and choose **Remove indicators** to clear all of them at once.