# Overview (/platform/charts/introduction)
Each chart shows one market. Change the symbol, timeframe, and style from the topbar, or type directly on the chart. Click the chart first so it has keyboard focus, then a **letter** opens symbol search and a **digit** starts a timeframe change.
Charts live in a [workspace](/platform/workspaces), which also holds your [panels](/platform/workspaces/panels), including the [watchlist](/platform/workspaces/watchlist). Open them at [luxalgo.com/quant](https://www.luxalgo.com/quant).
This page covers the chart itself. [Drawings](/platform/charts/drawings), [Indicators](/platform/charts/indicators), and [Order Flow](/platform/charts/order-flow/introduction) each have their own page, and every keyboard and mouse shortcut is collected in [Shortcuts](/platform/charts/shortcuts).
## Layouts [#layouts]
The topbar **Layout** control sets how many charts share the workspace:
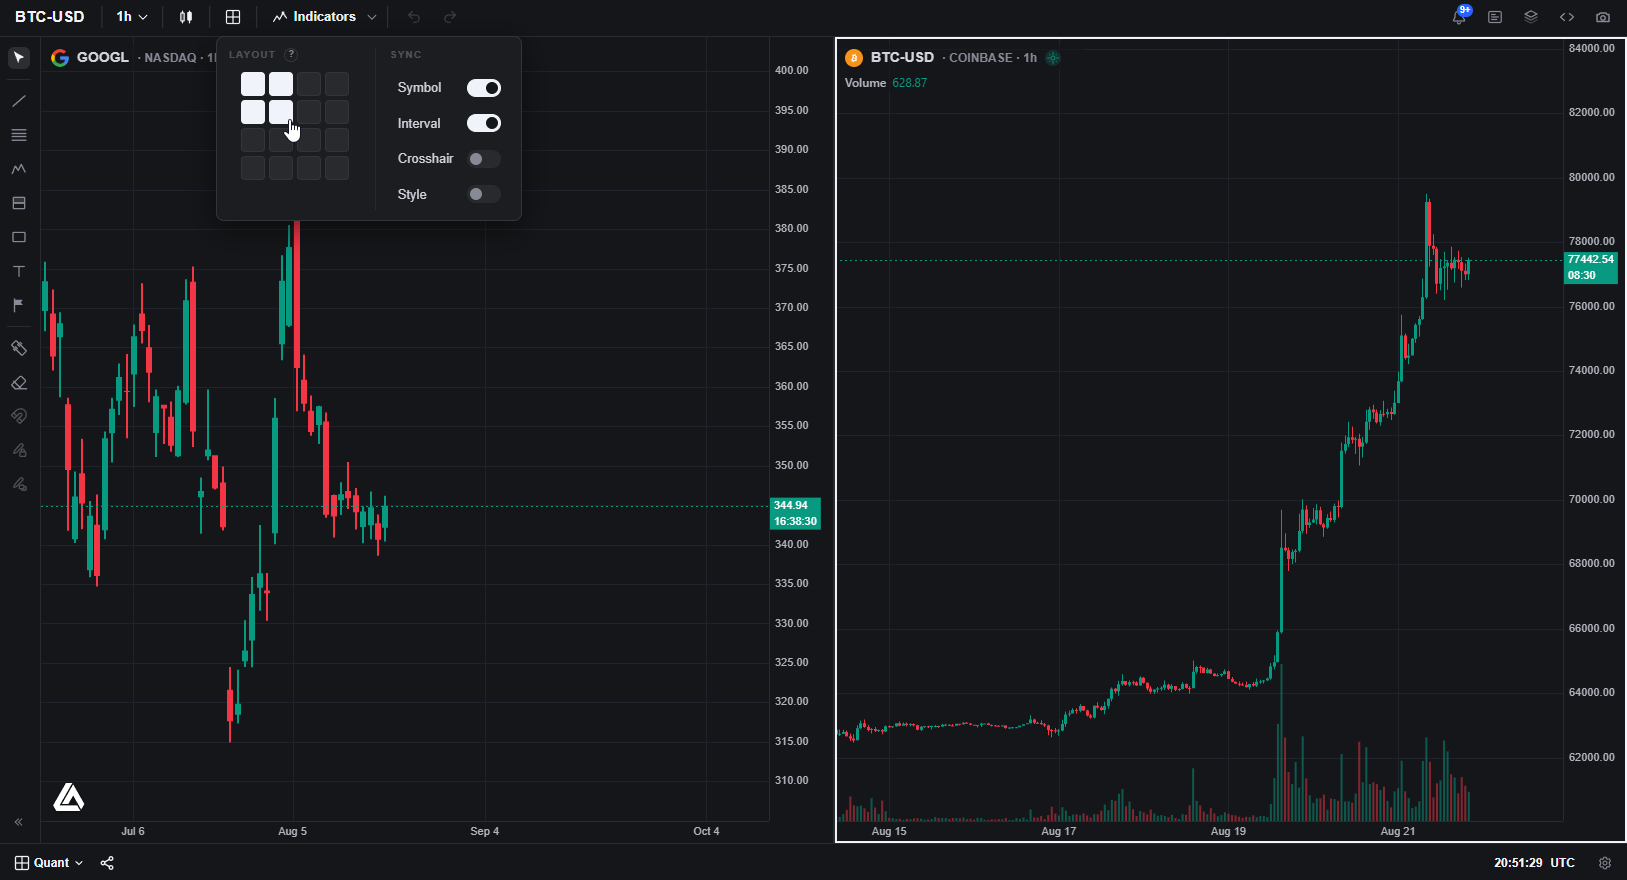
| Layout | Arrangement |
| -------------- | ------------------- |
| Single | One chart (default) |
| 2 side by side | Two columns |
| 2 stacked | Two rows |
| 4 grid | 2×2 |
| 8 grid | 4×2 |
The layout picker also lets you preview a custom grid before applying it. Drag the splitters between cells to resize them; double-click a splitter to even the split.
### The active cell [#the-active-cell]
In a multi-chart layout, exactly one chart is **active**: the one you last clicked. Everything that targets "the chart" targets this cell: symbol changes, timeframe changes, drawings, indicators, and scripts from [Quant](/platform/quant/introduction). If an action seems to land on the wrong chart, check which cell is active first.
Charts per layout depend on your plan: **Free** 1, **Premium** 8, **Ultimate** 12, **AI Ultra** 16.
### Sync charts together [#sync-charts-together]
In the layout picker, **Sync** links properties across charts. Each can be toggled independently:
* **Symbol**: changing the ticker on one chart updates every linked chart. Useful for watching the same market on several timeframes at once.
* **Interval**: changing the timeframe updates every linked chart. Useful for comparing several markets on the same timeframe.
* **Crosshair**: the cursor lines up across charts, so you can read the same moment in time on every cell.
**Sync drawings on all charts** is separate: it lives on the [drawing toolbar](/platform/charts/drawings) and copies your drawings across cells.
## Change the symbol [#change-the-symbol]
Click the symbol in the topbar, or type a **letter** on the chart, to open **Symbol Search**.
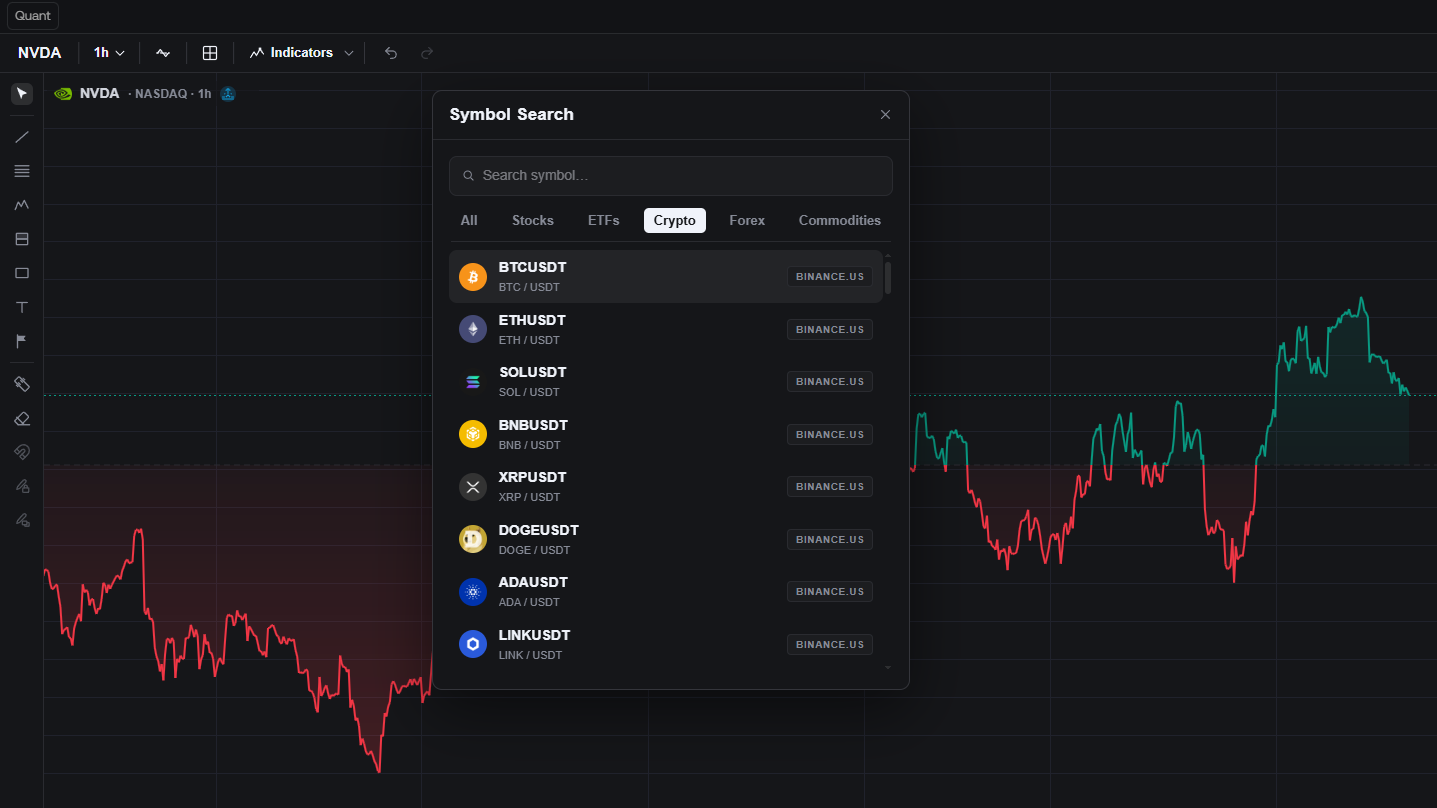
The search is organized in tabs: **All**, **Stocks**, **ETFs**, **Crypto**, **Futures**, **Forex**, **Commodities**. By default a symbol resolves to its primary venue; to pin a specific venue, use the `PROVIDER:SYMBOL` format, for example `binance:BTCUSDT` for Binance spot rather than an aggregate. Which venues exist per market, which plans can open them, and which of them provide order-flow data, is covered in [Data](/platform/charts/data).
## Change the timeframe [#change-the-timeframe]
Use the timeframe dropdown in the topbar. Default presets are 1m, 5m, 15m, 1h, 4h, 1D, and 1W.
Faster: type a **digit** on the chart to start entering a timeframe, then finish typing it:
| You type | You get |
| -------- | ------------------------------------- |
| `15` | 15 minutes (a bare number is minutes) |
| `4h` | 4 hours |
| `D` | 1 day |
| `3M` | 3 months |
Star the timeframes you use often. Starred intervals show as one-click chips.
Where the symbol has trading sessions (US equities, futures-style calendars), the bottom bar can switch between **RTH** (regular trading hours: only the main session) and **ETH** (extended trading hours, including pre- and post-market).
Custom timeframes are available on **Premium**, **Ultimate**, and **AI Ultra**.
## Chart types [#chart-types]
Open the chart style control in the topbar:
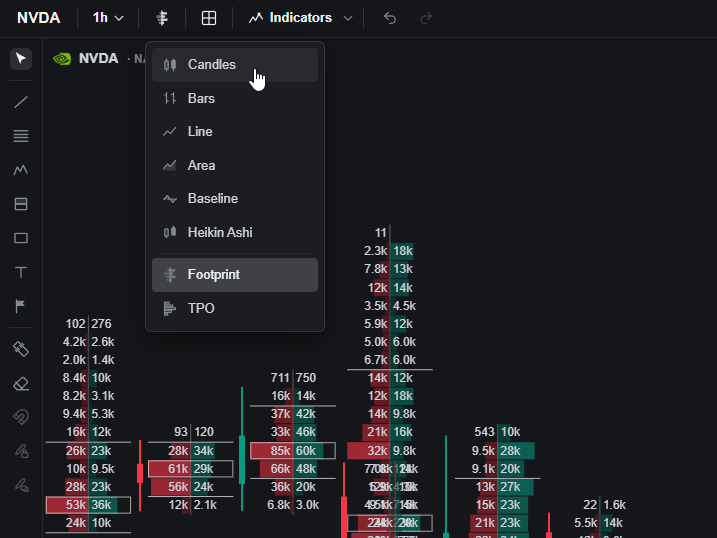
* **Candles** (default), **Bars**, **Line**, **Area**, **Baseline**, **Heikin Ashi**: standard price representations, all built from OHLC data.
* **Footprint**: replaces each bar with a per-price breakdown of bid vs ask volume. This is order-flow data, so it needs a symbol that provides it.
* **TPO**: Time Price Opportunity session profiles, showing how much time price spent at each level.
Footprint and TPO are full chart types with their own settings and their own documentation. See [Order Flow](/platform/charts/order-flow/introduction).
## Settings [#settings]
Open **Chart settings** from the gear, or right-click the chart and choose **Settings…**. The dialog has three tabs:
| Tab | What it controls |
| -------------------- | ---------------------------------------------------------------------------------- |
| **Symbol** | Chart type, candle/bar/line colors, time zone, watermark, status line |
| **Scales and lines** | Price scale mode, invert scale, last price line, countdown to bar close, crosshair |
| **Canvas** | Background, grid, color theme (**Dark** / **Light**) |
When Footprint or TPO is the active style, the dialog gains additional tabs for that chart type's own options.
### Price scale modes [#price-scale-modes]
Under **Scales and lines** (or by right-clicking the price axis):
* **Regular**: linear price.
* **Percent**: moves shown as % change from the left edge of the visible range. Good for comparing magnitude across assets with different prices.
* **Indexed to 100**: like percent, but rebased so the first visible bar equals 100.
* **Logarithmic**: equal vertical distances are equal *percentage* moves, not equal dollar moves. The usual choice for long histories and for assets that have grown by multiples.
**Invert scale** flips the axis upside down.
### Faster paths [#faster-paths]
* Right-click the **price axis**: scale mode, including log and invert.
* Right-click the **time axis**: time zone.
* Press `0` with the chart focused to fit content to the viewport.
The symbol watermark is off by default.
### Inspect what's on the chart [#inspect-whats-on-the-chart]
The topbar can open two inspection panels:
* **Object tree**: every drawing and indicator on the chart as a list: show/hide, lock, reorder, or remove each one. This is the fastest way to clean up a crowded chart.
* **Data window**: the exact values of every plot under the crosshair, useful when several indicators overlap.
## Alerts [#alerts]
How many alerts you can run depends on your plan: **Free** 1, **Premium** 100, **Ultimate** 200, **AI Ultra** 500. Webhook alerts are available on **Premium**, **Ultimate**, and **AI Ultra**.
## Next steps [#next-steps]
The drawing toolbar, magnet snapping, and the radial wheel.
Built-in, order-flow, and LuxAlgo Library studies.
Footprint, TPO, volume profiles, and delta tools.
Every keyboard and mouse shortcut in one place.