# Replay Mode (/platform/charts/replay)
Replay Mode lets you return to a point in chart history and watch the following candles appear in sequence. Use it to practice reading a setup, review how a move developed, or manually test a trade idea without starting with the full outcome visible.
Replay Mode is **free** in [QuantCharts](https://app.luxalgo.com/quant). Playback runs **client-side**, in your browser.
## Start a replay [#start-a-replay]
1. Open the chart you want to review in [QuantCharts](https://app.luxalgo.com/quant).
2. Select **Replay** from the chart controls.
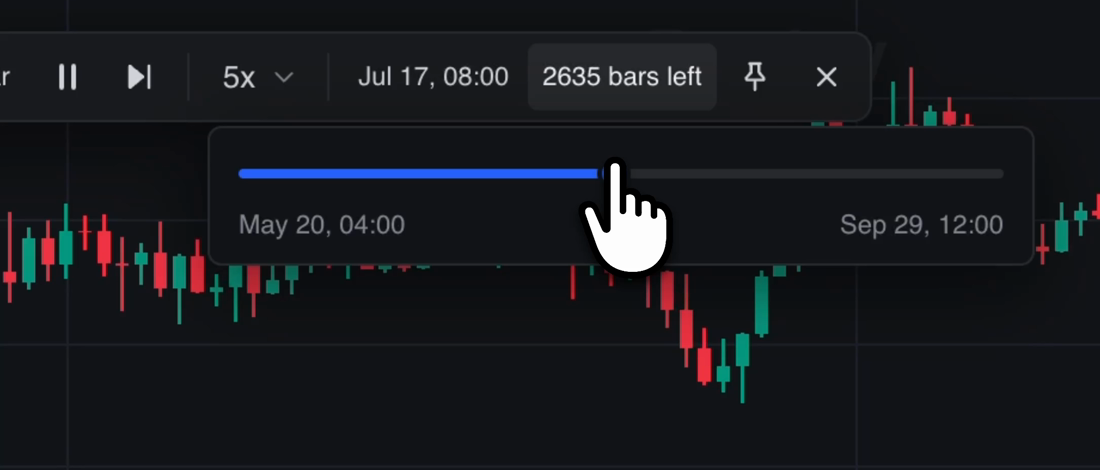
3. Choose a starting date or use the history slider to select a specific candle.
4. Set the update speed, then start playback.
The chart advances from your chosen point, revealing the candles that follow it. Start before the setup you want to study so you can review the information available as it develops.
Open Replay from the chart's topbar.
## Choose a starting point [#choose-a-starting-point]
Select a **start date** when you already know the period you want to revisit. Use the **history slider** when you want to find a particular candle or move through the available chart history visually.
For example, start just before price reaches a level you are watching. Decide what would confirm or invalidate your setup, then play forward to see what follows. Choose another starting point to review a different occurrence.
[](/images/charts/replay/history-slider.png)
Use the history slider to move through the available candles. The toolbar shows the replay date and bars left.
## Control playback speed [#control-playback-speed]
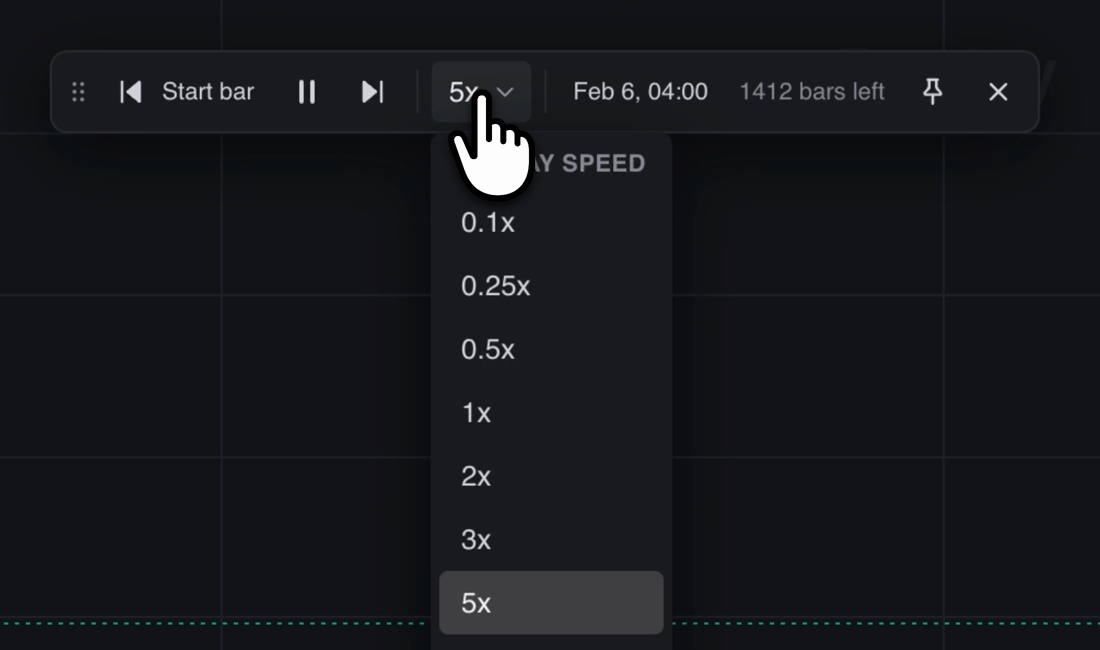
The **update speed** controls how quickly candles appear during playback. Open the speed dropdown in the toolbar, shown as a multiplier such as **1x** or **5x**. Use a slower pace to inspect individual bars or a faster pace to review a longer stretch of history. Use **Play/Pause** to start or pause playback.
Playback speed and chart timeframe serve different purposes: the timeframe determines what each candle represents, while playback speed determines how quickly the replay reveals those candles.
[](/images/charts/replay/playback-speed.png)
Choose a playback speed from the toolbar's multiplier menu.
## Floating or docked toolbar [#floating-or-docked-toolbar]
The Replay toolbar can **float over the chart** or be **docked/pinned**.
* **Floating:** position the controls where they are convenient for the part of the chart you are reviewing.
* **Docked/pinned:** keep the controls in a fixed location while you follow the chart.
Use the toolbar's **pin** control to switch its placement.
## Replay with multiple charts [#replay-with-multiple-charts]
Replay Mode supports [multi-chart layouts](/platform/charts/introduction#layouts). Open your layout, select **Replay**, choose the starting point, and set the update speed to review the charts together as playback progresses.
The number of charts available in a layout depends on your plan; Replay Mode itself is free.
Review multiple charts together as the replay progresses.