# Trades Log (/platform/charts/strategies/trades-log)
Open the [Backtest viewer](/platform/charts/strategies#backtest-viewer), then select **Trades Log**. Use this tab to inspect the trades behind the summary statistics and to see how results are distributed across individual dates.
The **View Mode** control switches between the list icon for the trade table and the calendar icon for daily results.
*Screenshots show an example BTCUSD backtest. Select an image to view it at full size.*
## Trade table [#trade-table]
[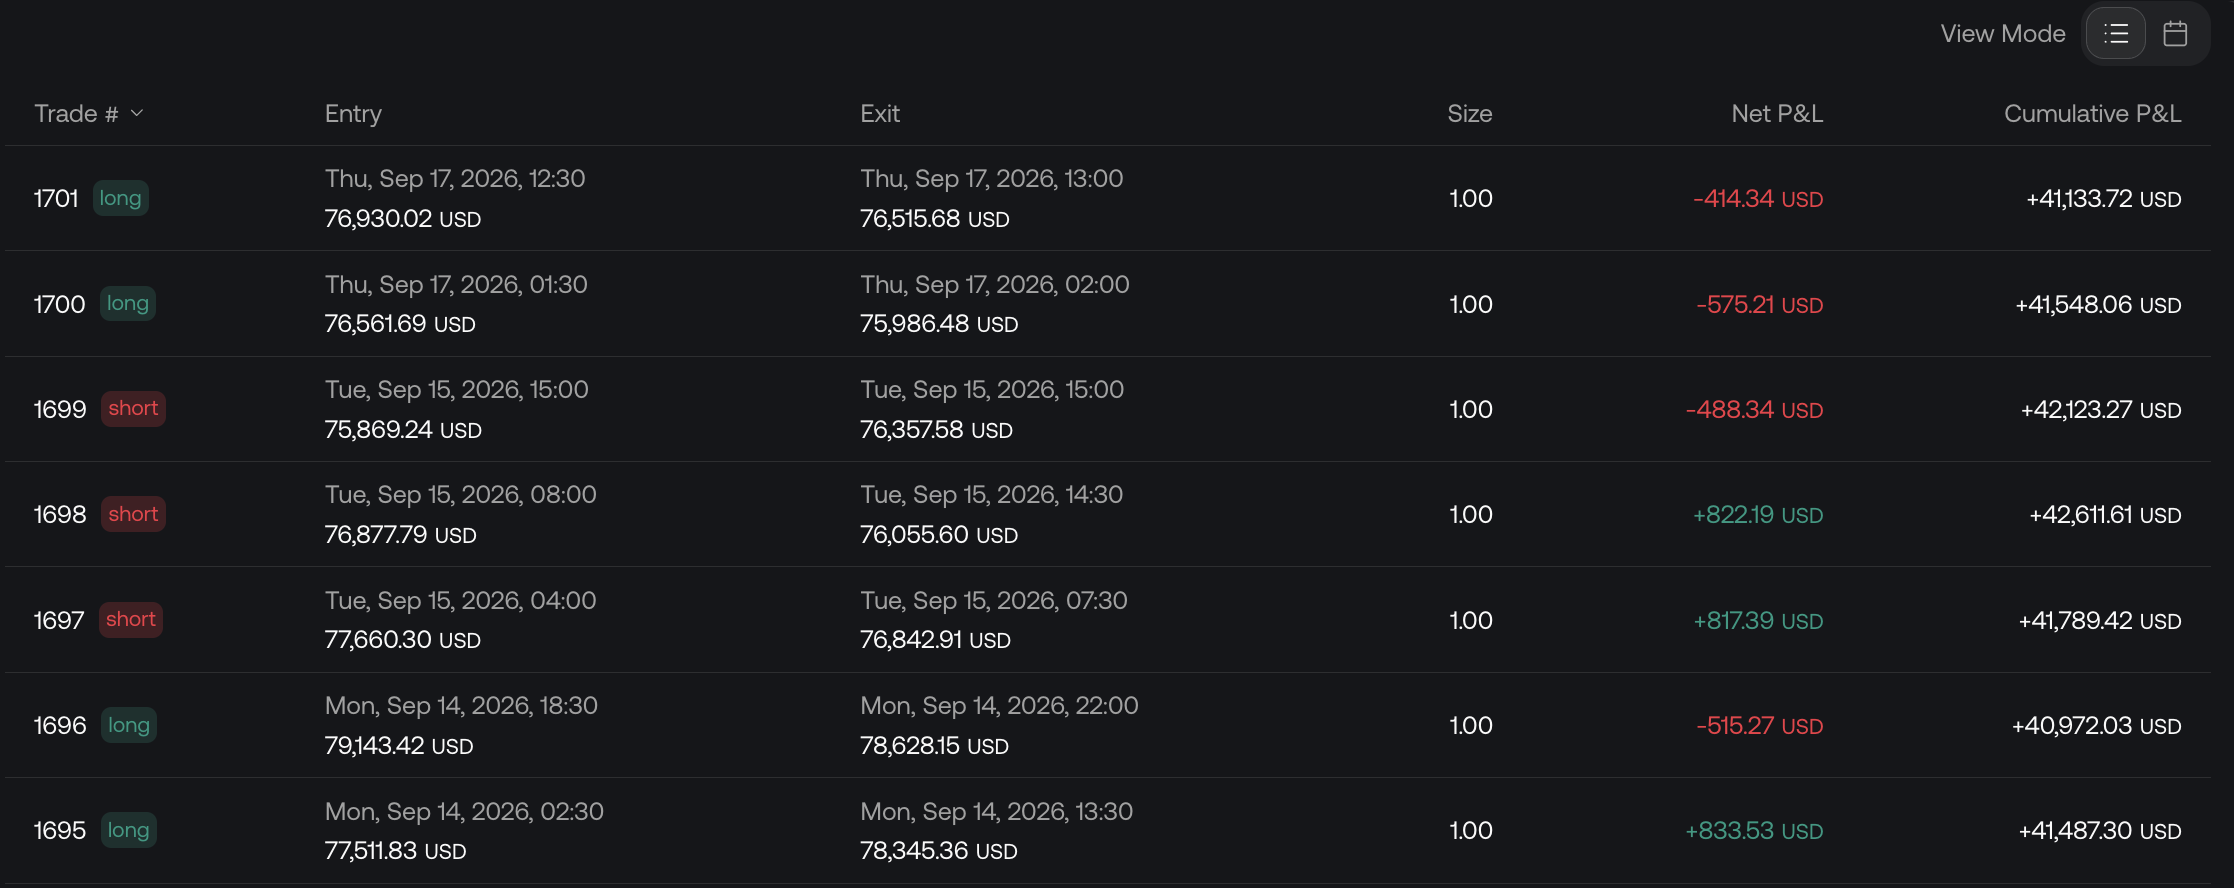](/images/charts/strategies/trades-log.png)
Each row contains one trade's entry, exit, size, and reported result.
| Column | Meaning |
| ------------------- | --------------------------------------------------------------------------------------------------- |
| **Trade #** | Trade identifier with a **long** or **short** direction label. |
| **Entry** | Entry date, time, and price. |
| **Exit** | Exit date, time, and price. |
| **Size** | Position quantity for that trade, not its dollar profit or loss. |
| **Net P\&L** | The individual trade's reported profit or loss. Green values are positive; red values are negative. |
| **Cumulative P\&L** | Running trade P\&L through that trade in the original sequence. |
Entry and exit prices explain the direction of the result: a long benefits from a higher exit price, while a short benefits from a lower exit price. Position size and the instrument's value per price movement also matter when interpreting the amount.
Cumulative P\&L is different from a single trade's P\&L. For example, results of +$100, −$40, and +$20 produce cumulative values of +$100, +$60, and +$80. It is a running profit/loss total, not the account balance including starting capital.
The table uses the label **Net P\&L**, but its trade-level totals can differ from the headline Performance result. Do not assume that the label alone confirms identical cost treatment across views.
## Sort the table [#sort-the-table]
Select a column heading to sort the trades by that field. Select it again to reverse the direction; the arrow indicates the active sort order.
* **Trade #**, **Entry**, and **Exit** help inspect the sequence and timing of trades.
* **Size** helps compare trades with different position quantities.
* **Net P\&L** brings the largest winners or losers together.
* **Cumulative P\&L** helps locate high and low running totals.
Sorting changes the order of the rows, not the original trade sequence or the cumulative result attached to each trade. Return to **Trade #** when reading how results developed through the backtest.
## Calendar view [#calendar-view]
[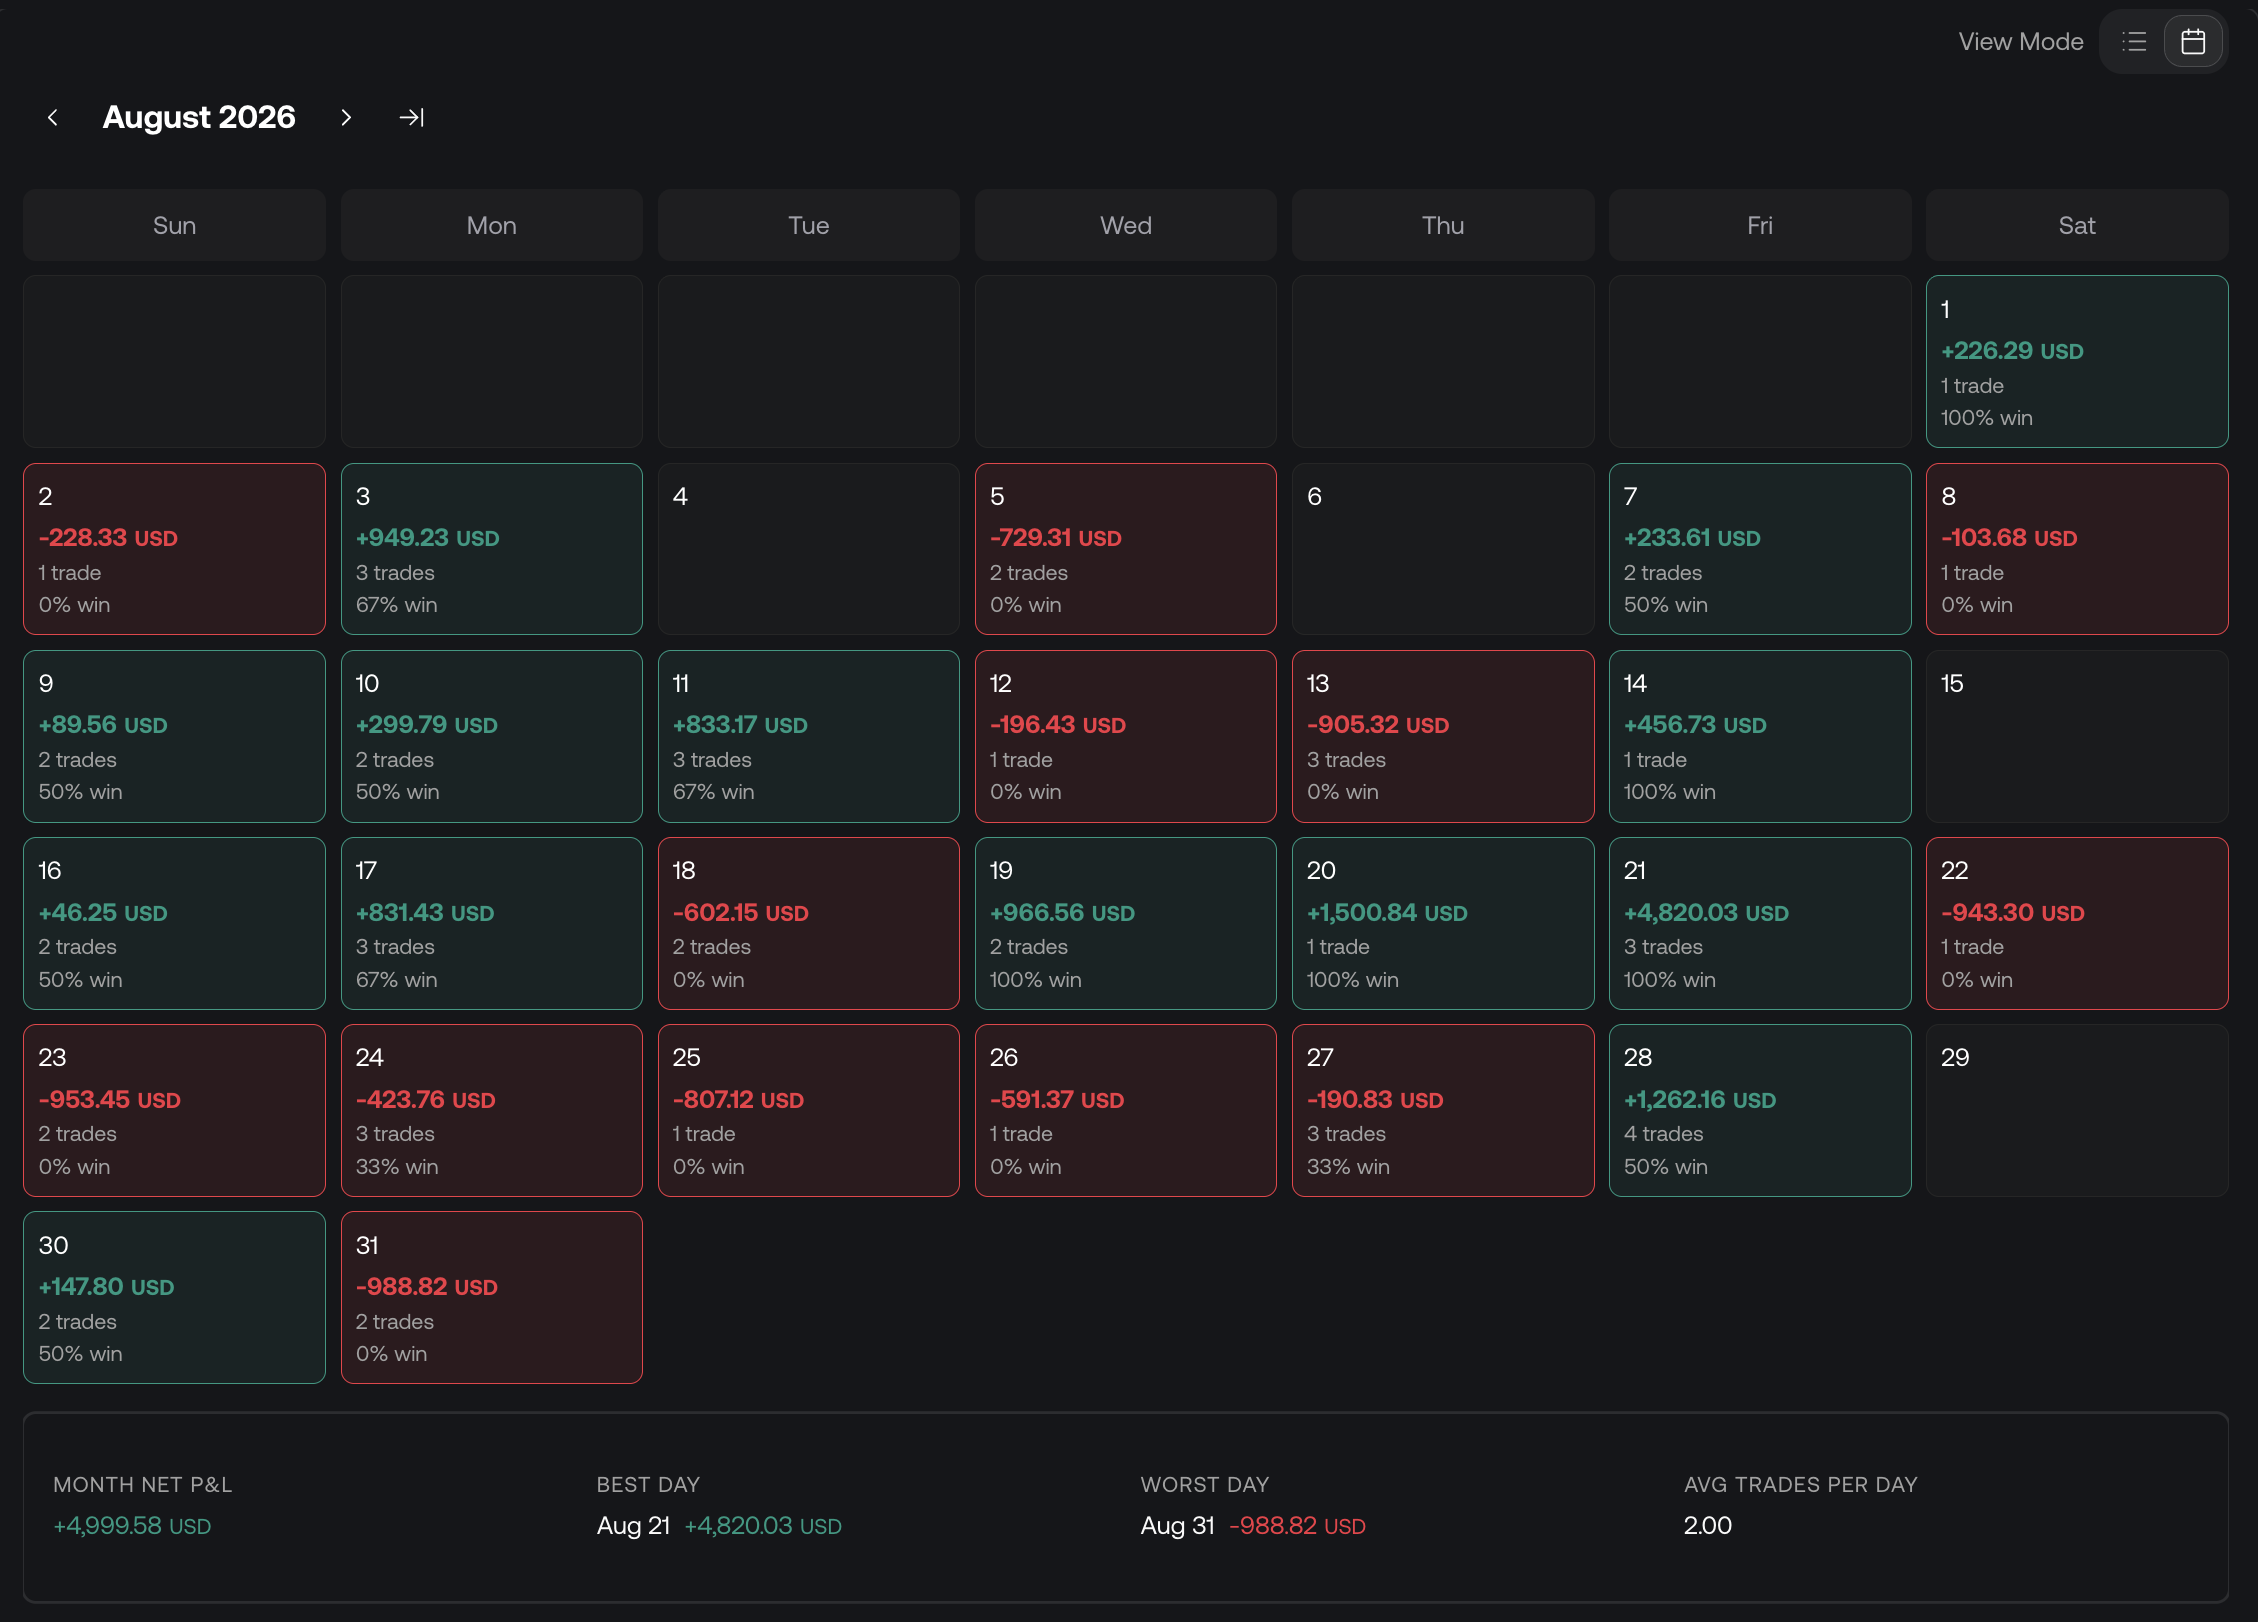](/images/charts/strategies/trades-calendar.png)
The calendar combines each day's results and summarizes the selected month below.
Select the **calendar icon** under View Mode. Use the left and right arrows beside the month to move through the calendar.
A populated day shows:
* **P\&L**: the combined result shown for that date.
* **Trades**: the number of trades included for the day.
* **Win rate**: the percentage of those trades that won.
Green cells indicate positive daily results and red cells indicate negative results. An empty cell has no reported trade results for that date; it is not a forecast for a future day.
A day can be profitable with fewer than half its trades winning if the winners are larger than the losers. Conversely, a high daily win rate can still accompany a loss. Read all three values together.
### Monthly summary [#monthly-summary]
| Metric | Meaning |
| ---------------------- | ------------------------------------------------------ |
| **Month Net P\&L** | Combined P\&L reported for the selected month. |
| **Best Day** | Date and result of the month's strongest day. |
| **Worst Day** | Date and result of the month's weakest day. |
| **Avg Trades per Day** | The average daily trade count reported for that month. |
Months at the start or end of the backtest may only contain part of a month's data. Keep the backtest date range in view when comparing monthly totals.
For aggregated daily and weekday charts, see [Performance](/platform/charts/strategies/performance#daily-and-weekday-results). For distributions and holding durations, see [Trades Analysis](/platform/charts/strategies/trades-analysis).