# Backtest loop (/platform/quant/backtest-loop)
The backtest loop is Quant's way of searching for a strategy instead of writing one at a time. You give it measurable goals, such as "at least 100 trades, a 40% win rate, max drawdown under 30% and a profit factor of 1.3", and Quant, our coding agent, writes a Pine Script® strategy, backtests it, scores it against your goals, and writes the next one, again and again, until it finds as many strategies as you asked for or runs out of time.
A strategy counts as found only when it meets every goal twice: on the part of the history it was built on (**in sample**), and on a part kept aside that Quant never sees (**out of sample**). That second check is what separates a strategy that fits the past from one that holds up on data it wasn't tuned to.
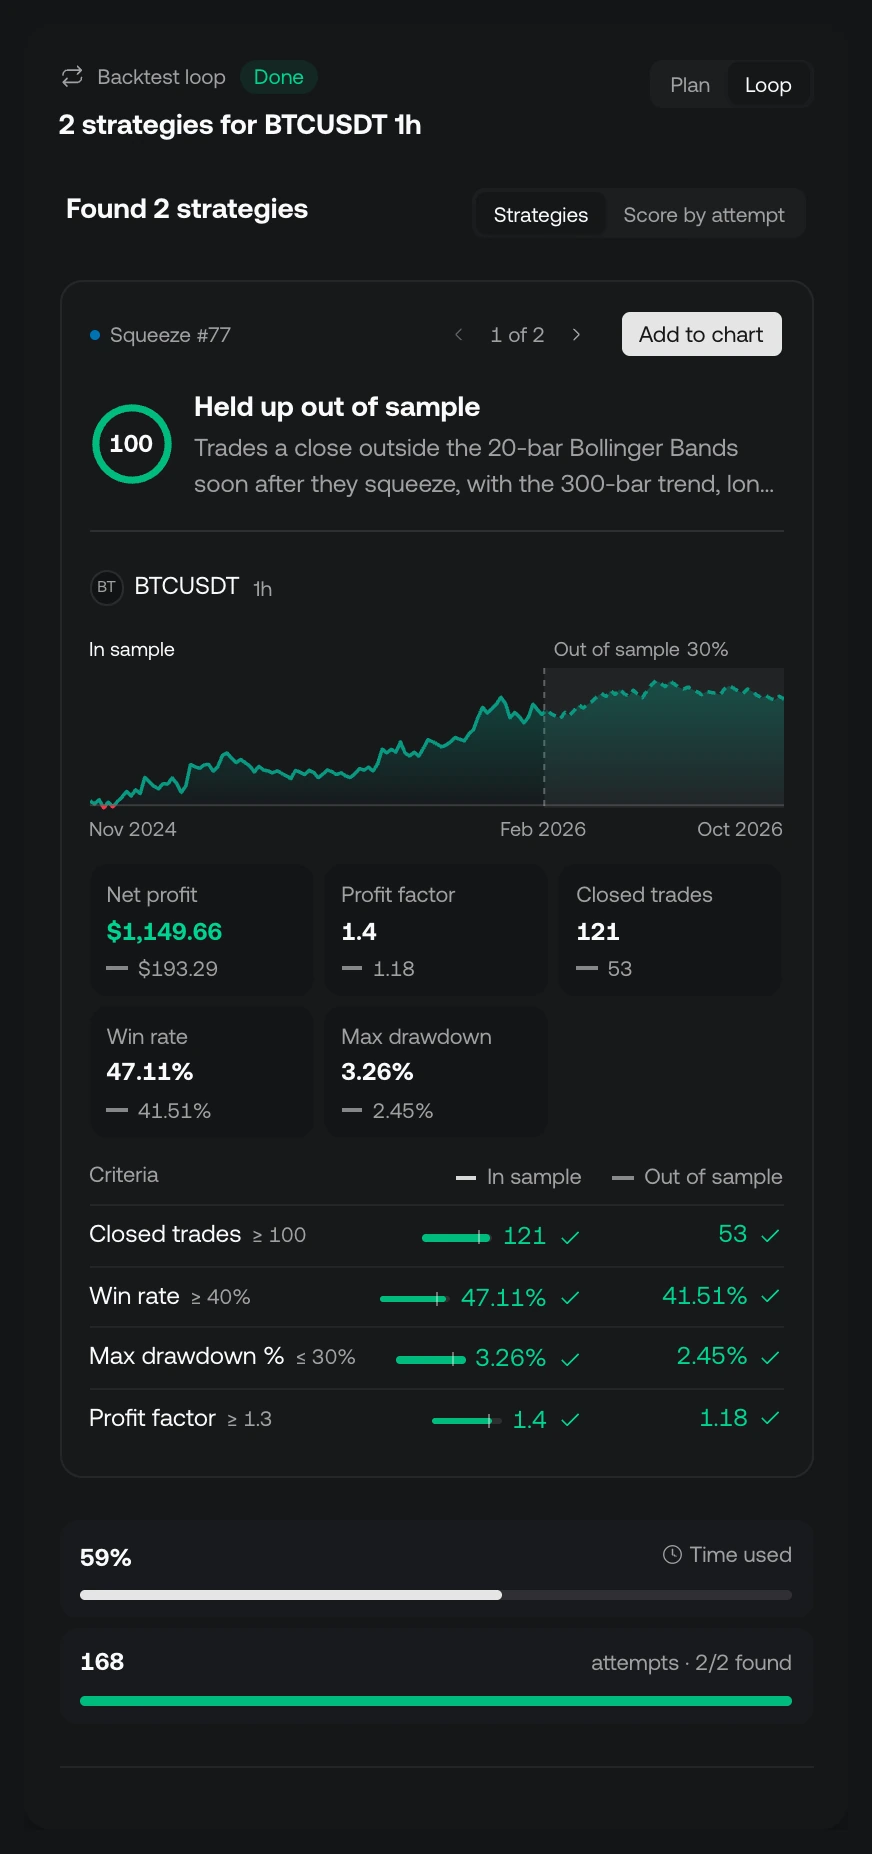
A finished loop: 2 of 2 strategies found, each met every goal in sample and out of sample.
Backtesting is research, not prophecy. A found strategy is evidence that an idea held up on the history it was tested on, including history it never saw. It doesn't predict how the strategy will trade next.
## Who can use it [#who-can-use-it]
Backtest loops run on the **Ultimate** and **Ultra** plans. On every other plan you can still plan one, and see exactly what it would do, before you decide.
| Your plan | What you can do |
| -------------------------------------- | ---------------------------------------------------------------------------------------------------------------------------------------------------------------------------------------------- |
| **Ultimate** or **Ultra** | Plan a loop and run it with **Execute**. |
| **Free**, **Essential** or **Premium** | Turn the loop on, answer Quant's questions and get the whole plan. The plan card shows **Upgrade to Ultimate** where **Execute** would be. After you upgrade, come back to the chat to run it. |
| **Ultimate** or **Ultra**, paused | The plan card shows **Resume plan** instead. Resume your plan to run the loop. |
Two more things follow your plan:
* **Usage.** A loop draws on your Quant usage and needs some left to start. See [Usage](#usage).
* **History.** Each market can be tested as far back as your plan's historical bars reach. See [Plans](/platform/account/plans).
## When to use it [#when-to-use-it]
Use the backtest loop when you know what a good result looks like and you'd rather not try versions one by one. It fits requests like:
* "Find a BTCUSDT 1h strategy with at least 100 trades, a 40% win rate and max drawdown under 30% over the last two years."
* "Improve my strategy until its profit factor is above 1.5 on both ES1! and NQ1!, without the drawdown getting worse than 15%."
* "Build a strategy on the RSI from my chart that trades only long and keeps losing streaks to 5 or fewer."
* "Find a strategy that would pass this prop firm challenge." (See [Prop firm challenges](#prop-firm-challenges).)
[Example use cases](#example-use-cases) walks through requests like these, with what to look for in each.
For a single strategy you want to read and adjust as you go, ask Quant for it in the chat. See [Strategies](/platform/quant/strategies).
## Start a loop [#start-a-loop]
Turn on **Backtest loop** in the composer, then describe the strategy and the goals it must meet. There are three ways to turn it on:
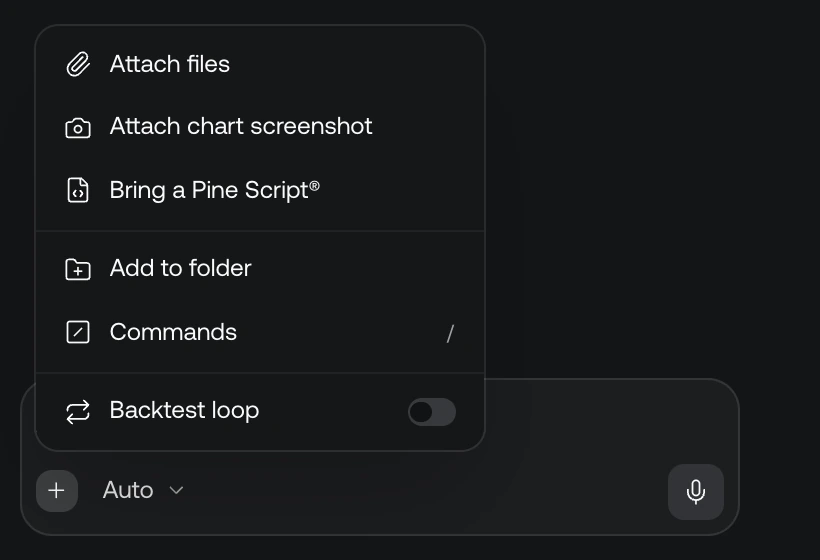
* **The + menu.** Open **+** beside the prompt and switch on **Backtest loop**.
* **The `/loop` command.** Type `/loop` in the composer, or pick it from **Commands**. You can type your request right after it: `/loop find a BTCUSDT 1h strategy…`.
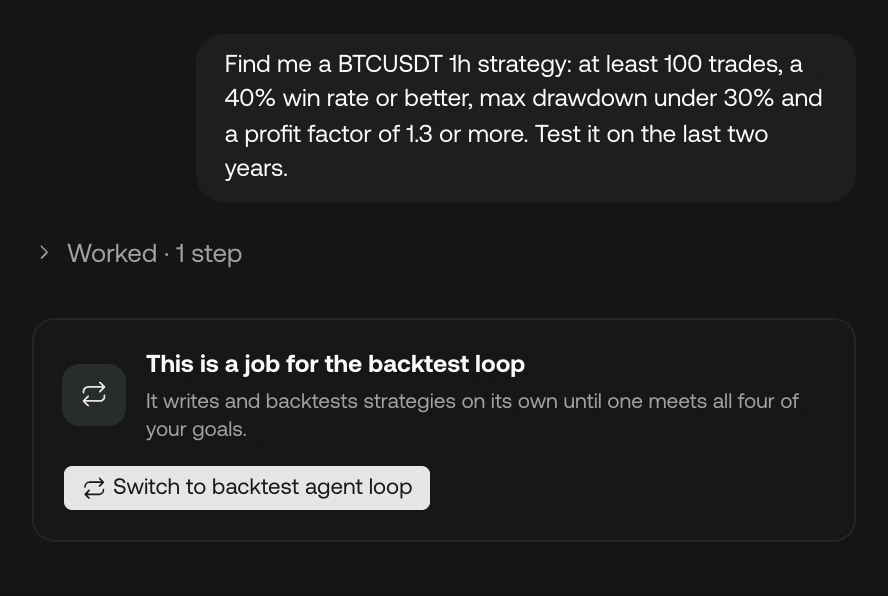
* **When Quant offers it.** If you ask for something that needs strategies written and backtested until they meet measurable goals, Quant may answer with **This is a job for the backtest loop**. Choose **Switch to backtest agent loop** to turn it on and send your request again as a loop.
The
**Backtest loop**
switch in the composer's
**+**
menu.
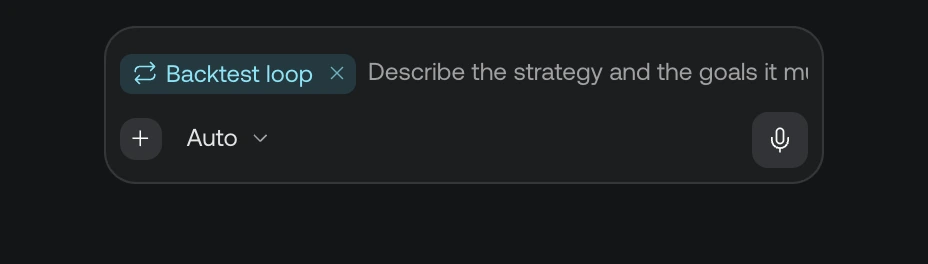
While it's on, the composer shows a **Backtest loop** chip and asks you to describe the strategy and its goals. To turn it off, remove the chip, switch it off in **+**, or pick `/loop` again. `/loop` and `/plan` turn each other off: one message is either a loop or a [plan](/platform/quant/introduction).
Quant can offer the loop when a request calls for it.
### Say what passes [#say-what-passes]
The loop can only judge what it can measure, so put numbers on your goals. Say:
* **The market and timeframe**, or leave them to the chart in front of you. A loop can test one strategy on up to 5 markets at once.
* **The goals**: the criteria a strategy must meet, with a number for each ("profit factor of 1.3 or more", "no more than 20 trades a week").
* **The history to test on**, if it matters ("the last two years", "2022 to 2025").
* **Anything the strategy must or mustn't do**: long only, no trades held over the weekend, built on a specific indicator, or "improve my script" with the script open.
## Answer Quant's questions [#answer-quants-questions]
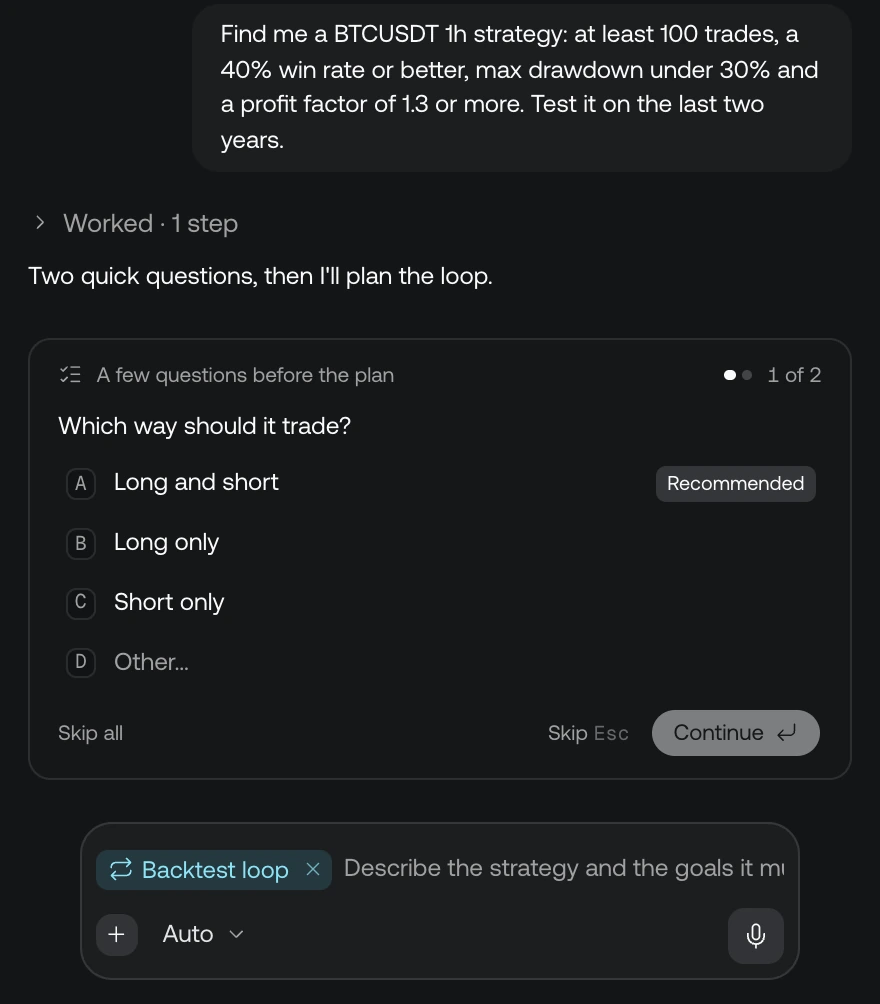
When something important is missing, Quant asks up to four quick questions before it writes the plan, such as which directions to trade or how many strategies to find. Pick an answer (the one Quant suggests is marked **Recommended**), choose **Other…** to write your own, or **Skip** a question and let Quant decide. **Skip all** goes straight to the plan. **Continue** moves to the next question, and **Send answers** sends them to Quant as your next message.
Quant asks before it plans when your request leaves something open.
## Review the plan [#review-the-plan]
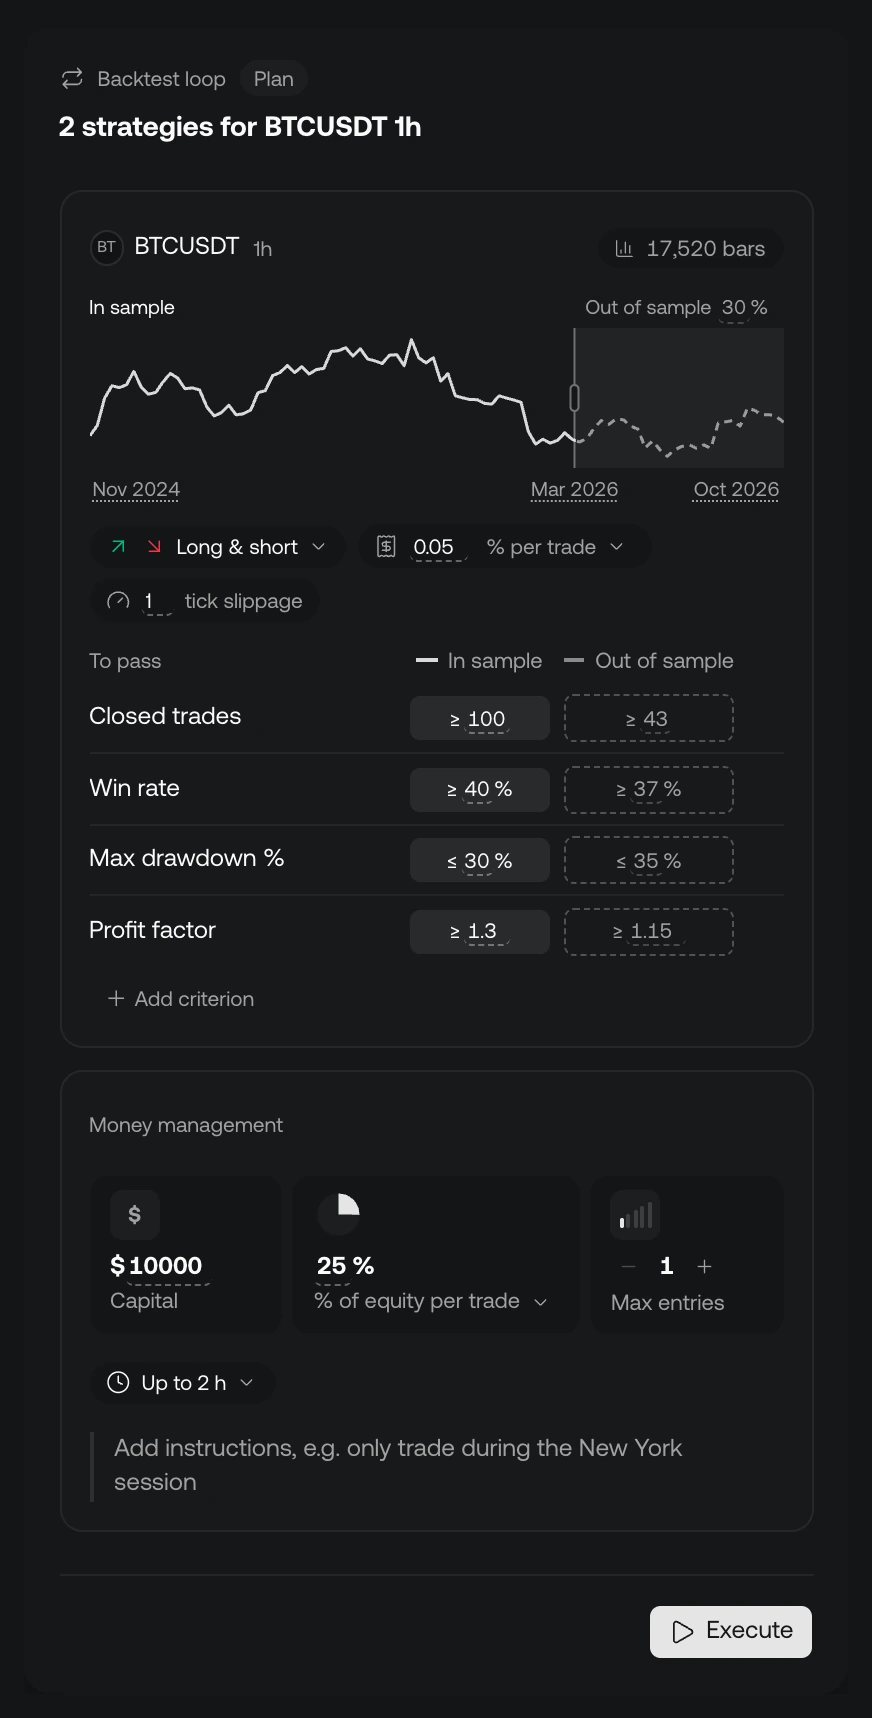
Quant then shows the **Backtest loop plan**: everything the loop will do, laid out in one card. Nothing runs until you choose **Execute**, and you can change any part of it first. Edits mark the card **Edited**; **Reset** puts Quant's plan back.
The plan card. Every field in it can be changed before you press
**Execute**
.
### Markets and tested range [#markets-and-tested-range]
Each market in the plan has its own tab, with its timeframe and the number of bars it will test. The price line shows the tested range, split into its **In sample** part (where strategies are built and tuned) and its **Out of sample** part (kept aside, shaded). Drag the split to hold back more or less. Quant chooses how much to hold back for each market, usually the last 20% to 40% of the range. Click the dates to change the range.
The range can't end in the future, and it can't reach further back than your plan's [historical bars](/platform/account/plans). When it would, the card says how many bars your plan holds and the date the market's test starts from.
Under the price line, set for each market:
* **Directions it trades**: **Long & short**, **Long only** or **Short only**.
* **Commission**: a percentage per trade, dollars per contract, dollars per order, or none.
* **Slippage**, in ticks.
* **Trading hours**, for markets with sessions such as US stocks and futures: **Regular hours** or **Extended hours** with pre- and post-market.
### To pass [#to-pass]
**To pass** lists the criteria, each with two thresholds: one for **In sample** and one for **Out of sample**. Quant sets the out-of-sample thresholds with common sense for a shorter window it never sees: counts such as trades are scaled to its length (marked **Scaled to its length**), and ratios are a little looser. Click any threshold to change it, or remove a criterion you don't need.
A threshold is a minimum ("at least 100 closed trades"), a maximum ("max drawdown of 20% at most"), or both, for a range ("a win rate between 40% and 70%"). Each market in the plan has its own list.
### Criteria you can set [#criteria-you-can-set]
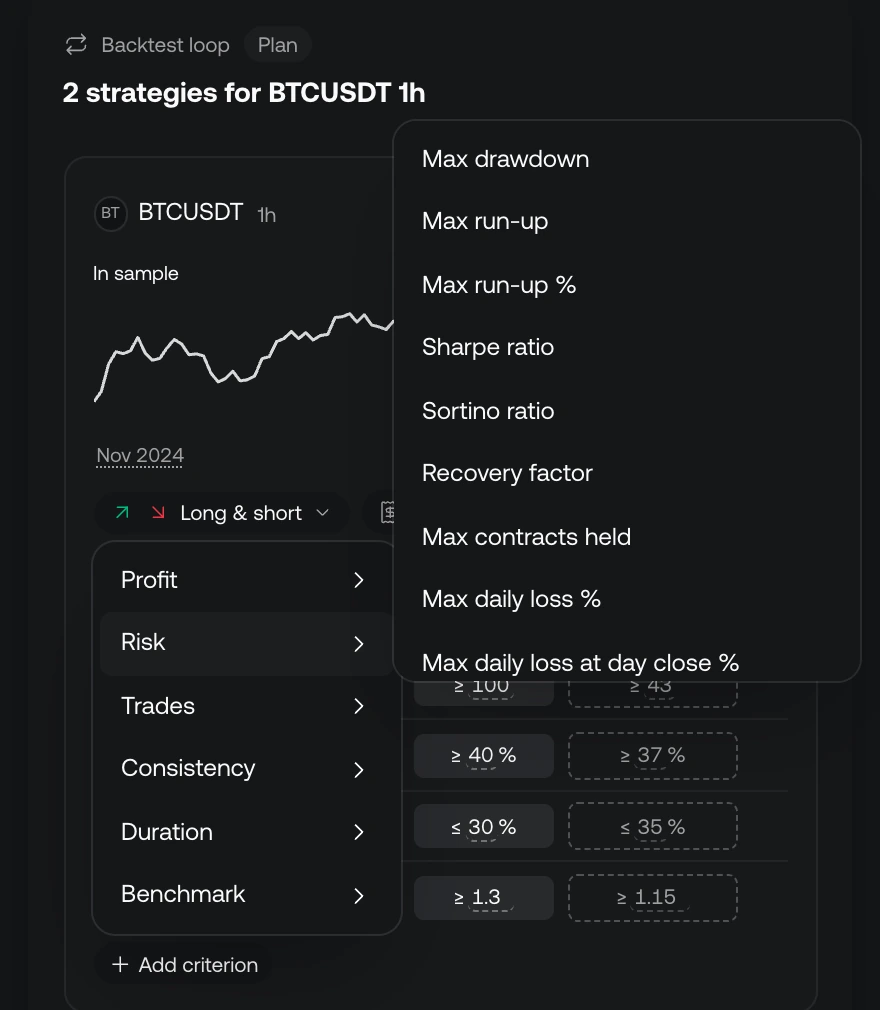
**Add criterion** offers every measure the loop can check, in six groups:
| Group | Criteria |
| --------------- | ----------------------------------------------------------------------------------------------------------------------------------------------------------------------------------------------------------------------------------------------------------------------------------------------------------------------------------------------------------------------------------------- |
| **Profit** | Net profit, Net profit %, Gross profit, Gross loss, Open profit, Profit factor, CAGR, Long net profit %, Short net profit %, Average day %, Best day % |
| **Risk** | Max drawdown, Max drawdown %, Max run-up, Max run-up %, Sharpe ratio, Sortino ratio, Recovery factor, Max contracts held, Max daily loss %, Max daily loss at day close %, Max drawdown end-of-day trailing %, Max loss on one trade %, Calmar ratio, Ulcer index, Monte Carlo drawdown % |
| **Trades** | Closed trades, Open trades, Winning trades, Losing trades, Breakeven trades, Win rate, Average trade, Average trade %, Average winning trade, Average losing trade, Largest winning trade, Largest losing trade, Payoff ratio, Trading days, Winning days, Losing days, Profitable days, Most trades in a day, Largest size vs average, System quality (SQN), Average trade vs commission |
| **Consistency** | Best day share of profit, Best trade share of profit, Profitable months, Worst month %, Net profit without the best trades %, Equity curve R², Longest stretch without a new high |
| **Duration** | Average trade length, Longest trade, Shortest trade, Trades per week, Longest winning streak, Longest losing streak, Time in market, Trades held overnight, Trades held over a weekend |
| **Benchmark** | Buy & hold profit, Buy & hold return, Outperformance vs buy & hold |
A few criteria take a setting of their own: **Profitable days** counts days that closed up by at least the percentage you set (0.5% unless you change it), **Net profit without the best trades %** leaves out the number of best trades you choose (5 by default), and **Monte Carlo drawdown %** is the drawdown a share of 1,000 reshuffles of the trade order stays within (95% by default). Day-based criteria count trading days the way prop firms do: a day ends at 5 PM New York time.
Most names say what they measure. These need a line more. Where a criterion is a percentage of money, it is a percentage of the plan's starting capital.
| Criterion | What it measures |
| -------------------------------------------------- | --------------------------------------------------------------------------------------------------------------------- |
| **Long net profit %**, **Short net profit %** | The net profit of the long trades alone, or of the short trades alone. |
| **Average day %** | The average closed profit per trading day. |
| **Best day %** | The best trading day's closed profit. Set a maximum to cap what one day may make. |
| **Max daily loss %** | The worst trading day at its lowest point, open losses included. A daily loss limit. |
| **Max daily loss at day close %** | The worst trading day, measured at its close. |
| **Max drawdown end-of-day trailing %** | The deepest fall below the highest day-close balance, open losses included. An end-of-day trailing max loss. |
| **Max loss on one trade %** | The worst loss a single trade reached, open or closed. Risk per trade. |
| **Calmar ratio** | CAGR divided by max drawdown %. |
| **Ulcer index** | How deep drawdowns go and how long they last, from daily closes. Lower is smoother. |
| **Monte Carlo drawdown %** | The max drawdown that your chosen share of 1,000 reshuffles of the trade order stays within. |
| **Profitable days** | Trading days that closed up by at least the percentage you set. |
| **Most trades in a day** | The most trades opened on one trading day. |
| **Largest size vs average** | The largest position size divided by the average one. A lot-size consistency rule. |
| **System quality (SQN)** | The average trade divided by its standard deviation, times the square root of the trade count (capped at 100 trades). |
| **Average trade vs commission** | The average net trade divided by the average commission per trade. |
| **Best day share of profit** | The best trading day's profit as a share of the net profit. A prop firm consistency rule. |
| **Best trade share of profit** | The best trade's profit as a share of the net profit. |
| **Profitable months** | The share of the tested calendar months that ended in profit. |
| **Worst month %** | The worst calendar month's closed profit, negative for a loss. |
| **Net profit without the best trades %** | The net profit once the best trades are left out, as many as you choose. |
| **Equity curve R²** | How straight the daily equity curve rises, from 0 to 1. |
| **Longest stretch without a new high** | The longest run of calendar days without a new equity high. |
**Add criterion**
, with the
**Risk**
group open.
### Money management and the rest [#money-management-and-the-rest]
* **Capital**, the **order size** (a percentage of equity, dollars, or units per trade) and **Max entries** (how many entries can be open in the same direction; 1 means one position at a time). Futures are tested on margin, so a contract doesn't have to fit inside the account at full value.
* **How many strategies** to find, from 1 to 5. Found strategies must trade differently from each other: two versions that take the same trades count once.
* **Time limit**: up to 10 minutes, 30 minutes, 1 hour, 2 hours or 4 hours. Quant picks 30 minutes unless you ask for another.
* **Instructions**: anything else the strategies should respect, in your words ("only trade during the New York session").
* **Improves your script** or **Start from scratch**, when you asked the loop to work on a script of yours.
If the goals are hard to meet together, the card says so (**An ambitious plan**) and suggests which one to ease. You can also ask Quant in the chat to change the plan; it sends a new card, and the earlier one is marked **Earlier plan** and can no longer start.
## While it runs [#while-it-runs]
Press **Execute** and the card becomes the loop's live view. The loop runs on our servers: you can close the chat, switch workspaces or close the tab, and it keeps going.
Each attempt goes through the same steps:
1. **Write.** Quant writes a strategy in Pine Script®, or improves one of its best attempts so far.
2. **Check.** The script must compile. Attempts that look into the future (lookahead) or repaint are rejected, and an attempt that repeats an earlier one, in code or in the trades it takes, is skipped.
3. **Backtest.** The strategy runs on every market in the plan, in sample and out of sample, with your costs and money management.
4. **Score.** The results are checked against every criterion by code, not by Quant.
The loop explores several **strategy families** at once, such as trend following, breakouts or pullbacks, and works on a few attempts at the same time. A family that stops improving is retired, and a new idea can take its place.
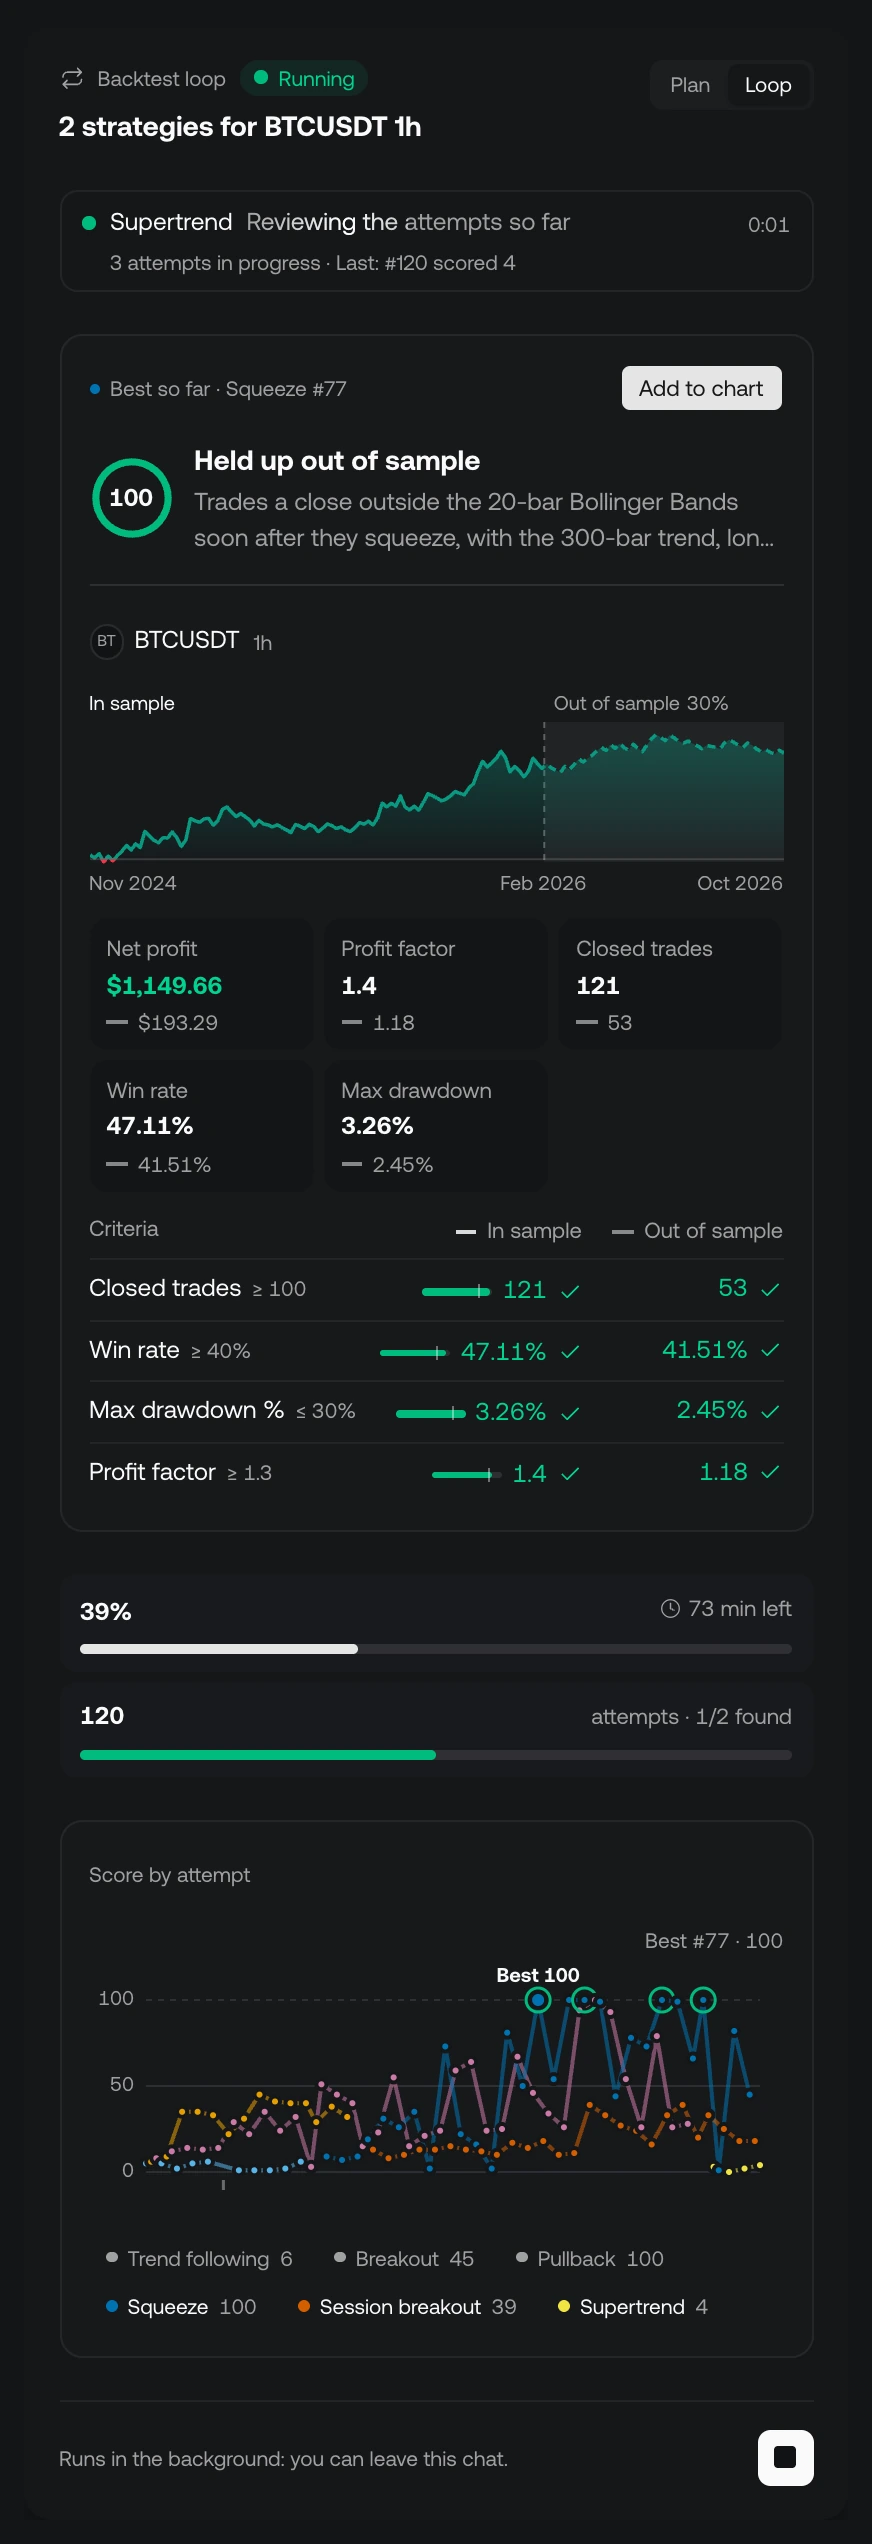
A running loop: what it's working on, the best strategy so far, and every attempt's score.
The live view shows:
* **Working now**: the family and step of the attempts in progress, and how the last one scored.
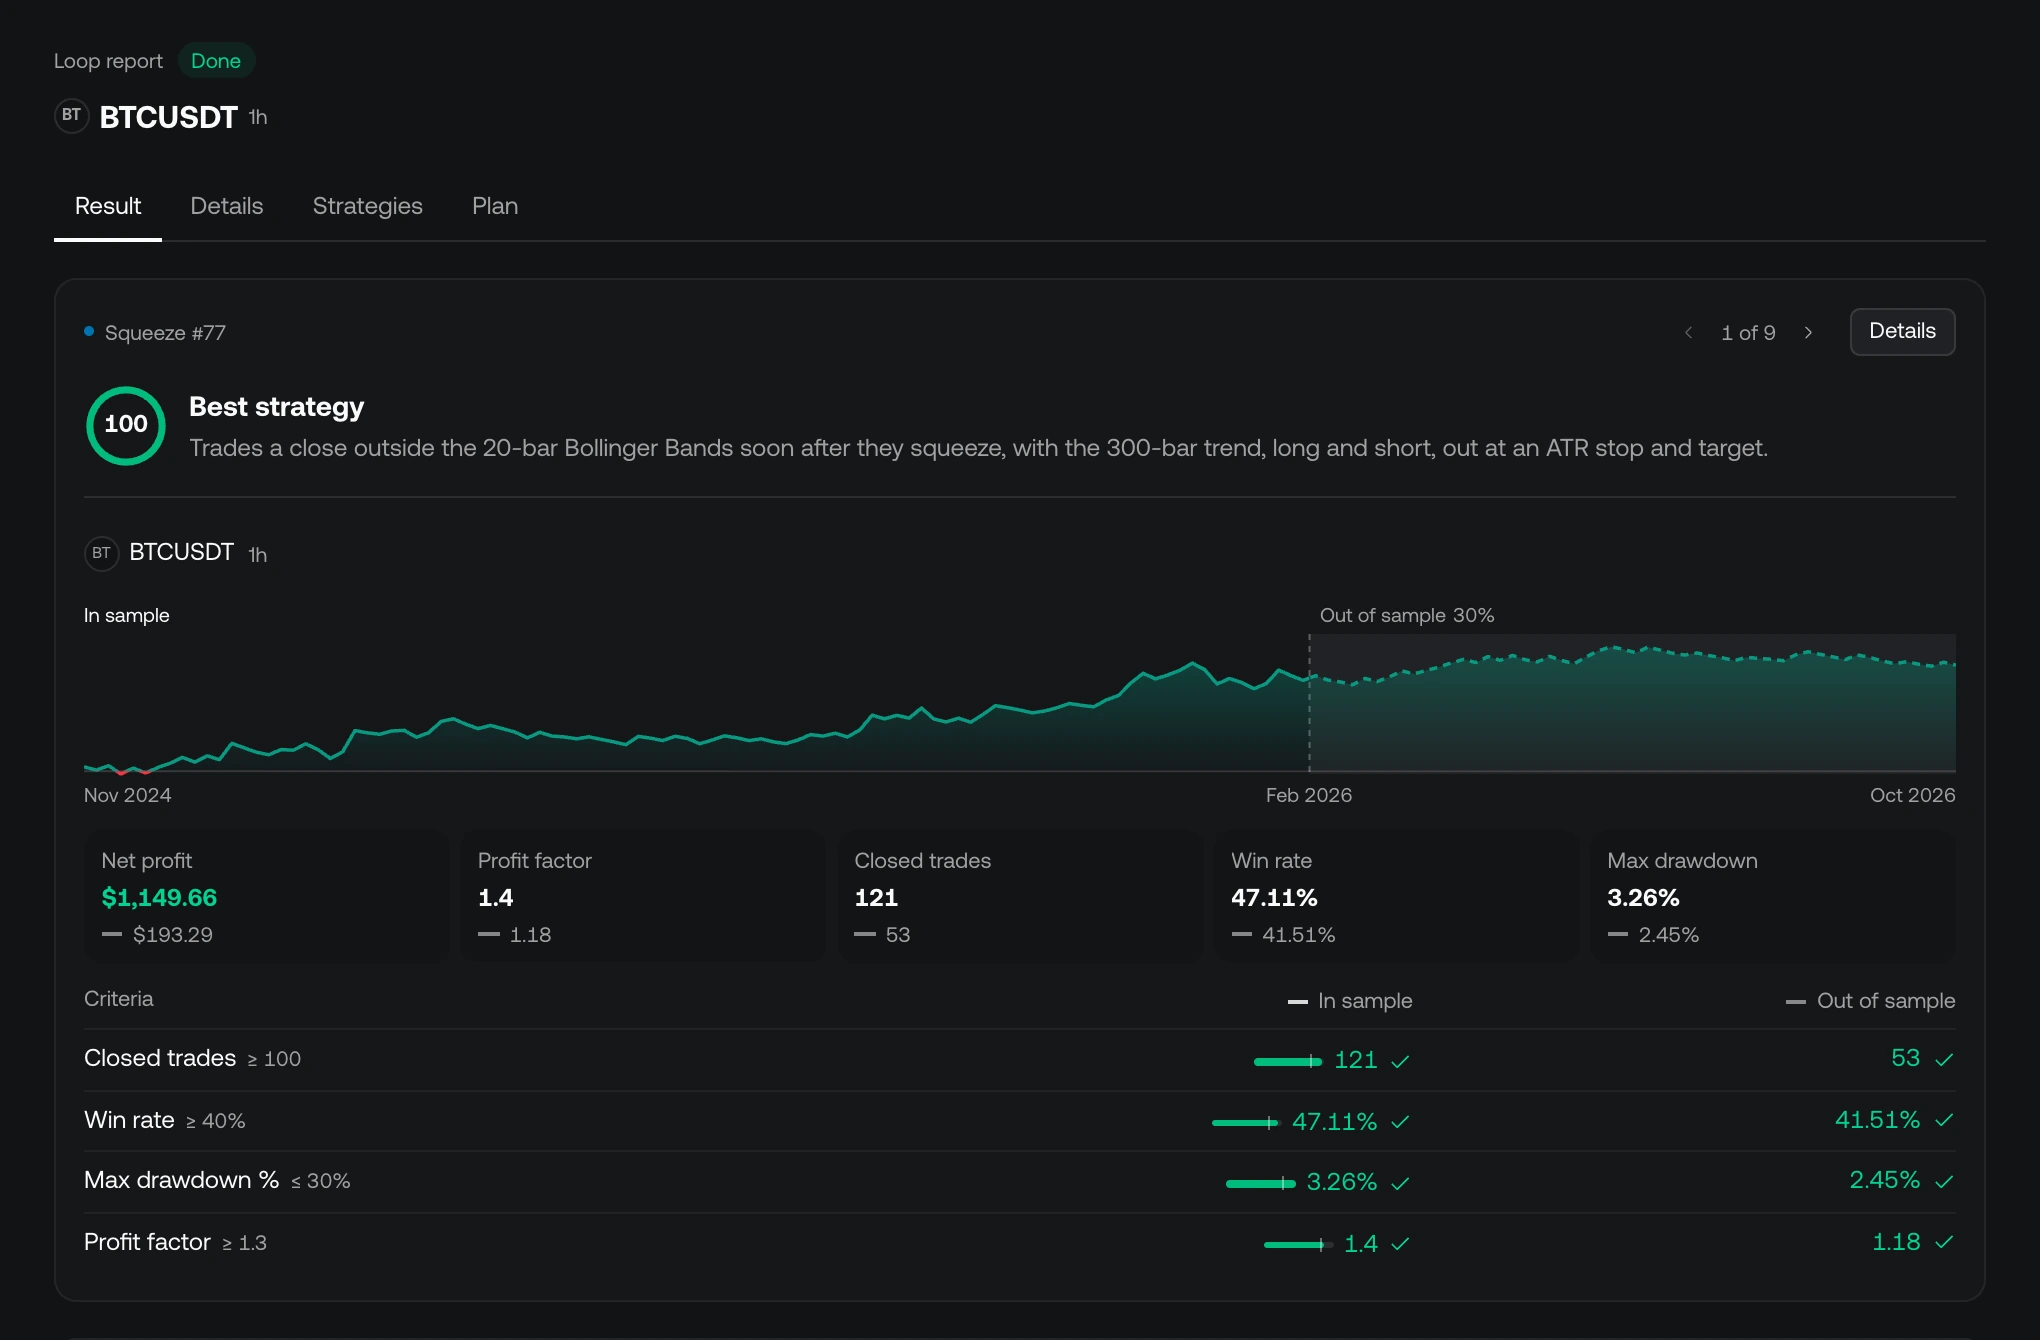
* **Best so far**: the closest strategy yet, with its description, its equity curve across the in-sample and out-of-sample parts, its key numbers, and each criterion marked met or not met on both. **Add to chart** puts it on your chart at any time.
* **Time used**, with the minutes left, and the number of **attempts** with how many strategies have been **found**.
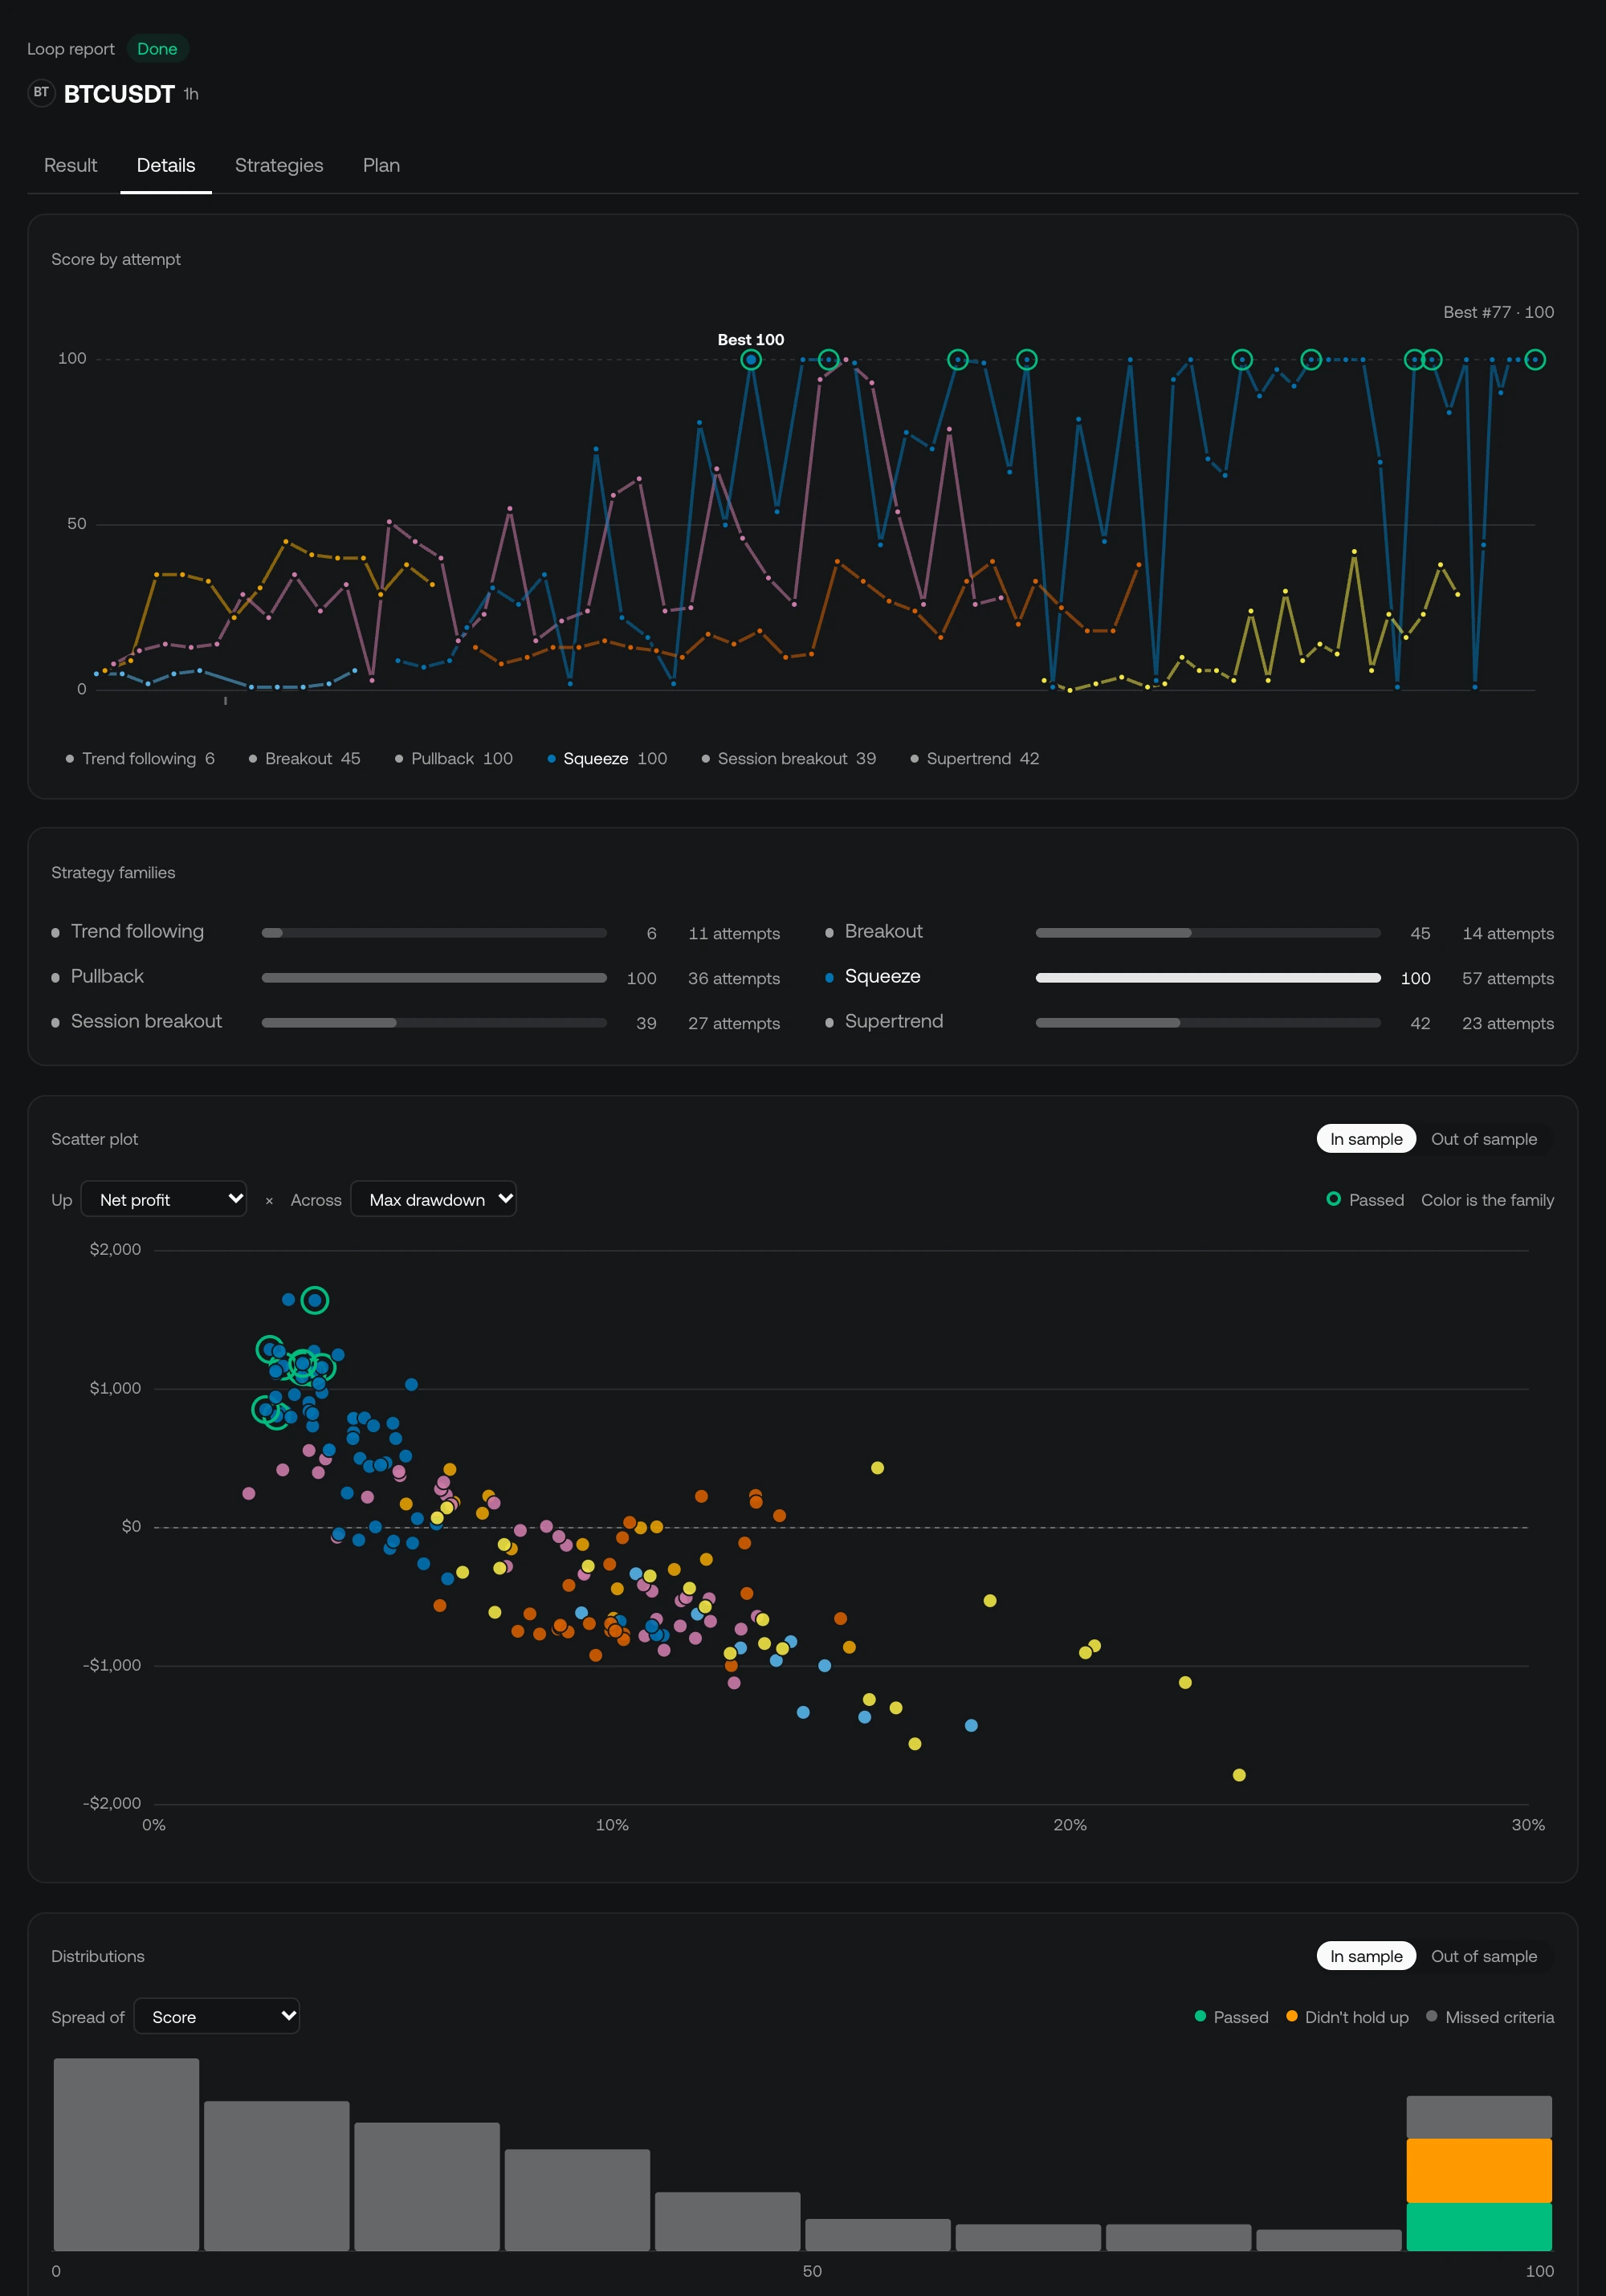
* **Score by attempt**: every attempt's score, colored by family, with retired families marked.
* How much of your Quant usage the loop has used so far, and about how much it will have used by its time limit at its current pace.
**Stop and keep results** ends the loop early. Everything it found so far stays, and you can pick it up again later.
### How attempts are scored [#how-attempts-are-scored]
Every attempt that reaches a backtest gets a **score** out of 100: how close it came to your criteria in sample. 100 meets them all. The out-of-sample part is checked separately and only as pass or fail: its numbers are never shown to Quant, so it can't tune strategies to it.
An attempt passes when it meets every criterion in sample and holds up out of sample, on every market in the plan. Each attempt ends one of these ways:
| Outcome | What it means |
| ---------------------------------------- | ----------------------------------------------------------------------------------------------- |
| **Passed every check** | Met every criterion in sample and out of sample. |
| **Met your criteria, not out of sample** | Met every criterion in sample, then missed out of sample. A sign of a strategy fit to the past. |
| **Missed criteria** | Missed one or more criteria in sample. |
| **Didn't compile** | The script had errors, so it never reached a backtest. |
| **Crashed while backtesting** | The script failed while running. |
| **Rejected: lookahead or repainting** | The script used information a live strategy couldn't have. |
| **Repeat of an earlier attempt** | Same code or same trades as an earlier attempt, so it was skipped. |
## When it ends [#when-it-ends]
When the loop ends, a notice appears in the app and the card shows the result. A loop that ends on its own also sends you an email with the best strategy and a link back to it. A loop you stop sends no email.
| Status | Why it ended | What you can do |
| ----------------------------- | ----------------------------------------------------------------------- | ---------------------------------------------------------------------------------------------------- |
| **Done** | It found as many strategies as you asked for. | Add them to the chart or open the report. |
| **Time limit reached** | It used its whole time limit. | **Keep searching** to give it another run of the same length; it picks up after its last attempt. |
| **Stopped: no more progress** | Its strategies stopped improving, so it ended early to save your usage. | Change the plan (ease a criterion, test a longer range or another timeframe) or keep searching. |
| **Stopped** | You stopped it. | **Keep searching** to pick it up again. |
| **Failed** | It stopped on an error. | Run it again with **Keep searching**: attempts so far are saved, and it picks up after the last one. |
| **Paused** | Your usage ran out mid-run. | **Top up**, then **Resume**: nothing is lost. |
When strategies were found, the card shows them one at a time (**1 of 2**, with arrows) with their numbers and criteria, and **Add to chart** for each. When none met every criterion, it shows the **Closest** attempts instead, and **What you can do next**:
* **Lower the bar**: a one-click suggestion to ease the criterion that held most attempts back, which asks Quant for a new plan.
* **Keep searching** for another run of the plan's time limit.
* **Ask Quant what to change**: Quant reads the attempts and explains what held them back.
### Add a strategy to the chart [#add-a-strategy-to-the-chart]
**Add to chart** switches the chart to the market and timeframe the strategy was tested on, then runs it, so the backtest you see matches the numbers the loop reported. The strategies the loop returns are saved as scripts in the chat, ready to open in the [Pine editor](/platform/charts/pine-editor), read, and change. From there it's an ordinary strategy: read it in the [Backtest Viewer](/platform/charts/strategies), test it on other markets, or set up a [Custom Alert](/platform/ai-strategy-alerts/introduction) from it.
## The Loop report [#the-loop-report]
The Loop report is the full record of a loop, in a [workspace tab](/platform/workspaces/tabs) of its own. Open it with **Loop report** on the loop's card, **Open report** on the notice when it ends, or from the workspace tabs' **+** under **Backtest loops**.
| Tab | What it shows |
| -------------- | ----------------------------------------------------------------------------------------------------------------------------------------------------------------------------------------------------------------------------------------------------------------------------------------------------------------------------------------------------------------------------------------------------------------------------------------------- |
| **Result** | The best strategy, with its full description, equity curve, numbers and criteria. Step through every passing strategy with the arrows, and switch markets for a multi-market loop. The score of every attempt sits below it. |
| **Details** | How the search went: the best score, strategies found, attempts and how many reached a backtest, the share that passed every check, time used and usage; the score of every attempt; each strategy family with its best score and attempts; a **Scatter plot** of any two numbers across attempts; and **Distributions** of how attempts spread on a number, with how each family's attempts ended and how profit factor held up out of sample. |
| **Strategies** | Every attempt in a table with its equity curve, score, net profit, profit factor, win rate, max drawdown, closed trades and whether it held up out of sample. Sort by any column and switch between in-sample and out-of-sample numbers. |
| **Simulation** | For [prop firm challenge](#prop-firm-challenges) loops: the best strategy's trades replayed many times in a different order, as in [Simulation](/platform/charts/strategies/simulation). |
| **Plan** | The plan the loop ran, as it was when you pressed **Execute**. |
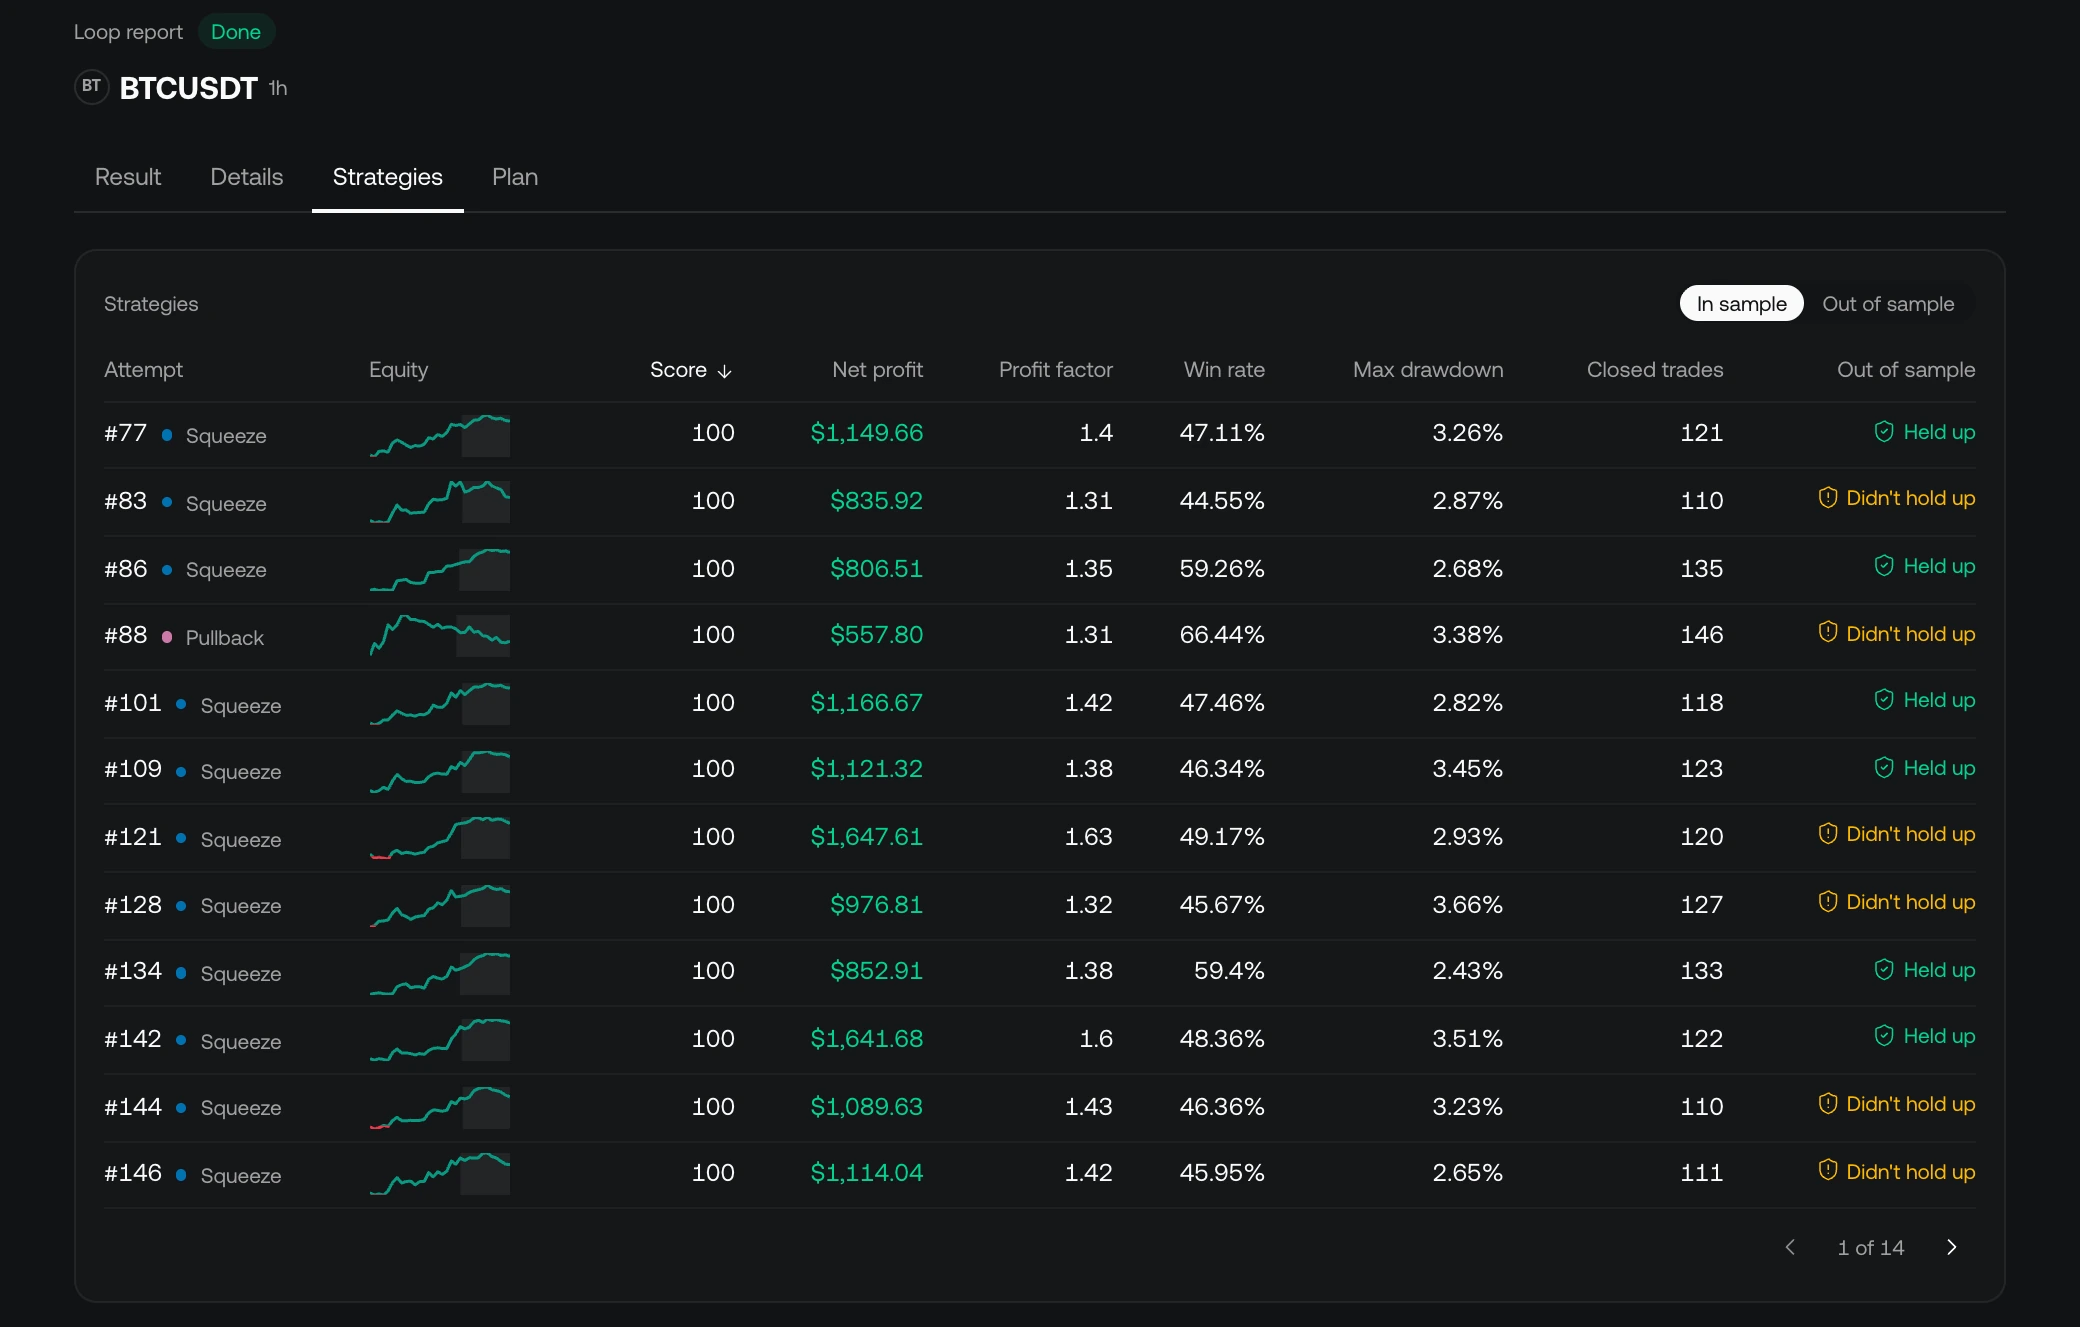
Open any strategy, from **Details** on the Result tab or a row of the Strategies table, to see its page: what it trades and how often, which attempt it was built on, its equity curve and criteria, and **Add to chart**.
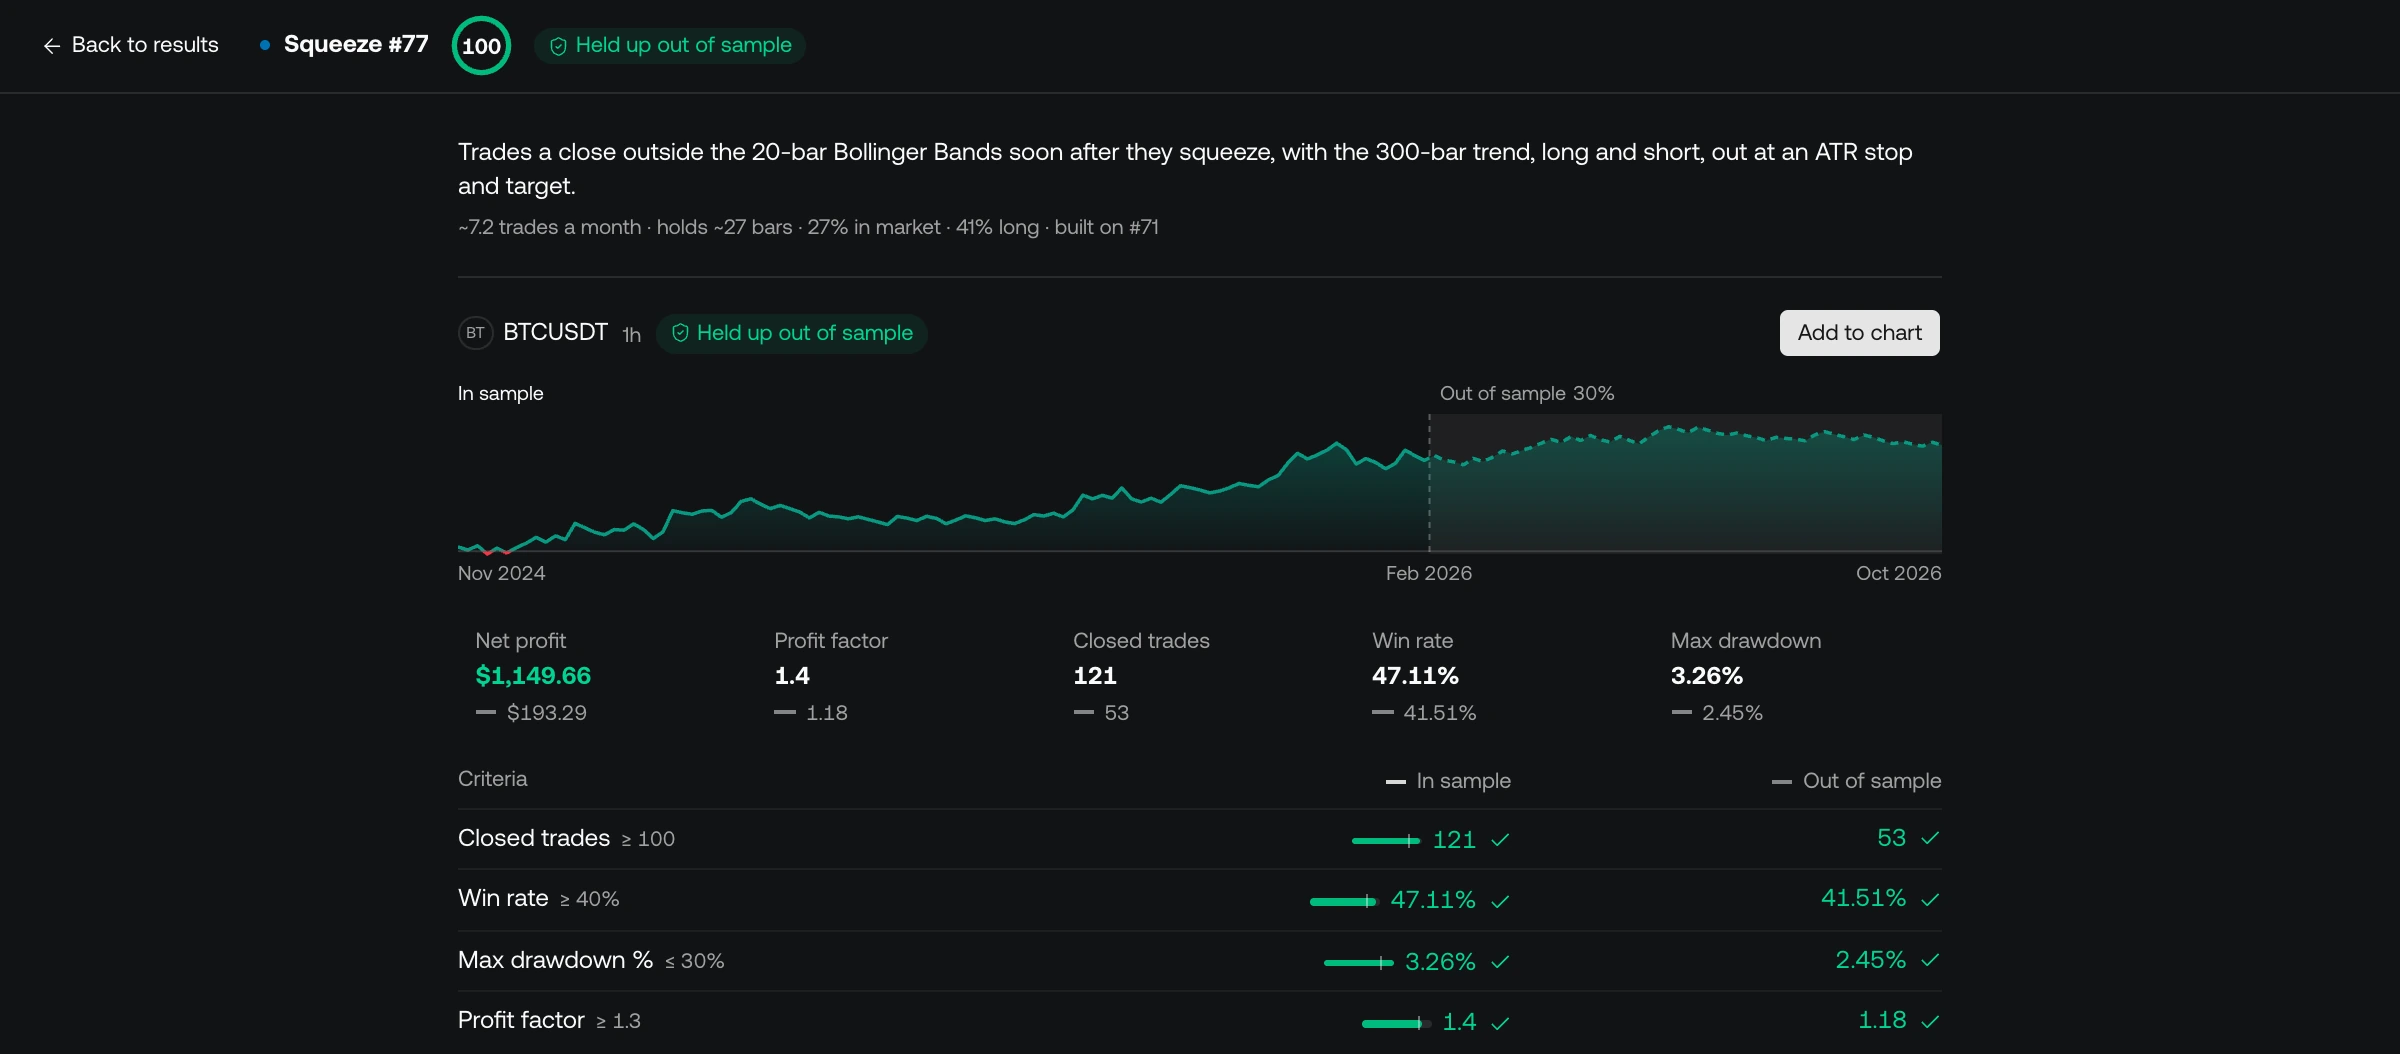
Read the out-of-sample column with care. Many attempts that meet every goal in sample and then fall apart out of sample mean the goals reward fitting the past more than the market. A loop is most useful when its found strategies hold up there too.
### Follow a loop from the tabs [#follow-a-loop-from-the-tabs]
A loop's report tab shows its progress while the loop runs: a ring around its icon fills as the time limit is used (green while it runs, amber while it's paused, a check once it has found every strategy), the tab is named after its markets, such as **BTCUSDT loop** or **EURUSD + GBPUSD loop**, and the found count sits beside it (**1/2**). The **Backtest loops** page in the workspace tabs' **+** lists the loops that are running or paused and your most recent finished ones, so you can open any of them in a tab.
## Several markets and timeframes [#several-markets-and-timeframes]
A loop can test one strategy on up to 5 markets at once. Each market in the plan is a symbol with its own timeframe, tested range, costs, trading hours and criteria, so the markets don't have to look alike: BTCUSDT on 4h, SPY on 1h and GC1! on 1h can share a plan.
However many markets you add, the rule stays the same: **one strategy must pass every market**, in sample and out of sample, with the same code. The loop doesn't look for a separate strategy for each market. That makes a multi-market loop one of the strongest checks against a strategy tuned to a single symbol, and a harder search.
To set one up:
* **Name every market and its timeframe in your request**: "on ES1! and NQ1!, 15m", or "BTCUSDT 1h and ETHUSDT 4h". When you leave one open, Quant asks, or uses the chart in front of you.
* **Review each market's tab on the plan card.** Every market has its own range, split, directions, costs and **To pass** list. A threshold that suits one may not suit another: a trade count that fits a year of 15m bars won't fit a year of daily bars.
* **Ask Quant to add or drop a market.** It sends a new plan card with the change.
### Timeframes [#timeframes]
* **Each market carries its own timeframe**, in minutes, hours or days, such as 15m, 1h, 4h or 1D.
* **A faster timeframe reaches back less far.** Your plan's history is counted in bars, so the same number of bars covers less calendar time on 15m than on 1h. When the range you asked for doesn't fit, the card says how many bars your plan holds and the date that market's test starts from.
* **List each symbol once.** To see how a strategy does on another timeframe of the same symbol, run a separate loop for it, or add a found strategy to the chart and change the chart's timeframe.
* **A strategy can read a higher timeframe of the market it trades**, such as a 4h trend filter on a 1h market, as long as that timeframe is a multiple of the market's own. It can't read another symbol's prices. Ask for it in your request or in the plan's **Instructions**.
### Read a multi-market loop [#read-a-multi-market-loop]
* **The score averages the markets.** An attempt that meets every criterion on one market and misses on another scores in between. It reaches 100 only when it meets them all on every market.
* **Each market has its own results.** Switch markets in the [Loop report](#the-loop-report) to see each one's equity curve, numbers and criteria.
* **Expect it to take longer.** Every market that must pass makes a match rarer. Give the loop a longer time limit, or ease a threshold a little, especially when the card calls it **An ambitious plan**.
## Reduce overfitting [#reduce-overfitting]
A strategy is overfit when it matches the history it was built on more than the market behind it: the backtest looks strong, and there is little underneath. A search makes that easier, not harder, because among hundreds of versions some will fit any stretch of history by chance. The loop is built to resist this, and the plan gives you more ways to. No check removes the risk.
### What the loop does on its own [#what-the-loop-does-on-its-own]
* **It holds data out.** Strategies are built and scored on the in-sample part only. The out-of-sample part reaches Quant as held up or didn't, never as numbers, so there is nothing there to tune to. A strategy that passes in sample and fails out of sample doesn't count as found, and Quant is told to make its next version simpler instead of tuning that one further.
* **Code judges, not Quant.** Every criterion is computed from the backtest. Quant never grades its own work.
* **It rejects results that only exist in a backtest.** Scripts that look into the future or repaint never reach a score.
* **Every attempt is tested on the same terms.** The plan's capital, order size, commission and slippage are written into each script, and orders fill on the next bar's open. A strategy can't improve its numbers by choosing easier settings.
* **Repeats count once.** An attempt with the same code or the same trades as an earlier one is skipped. When you ask for several strategies, the ones returned trade differently from each other.
### What you can do in the plan [#what-you-can-do-in-the-plan]
* **Give both parts enough bars and trades.** A handful of trades can meet any goal by luck. Set a minimum for **Closed trades**, and use a range long enough for the out-of-sample part to trade a meaningful number of times too. The card shows how many bars each part holds, and it won't start a plan whose in-sample or out-of-sample part is too short to test on.
* **Keep the out-of-sample thresholds close to the in-sample ones.** Quant sets them a little looser and scales counts to the shorter window. Loosening them until something passes turns the check into a formality.
* **Test more than one market.** One strategy then has to pass them all. See [Several markets and timeframes](#several-markets-and-timeframes).
* **Keep costs realistic.** Set commission and slippage close to what you'd pay. A strategy that only works without them won't work live.
* **Don't over-specify.** Many tight thresholds at once reward a strategy that threads this exact stretch of history.
* **Add a criterion for how the profit was made**, not only for how much:
| To check that | Add |
| ------------------------------------------------- | ---------------------------------------------------------------------------- |
| Profit doesn't come from a few lucky trades | **Net profit without the best trades %**, **Best trade share of profit** |
| Profit is spread over time | **Profitable months**, **Worst month %**, **Best day share of profit** |
| The equity curve rises steadily | **Equity curve R²**, **Longest stretch without a new high**, **Ulcer index** |
| The drawdown isn't an accident of the trade order | **Monte Carlo drawdown %** |
| The edge is large against its own noise and costs | **System quality (SQN)**, **Average trade vs commission** |
Ask Quant for a strategy that is robust, consistent or smooth without naming criteria, and it suggests ones like these. [Criteria you can set](#criteria-you-can-set) says what each measures.
### After a loop [#after-a-loop]
* **Read the out-of-sample results across all attempts, not only the winners.** In the Loop report's **Details** tab, **Distributions** shows how profit factor held up out of sample against in sample. Many attempts in the lower bands means the strategies fit the past more than the market.
* **Go easy on reruns.** Each time you ease the goals after a loop fails out of sample and run it again, the held-out part has had a little more say in choosing the strategy, and tells you a little less. Prefer a change that makes the test stronger, such as a longer range or another market, over one that only makes it easier to pass.
* **Test a found strategy on what it hasn't seen.** Add it to the chart and try it on other markets and timeframes, and open [Simulation](/platform/charts/strategies/simulation) to see how its drawdown changes when the trades arrive in a different order.
## Prop firm challenges [#prop-firm-challenges]
Ask for a strategy that passes a prop firm challenge, and Quant can build the loop around a challenge from our [prop firm directory](/platform/charts/strategies/prop-firms) instead of criteria you set.
### Pick the challenge [#pick-the-challenge]
Name the firm, the account size, or both. You can also say whether you want a futures or a CFD firm, or only firms that allow automated trading. Quant looks the challenge up in the directory and asks which one you mean when several fit. Choose markets the firm lets you trade: futures for a futures firm, forex or CFDs otherwise.
The plan card shows the challenge beside the plan: its account size, the profit target of each step, the daily and max loss limits (static or trailing), minimum trading days, any consistency rule, and what the firm says about automated trading. **Change challenge** opens a search to pick another. The challenge's account size becomes the loop's capital.
A loop can be built for any challenge with an evaluation it can replay. Instant funding, which has no evaluation to pass, and challenges whose loss rules are too ambiguous to enforce aren't offered.
### How a challenge is judged [#how-a-challenge-is-judged]
Every backtest is replayed day by day through every step of the challenge, in order, from the start of the tested range. It is the same replay the Backtest Viewer's [Prop Firms tab](/platform/charts/strategies/prop-firms#how-a-challenge-is-judged) uses:
* **Each step's profit target.** A later step starts on a fresh account once the step before it passes.
* **The daily loss limit and the max loss**, static or trailing. A trade's worst open loss counts against them before the trade closes.
* **Minimum trading days, time limits and consistency rules**, as the firm sets them.
* **Overnight and weekend holding**, where the firm forbids it.
* **Trading days end at 5 PM New York time.**
An attempt passes when it gets through every step without breaking a rule, on every market in the plan. Its score is how far through the challenge it got: 100 for a pass, about 50 for halfway through its steps and targets.
### How it differs from a loop on your own criteria [#how-it-differs-from-a-loop-on-your-own-criteria]
* **The challenge is the test.** The plan has no criteria of its own.
* **Nothing is held out.** The whole tested range is replayed, so pick a range long enough to get through every step. A pass here hasn't been checked on data the loop never saw.
* **Some rules can't be read from a backtest.** News and automated trading rules aren't checked.
To see whether a pass depended on when the challenge began, add the strategy to the chart and open the Backtest Viewer's [Prop Firms](/platform/charts/strategies/prop-firms) tab: **Start dates** starts the same challenge again on later month starts and counts how many of those passed. The Loop report's **Simulation** tab replays the best strategy's trades in a different order.
A replay is not a promise of a pass, and firms change their rules. Read the firm's current rules before you buy a challenge.
### Prop firm rules as your own criteria [#prop-firm-rules-as-your-own-criteria]
When your firm isn't in the directory, or you want its rules beside goals of your own with an out-of-sample check, set the rules as criteria in an ordinary loop. Give the account size as the capital, and ask for:
| Rule | Criterion |
| ----------------------------------------------- | ---------------------------------------------------------------------------- |
| Profit target | **Net profit %**, at least the target |
| Daily loss limit | **Max daily loss %**, at most the limit |
| End-of-day trailing max loss | **Max drawdown end-of-day trailing %**, at most the limit |
| Consistency: the best day's share of the profit | **Best day share of profit**, at most the share |
| A number of profitable days | **Profitable days**, with the smallest daily gain that counts as its setting |
| Risk per trade | **Max loss on one trade %** |
| Lot-size consistency | **Largest size vs average** |
| A cap on trades or profit in a day | **Most trades in a day**, **Best day %** |
| Flat by the day's end, or by the weekend | **Trades held overnight** or **Trades held over a weekend**, at most 0 |
## Example use cases [#example-use-cases]
Each of these is a request to send with **Backtest loop** on. The numbers are goals to set, not results to expect: swap in your own market, history and thresholds.
### Find a strategy from scratch [#find-a-strategy-from-scratch]
> Find a BTCUSDT 1h strategy over the last two years with at least 100 trades, a profit factor of 1.3 or more and max drawdown under 20%.
The plainest loop: one market and three criteria. On the plan, check that the out-of-sample part holds enough bars for its share of the trades.
### Improve a strategy you already have [#improve-a-strategy-you-already-have]
> Improve this strategy until its profit factor is at least 1.5 and max drawdown stays under 15%. Keep it long only.
Send it with your strategy open. The plan card shows **Improves your script**: the loop starts from your code instead of from nothing. Choose **Start from scratch** beside it to keep the goals and drop the script.
### Build on an indicator [#build-on-an-indicator]
> Build a long-only AAPL 1D strategy on the indicator on my chart: at least 30 trades over the last five years, a win rate of 45% or more and no more than 5 losses in a row.
Point to an indicator on your chart, one of your own scripts, or one from the LuxAlgo Library, and the loop writes strategies that build on it.
### One strategy for several markets [#one-strategy-for-several-markets]
> Find one strategy that works on both ES1! and NQ1! on 15m over the last six months: a profit factor of at least 1.2, at least 40 trades and max drawdown under 10% on each.
The same code has to pass both markets, in sample and out of sample. See [Several markets and timeframes](#several-markets-and-timeframes).
### A steady equity curve [#a-steady-equity-curve]
> Find a SPY 1h strategy over the last two years with at least 50 trades, an equity curve R² of 0.8 or more, 60% of months profitable and no stretch longer than 60 days without a new high.
Criteria for how the profit is made, in place of a profit target. See [Reduce overfitting](#reduce-overfitting).
### Day trading rules [#day-trading-rules]
> Find an NQ1! 15m strategy on regular hours that takes at most 3 trades a day and holds nothing overnight, with a profit factor of at least 1.3 and 60 or more trades over the last six months.
Limits on how a strategy trades are criteria too: here **Most trades in a day** and **Trades held overnight**, with the market's trading hours set to **Regular hours**.
### Pass a prop firm challenge [#pass-a-prop-firm-challenge]
> Find a strategy that passes a $50,000 futures challenge on NQ1! 15m. Only firms that allow automated trading.
Quant finds the matching challenges in our directory and asks which one you mean. The challenge then judges every attempt. See [Prop firm challenges](#prop-firm-challenges).
### Prop firm rules with your own goals [#prop-firm-rules-with-your-own-goals]
> Find a EURUSD 1h strategy on a $100,000 account: net profit of at least 8%, max daily loss under 4%, max drawdown under 8%, and no single day making more than 40% of the profit.
An ordinary loop with a firm's rules as criteria, so the out-of-sample check still applies. See [Prop firm rules as your own criteria](#prop-firm-rules-as-your-own-criteria).
## Usage [#usage]
A loop draws on your [Quant usage](/platform/account/plan-usage) as it works, like the messages you send: the longer it runs and the more attempts it makes, the more it uses. A loop has no separate allowance, so its time limit is the way to bound it. The live view shows the share of your usage the loop has used and where it's heading by its time limit.
If your usage runs out mid-run, the loop pauses. **Top up** opens your plan page to add [extra usage](/platform/account/plan-usage#extra-usage); then choose **Resume** on the card and the loop carries on where it stopped. **Stop and keep results** ends a paused loop instead.
## Tips [#tips]
* **Start with a few goals.** Three or four criteria that matter beat ten that all must line up. Add more once a loop finds something.
* **Give it enough history.** Longer ranges hold more trades, which makes both the in-sample and out-of-sample checks more meaningful. The card shows how many bars each part holds.
* **Watch the out-of-sample results.** If many attempts meet your goals in sample but don't hold up, the goals may be too tight for the market, or the range too short. [Reduce overfitting](#reduce-overfitting) covers what to change, from realistic costs to a second market.
* **Let Quant read the results.** After a loop, ask what held the attempts back or what to change for the next run.
## Limits [#limits]
| | |
| ------------------ | ----------------------------------------------------------------------- |
| Plans | Ultimate and Ultra |
| Markets per loop | Up to 5 |
| Strategies to find | 1 to 5 |
| Time limit | 10 minutes to 4 hours (30 minutes unless you ask for another) |
| Out of sample | 0% to 99% of the range; Quant usually holds back the last 20% to 40% |
| History | Up to your plan's [historical bars](/platform/account/plans) per market |