Confluence is an important aspect when dealing with multiple indicators. In this toolkit two features allows the users to easily assess if the confluence between each toolkit element in high or low.
Confluence Zones
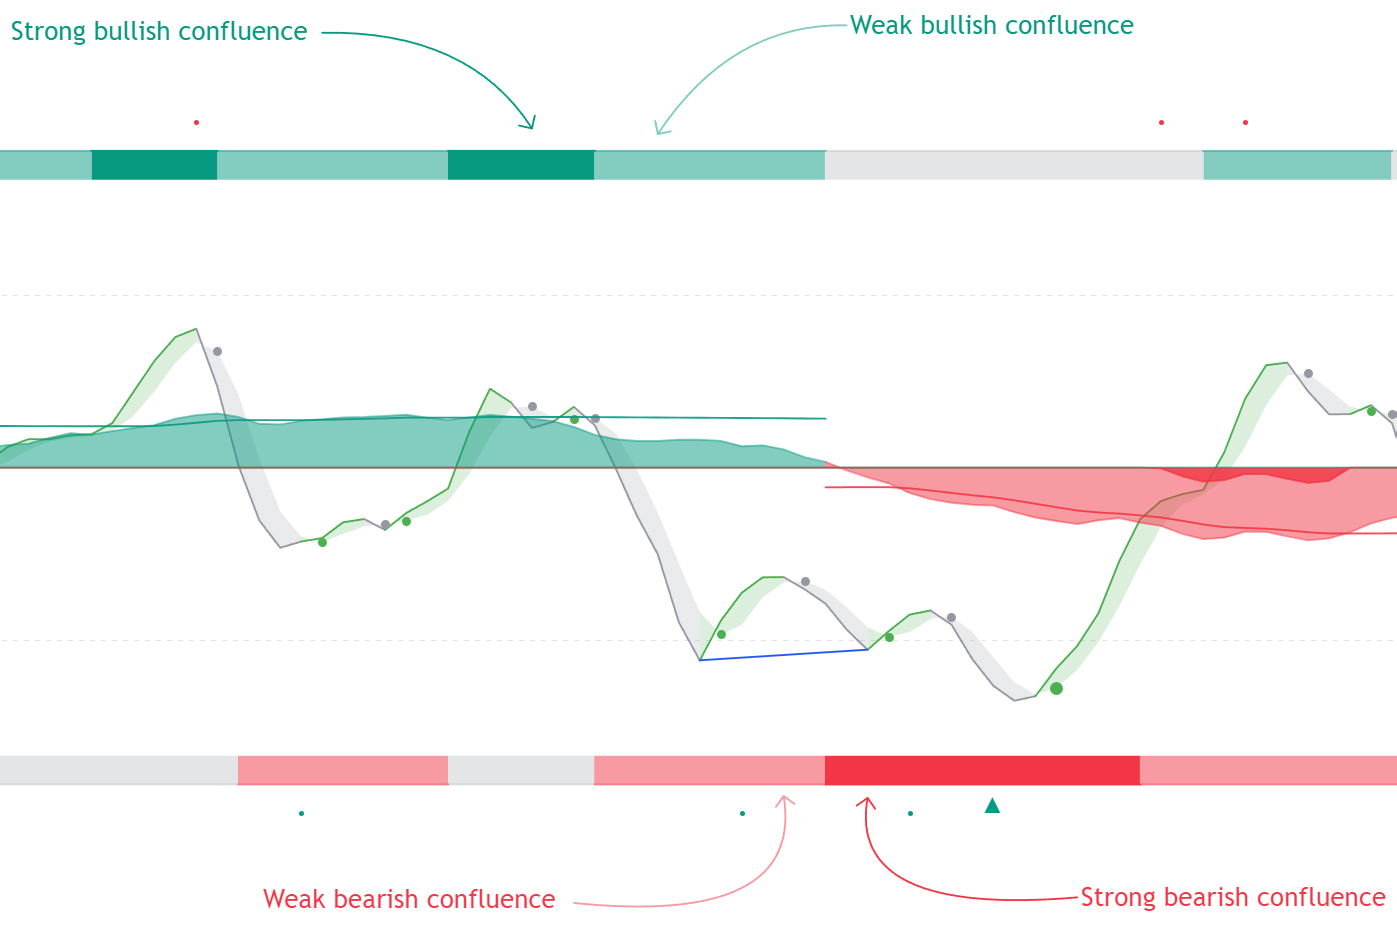 Users can see on the oscillators pane one upper (above 100) and lower (under 0) zone, measuring the bullish/bearish confluence between the Hyper Wave and Money Flow oscillators.
When both the Hyper Wave and Money Flow oscillators are indicating an uptrend the upper zone is colored with a darker green. If only one of the oscillators is indicating an uptrend then the confluence zone will have a brighter green. This logic applies to the lower zone in the case of a downtrend.
Users can see on the oscillators pane one upper (above 100) and lower (under 0) zone, measuring the bullish/bearish confluence between the Hyper Wave and Money Flow oscillators.
When both the Hyper Wave and Money Flow oscillators are indicating an uptrend the upper zone is colored with a darker green. If only one of the oscillators is indicating an uptrend then the confluence zone will have a brighter green. This logic applies to the lower zone in the case of a downtrend.
Confluence zones have an associated numerical that can be used in external scripts using the output “Upper Confluence Value” for the upper confluence zone and “Lower Confluence Value” for the lower confluence zone, returned values include:
- 2: Strong confluence
- 1: Weak confluence
- 0: No confluence
Confluence Meter
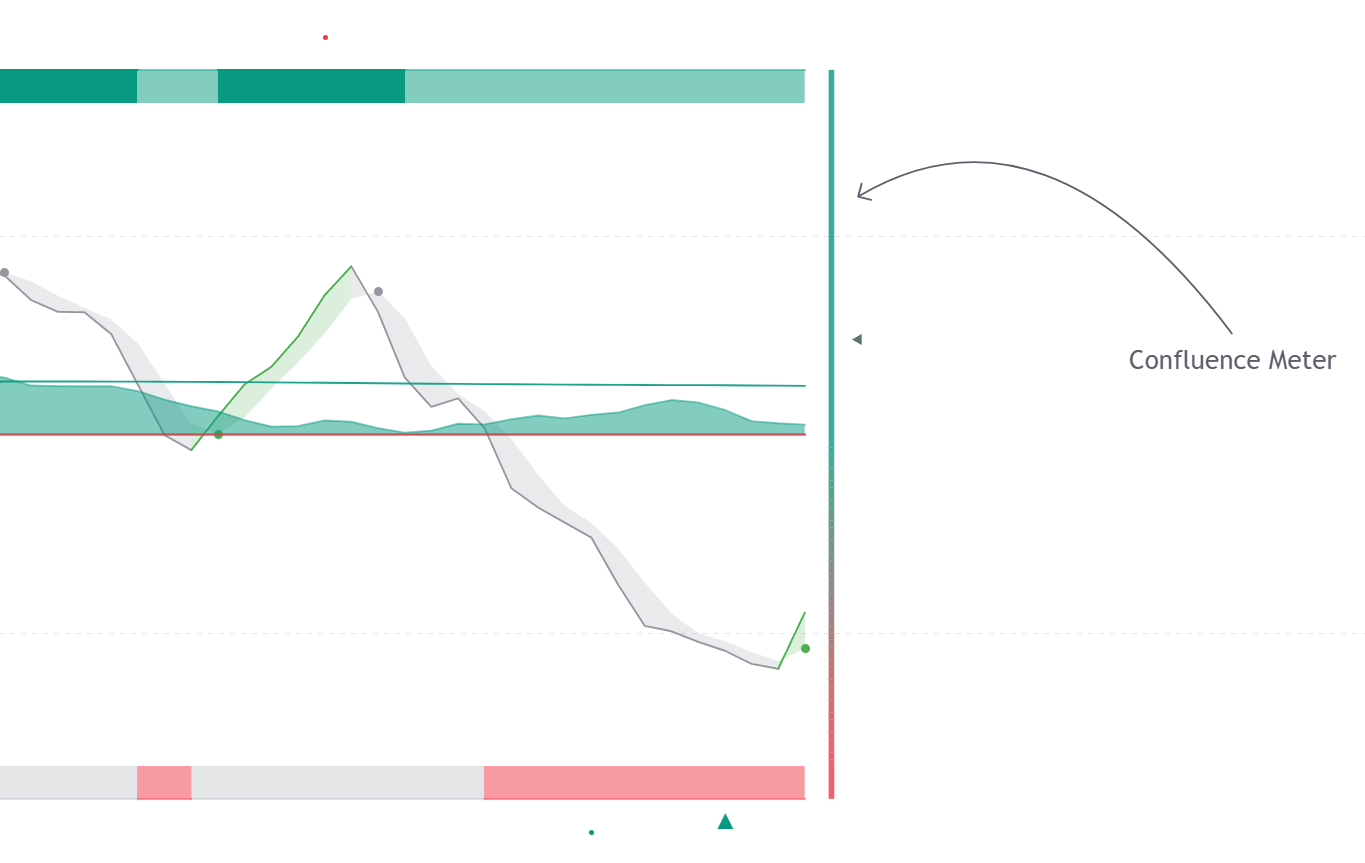 The confluence meter quantifies the amount of confluence between each indication returned by the oscillator, elements taken into account are:
- Trend indicated by the Hyper Wave relative to its signal line
- Trend indicated by the Hyper Wave
- Trend indicated by the Money Flow
- Overflow
- Divergences
The meter giving a higher measurement would be indicative of a more significant bullish confluence, that is most elements are indicative of a bullish trend, while a lower measurement would be indicative of a more significant bearish confluence.
The confluence meter had an associated numerical that can be used in external scripts using the output “Confluence Meter Value”
