The HyperWave is a normalized adaptive oscillator aiming to precisely reflect price trends without returning a high amount of noise.
It is the primary oscillator used to detect trends/reversals within the LuxAlgo Oscillator Matrix®.
This oscillator is directly controlled by the Main Length setting, with higher values returning a smoother result reflecting longer term trends.
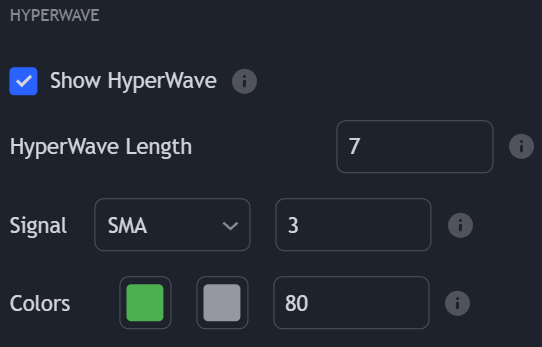
The HyperWave and every associated components (Signal line, turning points, divergences) can be disabled by toggling off “Show HyperWave”
Signal Line
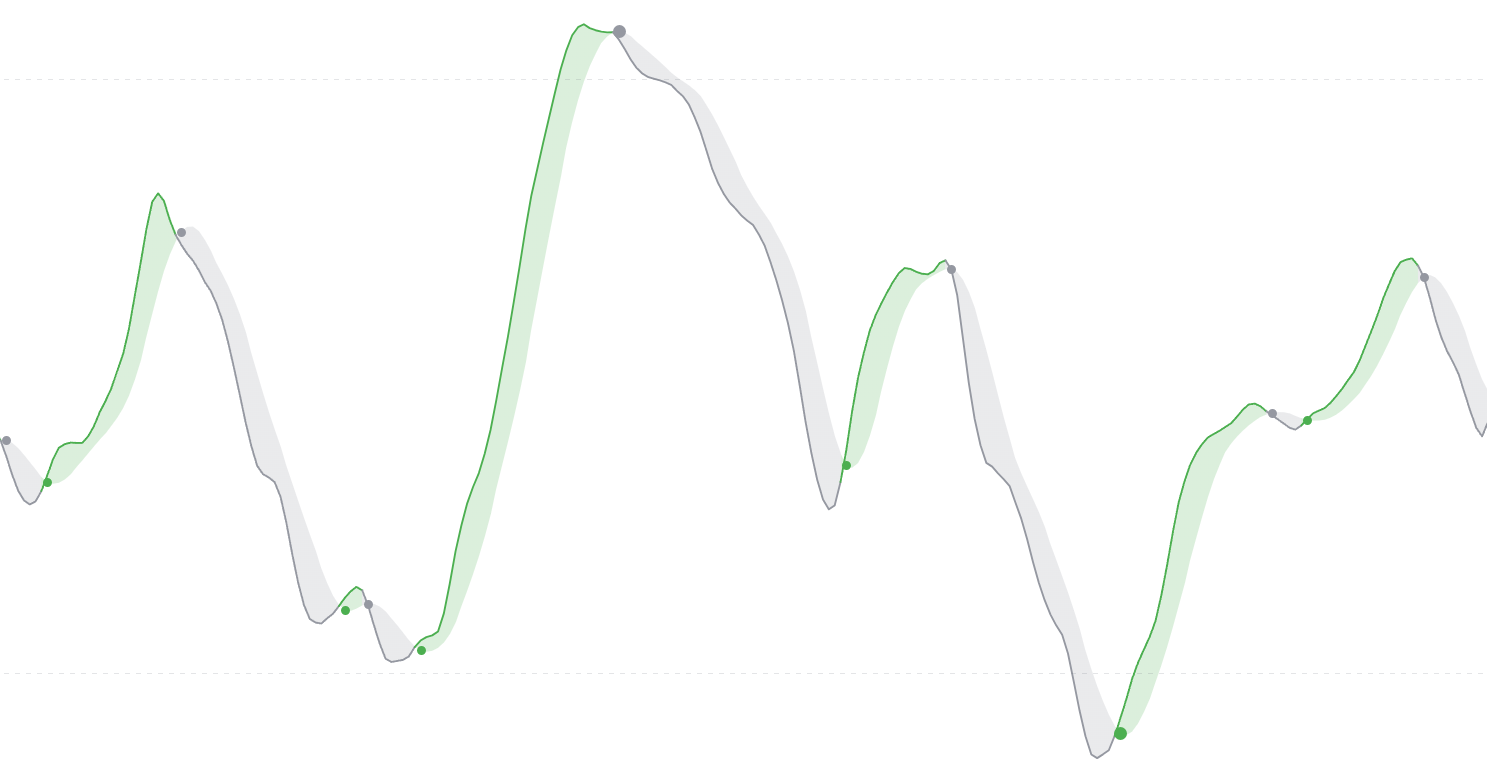
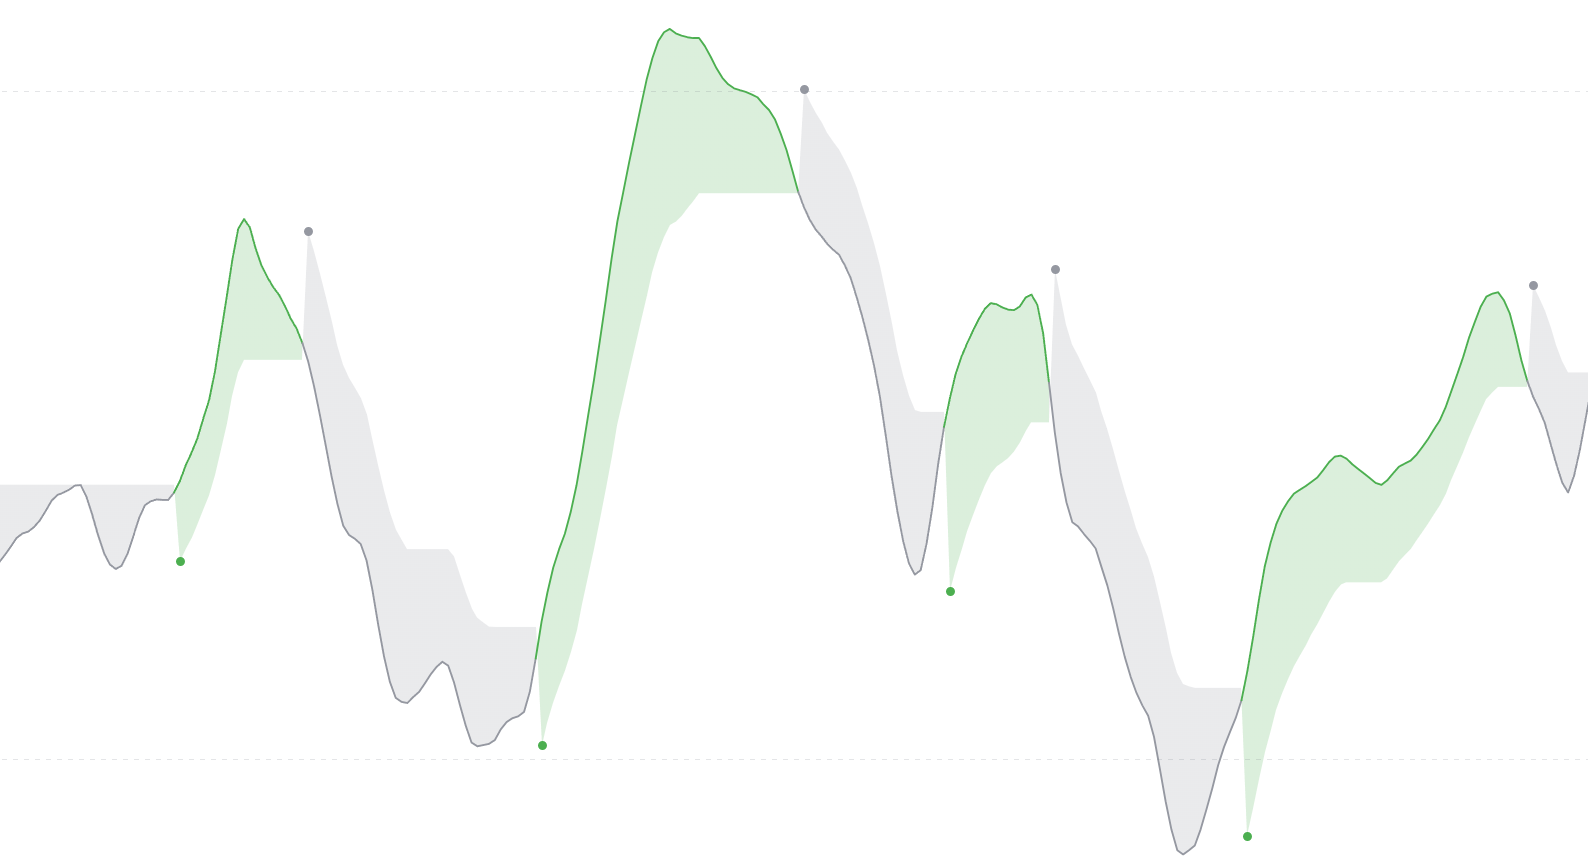
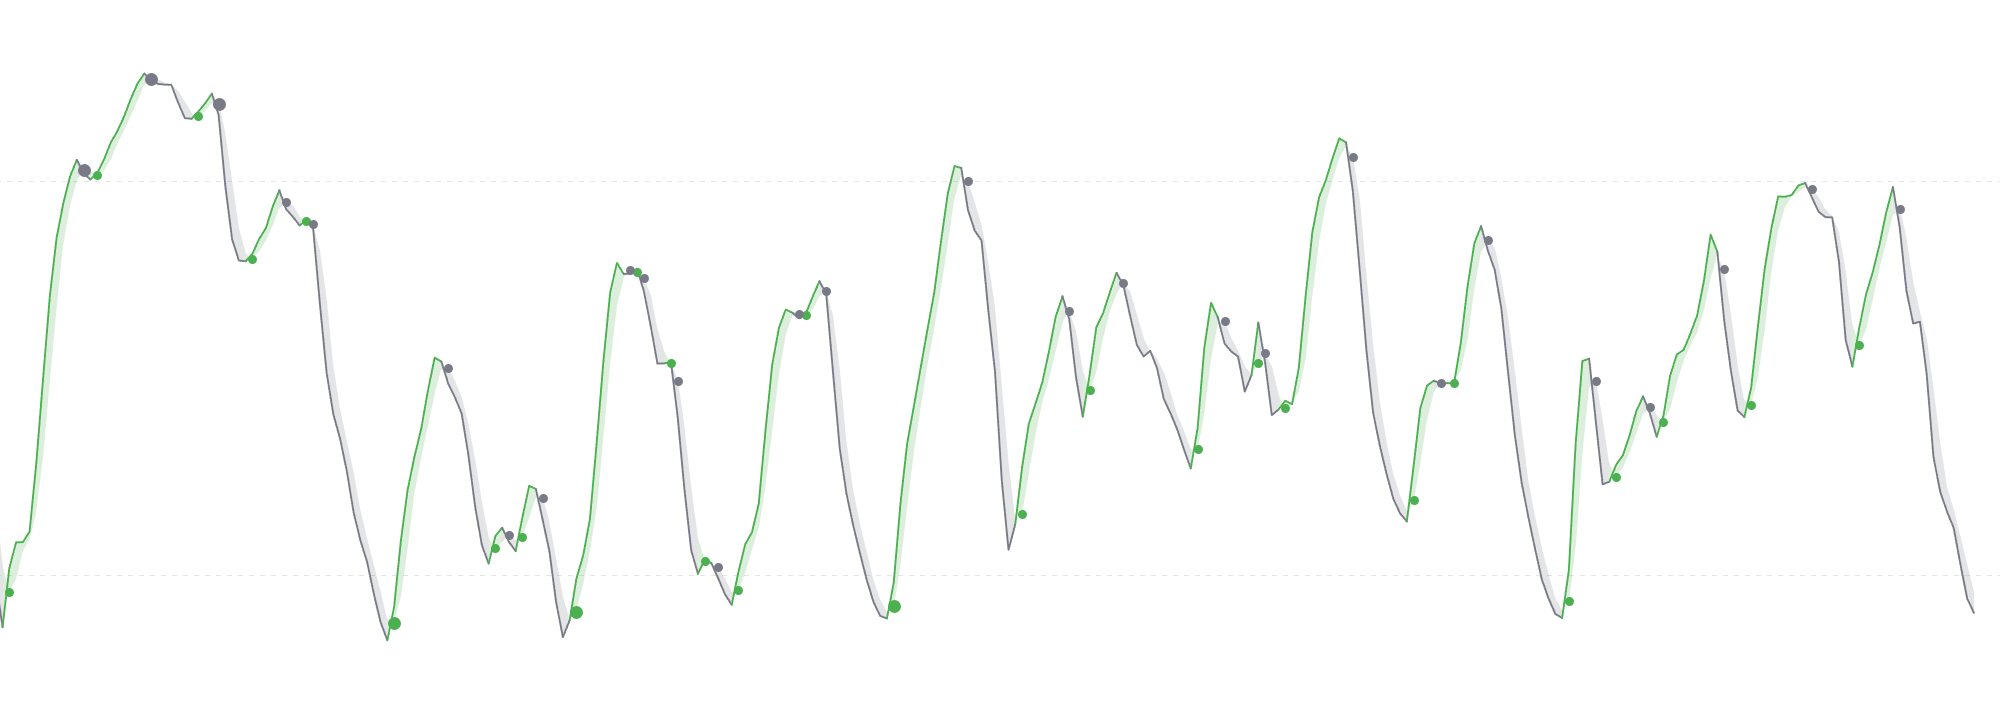 The Hyper Wave includes a signal line allowing to reactively detect trend directions. The area between the Hyper Wave and its signal line is displayed to easily assess the current trend direction, with a color determined by the position of the Hyper Wave relative to its signal line.
Users can use two different algorithms for computing the signal line:
The Hyper Wave includes a signal line allowing to reactively detect trend directions. The area between the Hyper Wave and its signal line is displayed to easily assess the current trend direction, with a color determined by the position of the Hyper Wave relative to its signal line.
Users can use two different algorithms for computing the signal line:
- SMA : A simple moving average of the Hyper Wave is used as signal line.
- TS : A trailing stop of the Hyper Wave is used as signal line. This algorithm makes the signal line less sensitive to noisy variations of the Hyper Wave.
The users can select the length of the signal line using the numerical input at the right of the Signal drop-down menu.
It can be more interesting to use a higher signal line length when the Main Length setting is high.
Turning Points
 Crosses made between the HyperWave and its signal line are highlighted by dots on the oscillators pane, these are turning points.
By default, a Hyper Wave crossing over the signal line is highlighted in green while a Hyper Wave crossing under the signal line is highlighted in red.
Crosses made between the HyperWave and its signal line are highlighted by dots on the oscillators pane, these are turning points.
By default, a Hyper Wave crossing over the signal line is highlighted in green while a Hyper Wave crossing under the signal line is highlighted in red.
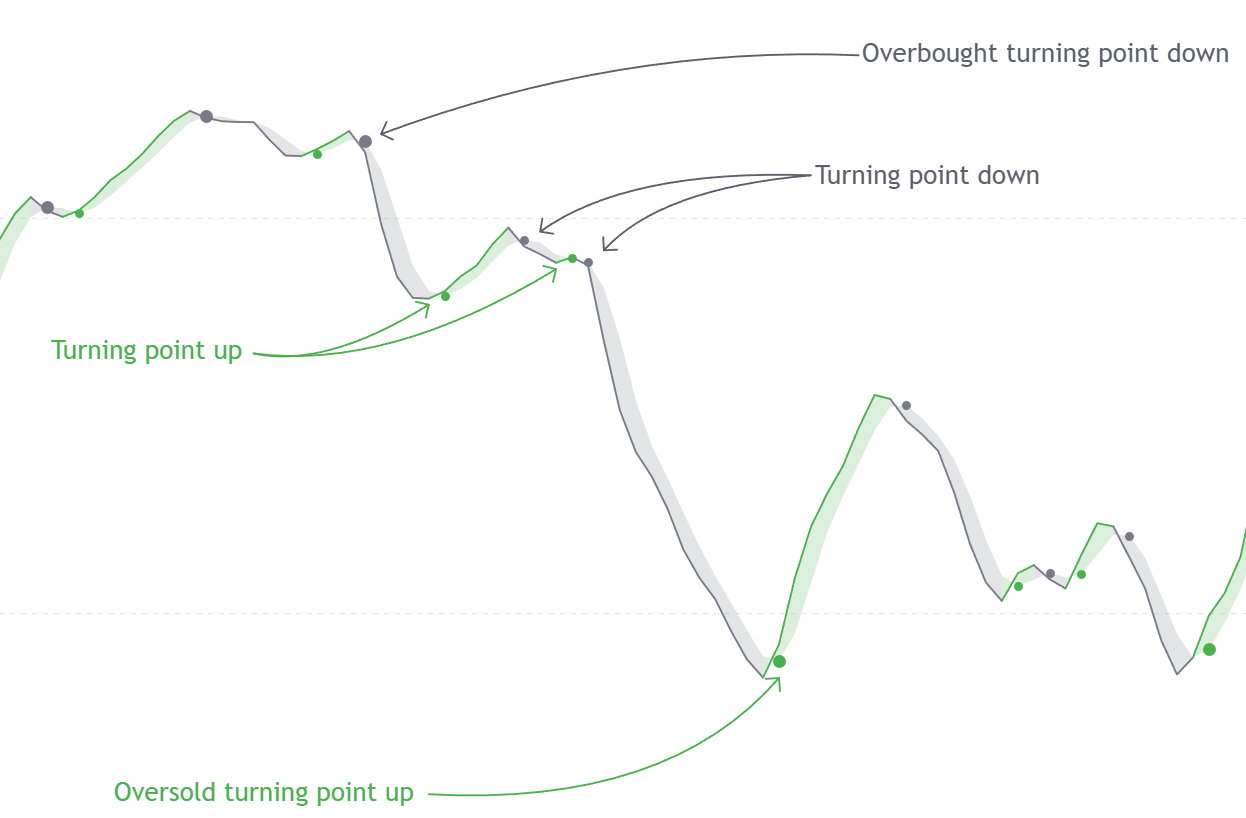
Overbought/Oversold Turning Points
The displayed turning points exist in different sizes, with bigger dots occurring when the crosses are made within an overbought/oversold area.
- Oversold Turning Point : Occurs when the Hyper Wave cross over its signal line while the Hyper Wave is under 20
- Overbought Turning Point : Occurs when the Hyper Wave cross under its signal line while the Hyper Wave is over 80
Real Time Divergences
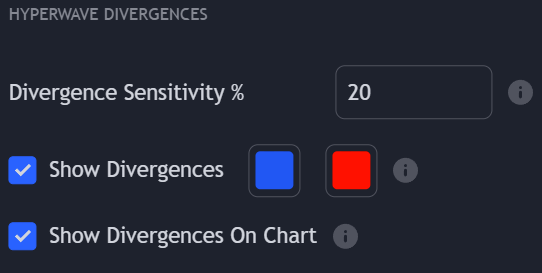
Divergences between the price and the HyperWave oscillator are detected in real-time. The users can return longer term divergences by decreasing the Divergence Sensitivity %, with lower values of this setting making divergence detection more sensitive to noisy variations of the Hyper Wave.
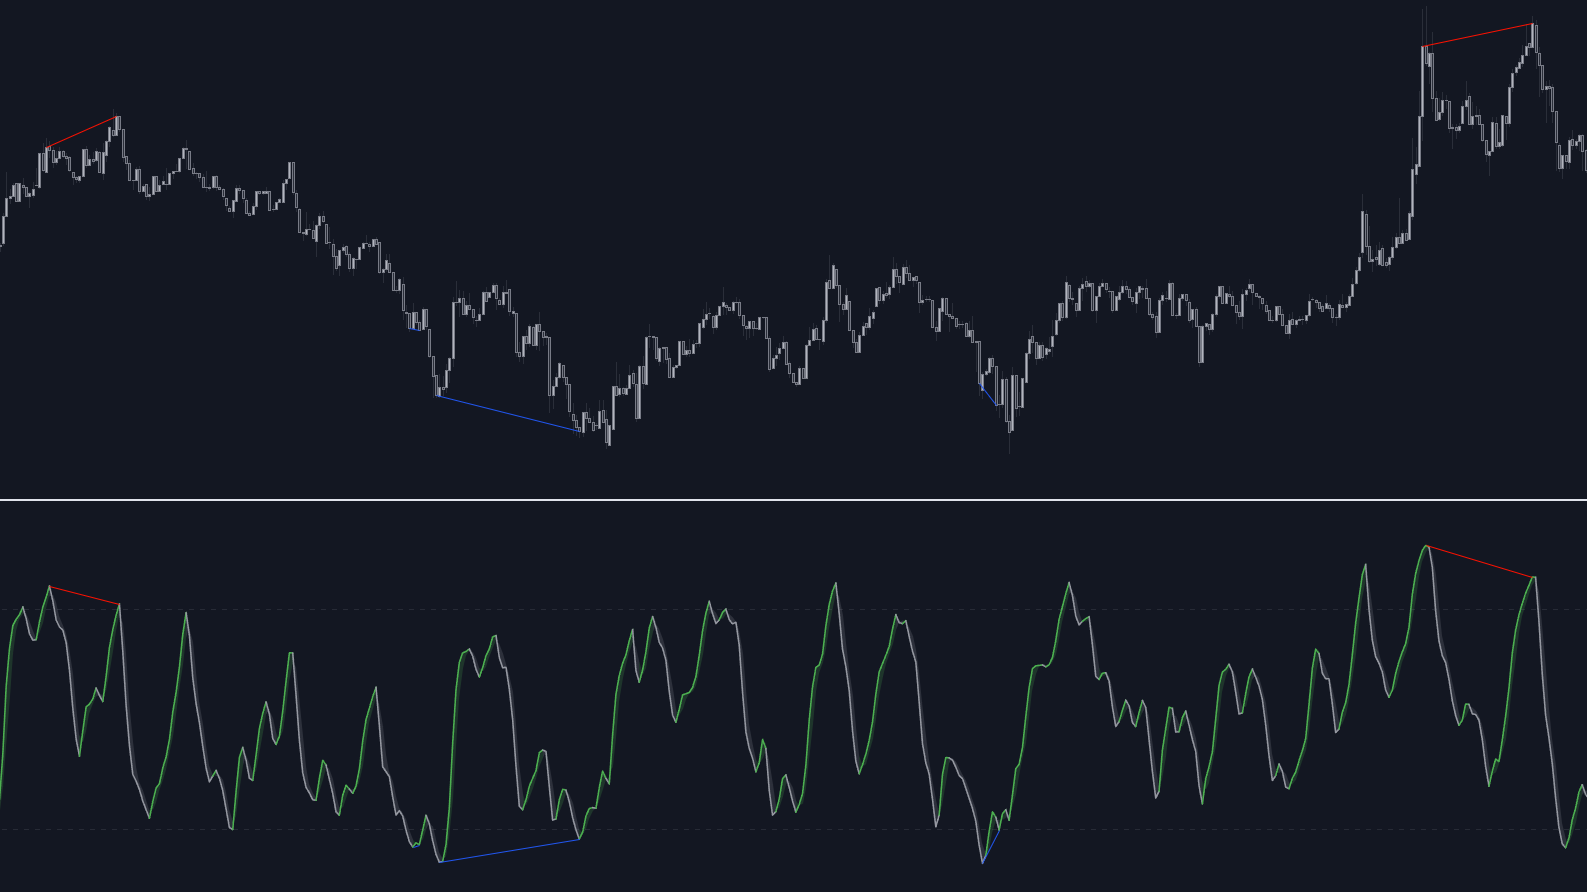 Divergences are highlighted by a blue line for bullish divergences and by a red line for bearish divergences.
Divergences On Price Chart
In order to reference the price points returning the divergence with the HyperWave, divergences lines are directly displayed on the user price chart thanks to “Show Divergences On Chart”.
It is important to note that, unlike the divergence lines that appear in the oscillator pane, the divergence lines on the user chart do not appear exactly where the divergences are detected; rather, they are set retrospectively.
Because the amount of lines is limited to a maximum of 500, disabling “Show Divergences On Chart” can increase the amount of historical divergences highlighted on the oscillator pane.