
Fibonacci Retracements
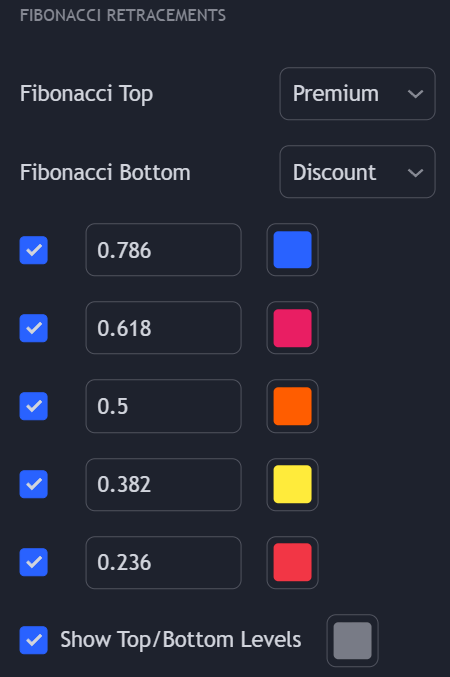
Fibonacci retracements are levels displayed from two price points using Fibonacci ratios, specific numbers obtained from the Fibonacci sequence.
Users can display up to 5 customizable Fibonacci retracements from one upper and one lower extremities users can select from a wide variety of feature included in the toolkit.
Possible Extremities
The upper/lower extremities used to construct the Fibonacci retracements can be selected from the "Fibonacci Top" or "Fibonacci Bottom" dropdown settings, and can be obtained from the following features within the Price Action Concepts® toolkit:
Swing Points
- Internal High
- Internal Low
- Swing High
- Swing Low
Premium/Discount
- Discount
- Equilibrium Average
- Premium
CHoCH/BOS
- Bullish I-CHoCH
- Bearish I-CHoCH
- Bullish I-BOS
- Bearish I-BOS
Orderblock
- Highest OB Top
- Lowest OB Bottom
Imbalance
- Imbalance Top
- Imbalance Bottom
- Imbalance Average
Previous H/L
- Previous Day High
- Previous Day Low
- Previous Week High
- Previous Week Low
- Previous Month High
- Previous Month Low
- Previous Quarterly High
- Previous Quarterly Low
Selecting "None" for "Fibonacci Top" or "Fibonacci Bottom" will hide the retracements.
Ratios
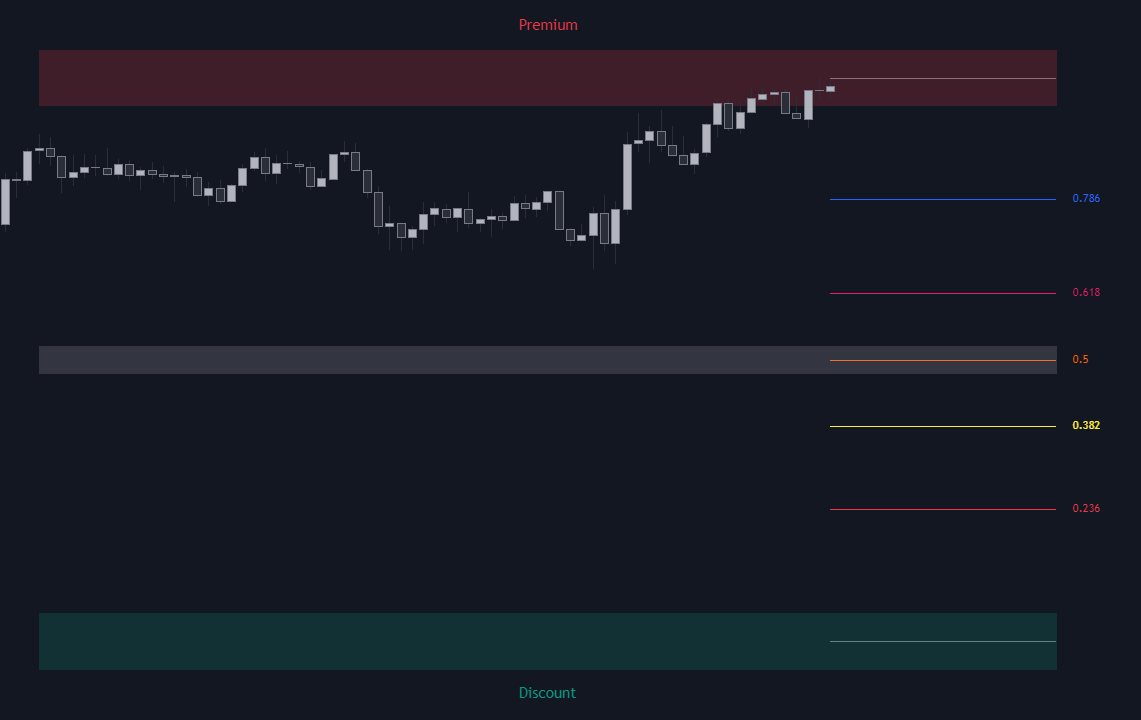
Users can control which levels are displayed as well as the ratio used for each level. Ratios are also visible to the right side of each retracement displayed.
Anchor To Origin
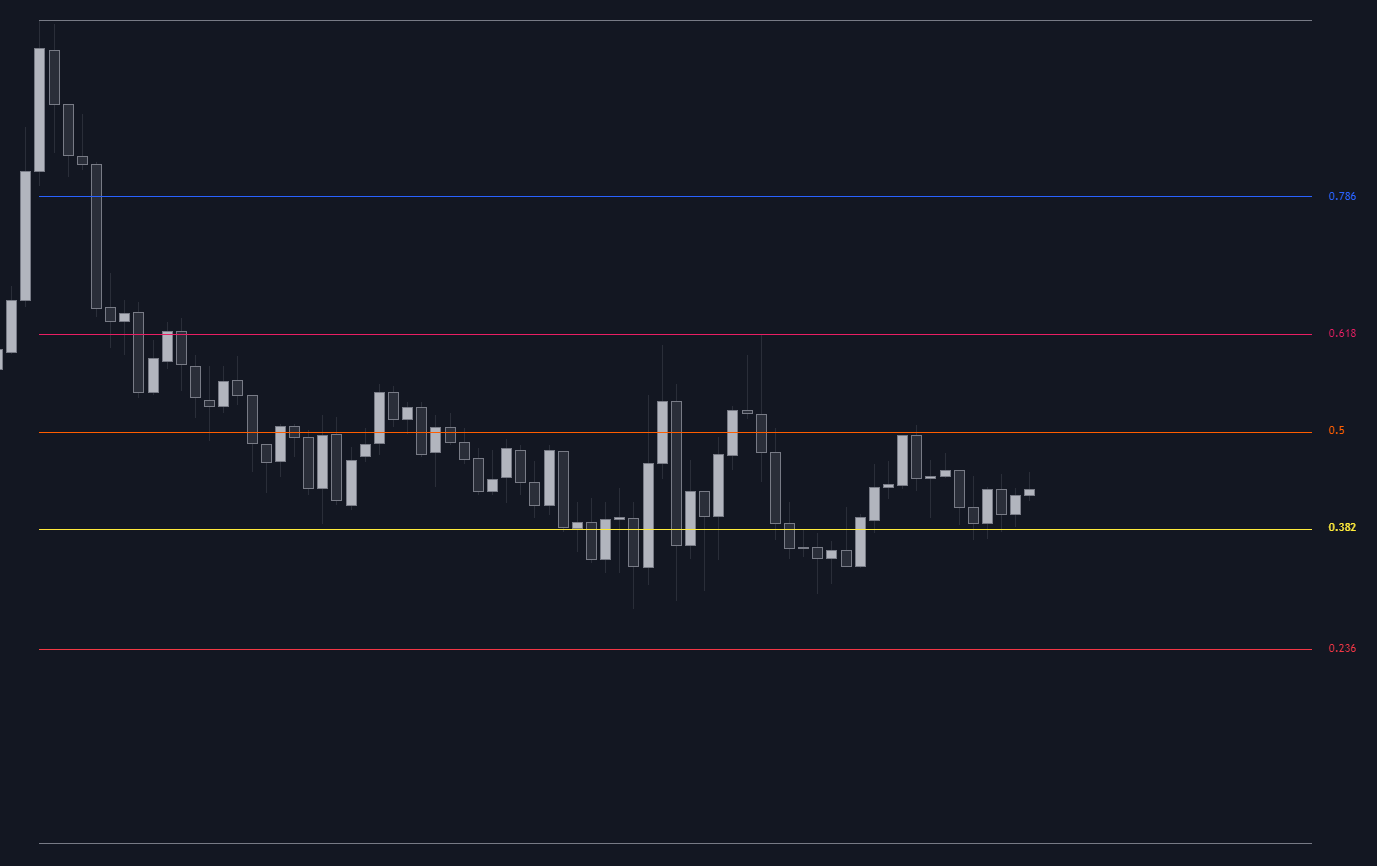
By default, the levels are anchored from the most recent bar and extend 20 bars ahead. By enabling "Anchor To Origin" users can anchor retracement levels to a point of origin related to the selected extremities in "Fibonacci Top" and "Fibonacci Bottom".
Based on the selected extremity, the anchor point will be the following:
| Extremity | Anchor |
|---|---|
| Swing High | Swing High Location |
| Swing Low | Swing Low Location |
| Internal High | Internal High Location |
| Internal Low | Internal Low Location |
| Premium / Equilibrium Average / Discount | Oldest anchor between Swing High and Swing Low Locations |
Only the above extremities are compatible with "Anchor To Origin".
If "Fibonacci Top" and "Fibonacci Bottom" are different, the anchor point will be the oldest location between the two.