 Imbalances in market prices arise when there is a great disparity between supply and demand, this can lead to inefficiencies where an asset does not trade at its fair value.
It is common for the price to seek balance after an imbalance, thus returning to the price area where the imbalance occurred. These areas of imbalances can also be used as support and resistance areas.
The toolkit is able to detect the following imbalances:
Imbalances in market prices arise when there is a great disparity between supply and demand, this can lead to inefficiencies where an asset does not trade at its fair value.
It is common for the price to seek balance after an imbalance, thus returning to the price area where the imbalance occurred. These areas of imbalances can also be used as support and resistance areas.
The toolkit is able to detect the following imbalances:
- Fair Value Gaps (FVG)
- Inverse Fair Value Gaps (Inverse FVG)
- Double Fair Value Gaps (Double FVG)
- Volume Imbalance
- Opening Gap
Each method is covered in the sections below.
Fair Value Gaps
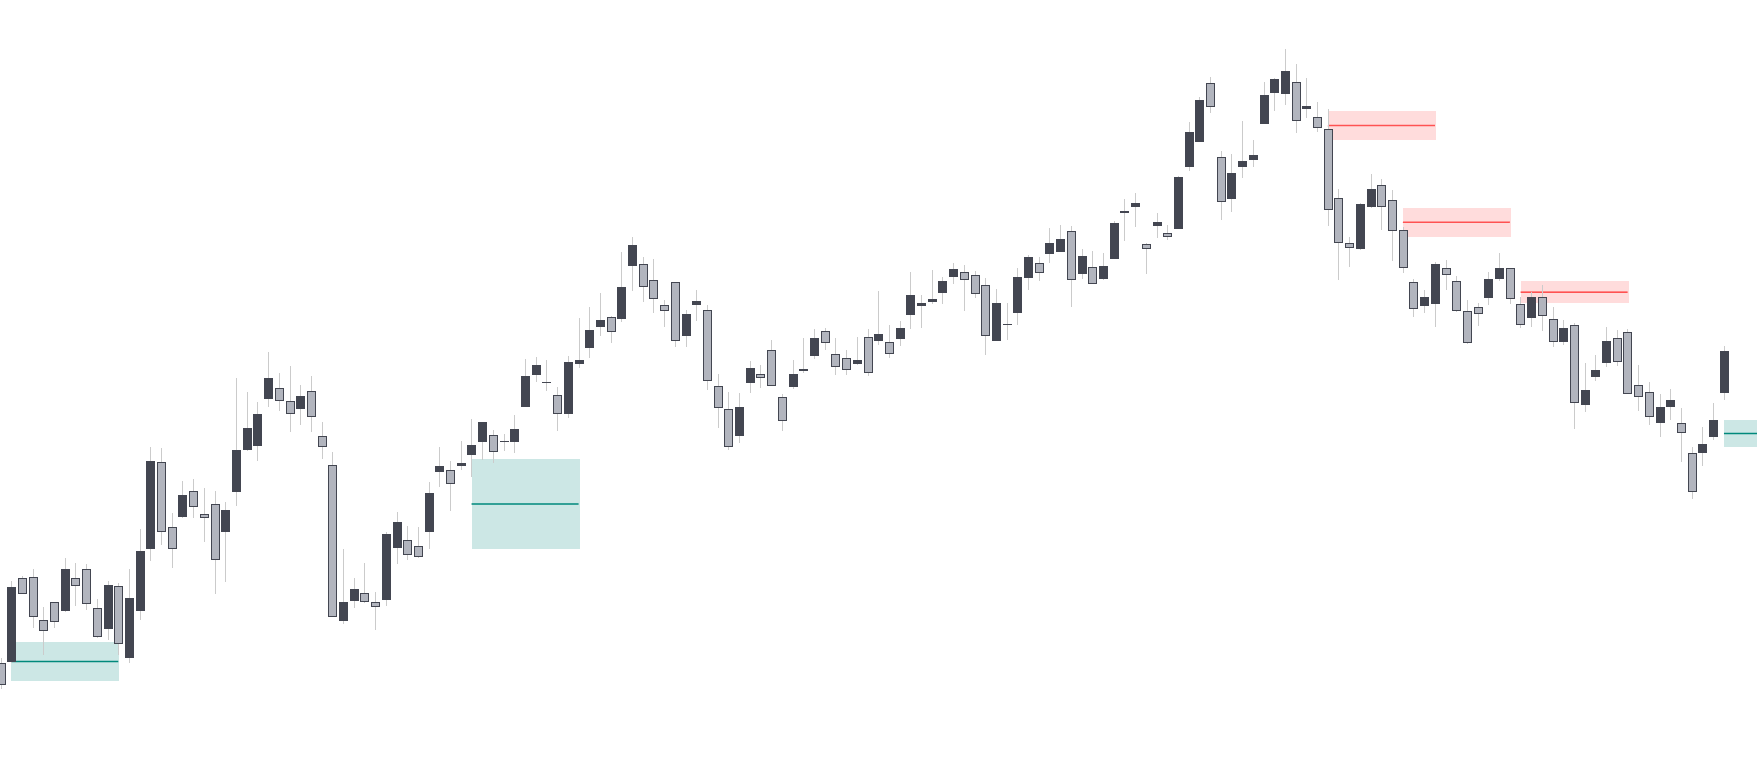
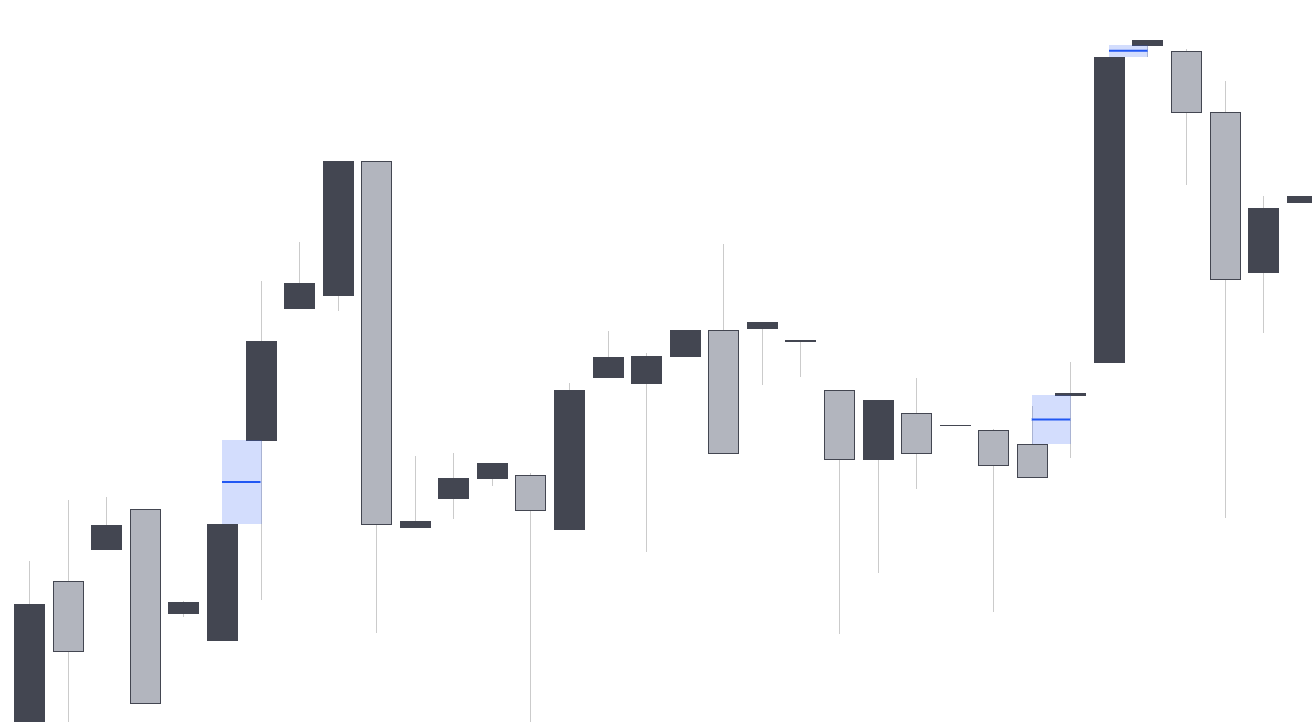
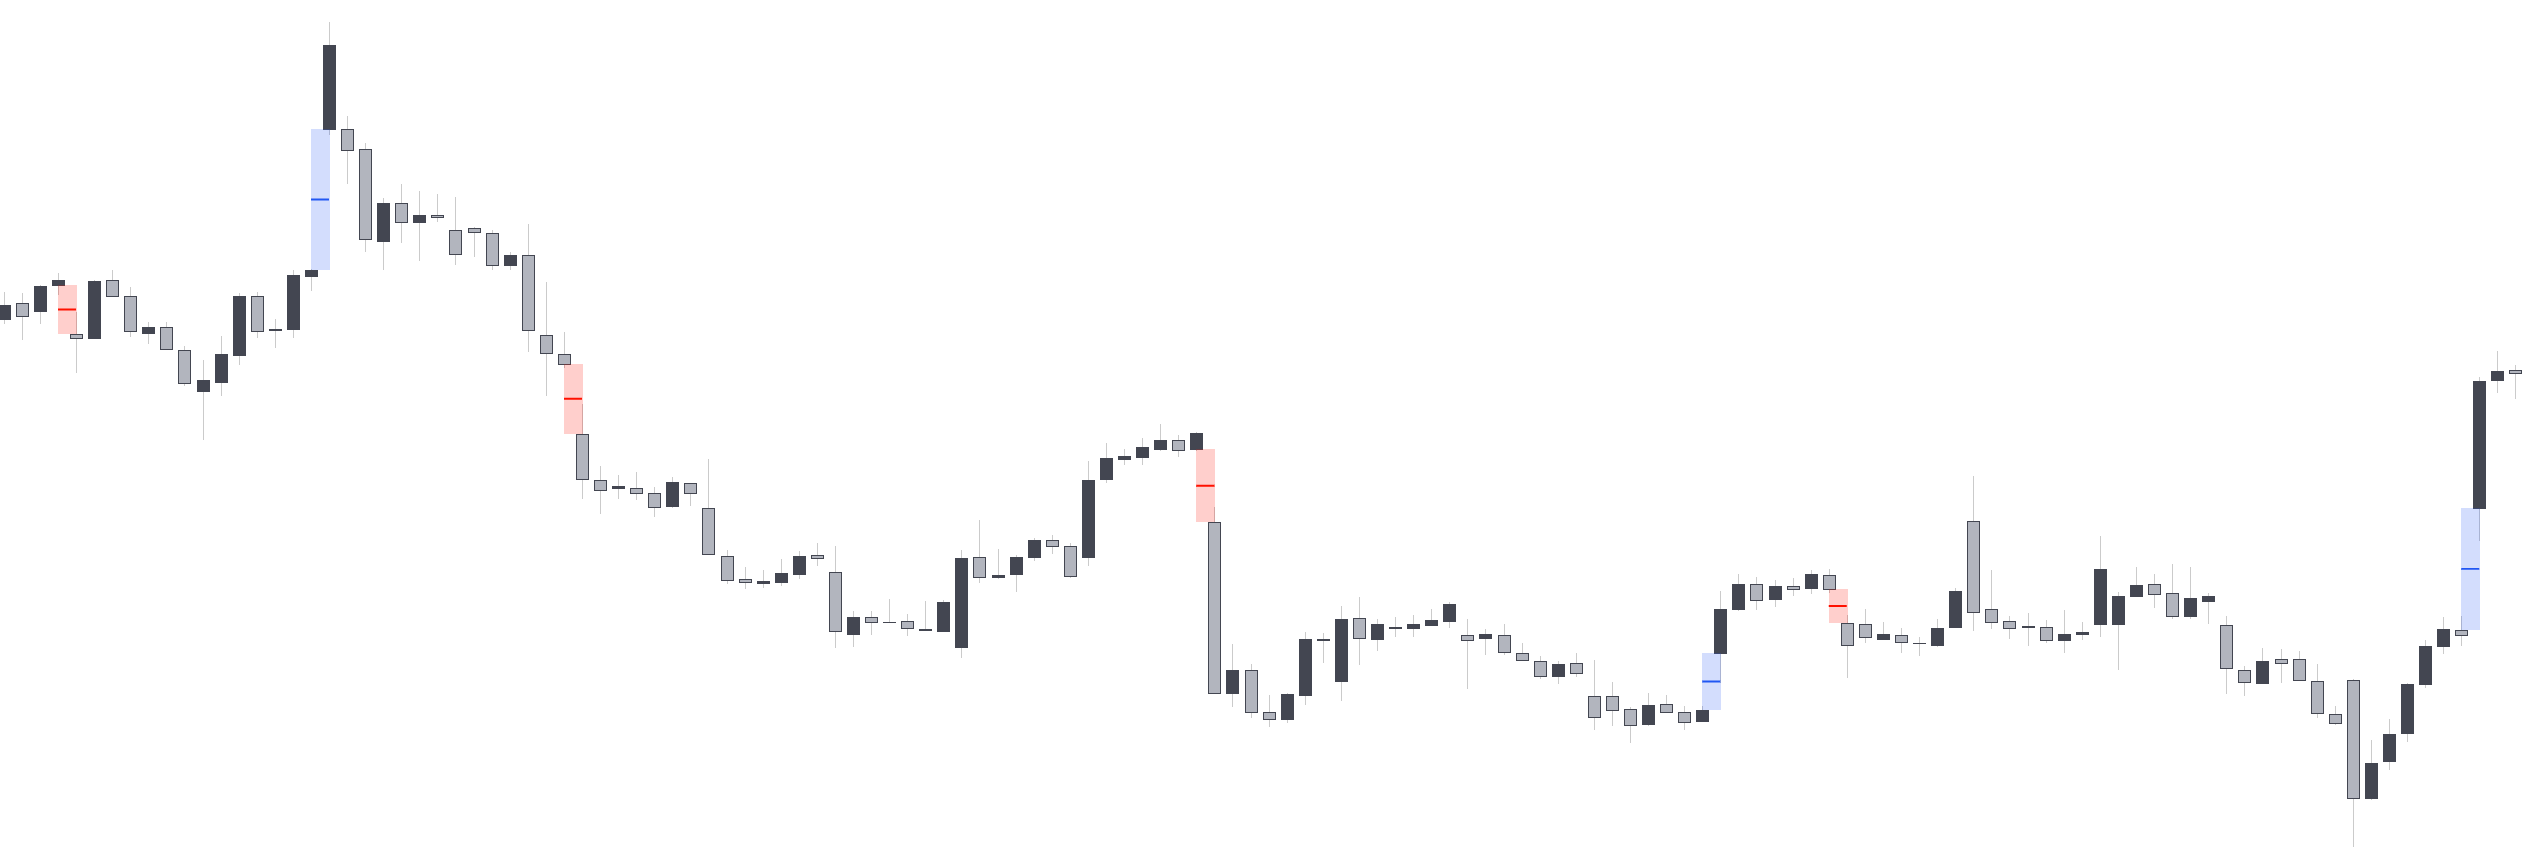
 Fair Value Gaps (FVG) are market imbalances formed from a sequence of three candles where the outer candle wicks fail to overlap the central candle body, the range between the wicks highlight a Fair Value Gap.
Bullish fair value gaps occur when the current price low is higher than the price high two bars ago. Bearish fair gaps occur when the current price high is lower than the price low two bars ago.
Fair Value Gaps (FVG) are market imbalances formed from a sequence of three candles where the outer candle wicks fail to overlap the central candle body, the range between the wicks highlight a Fair Value Gap.
Bullish fair value gaps occur when the current price low is higher than the price high two bars ago. Bearish fair gaps occur when the current price high is lower than the price low two bars ago.
Inverse FVG
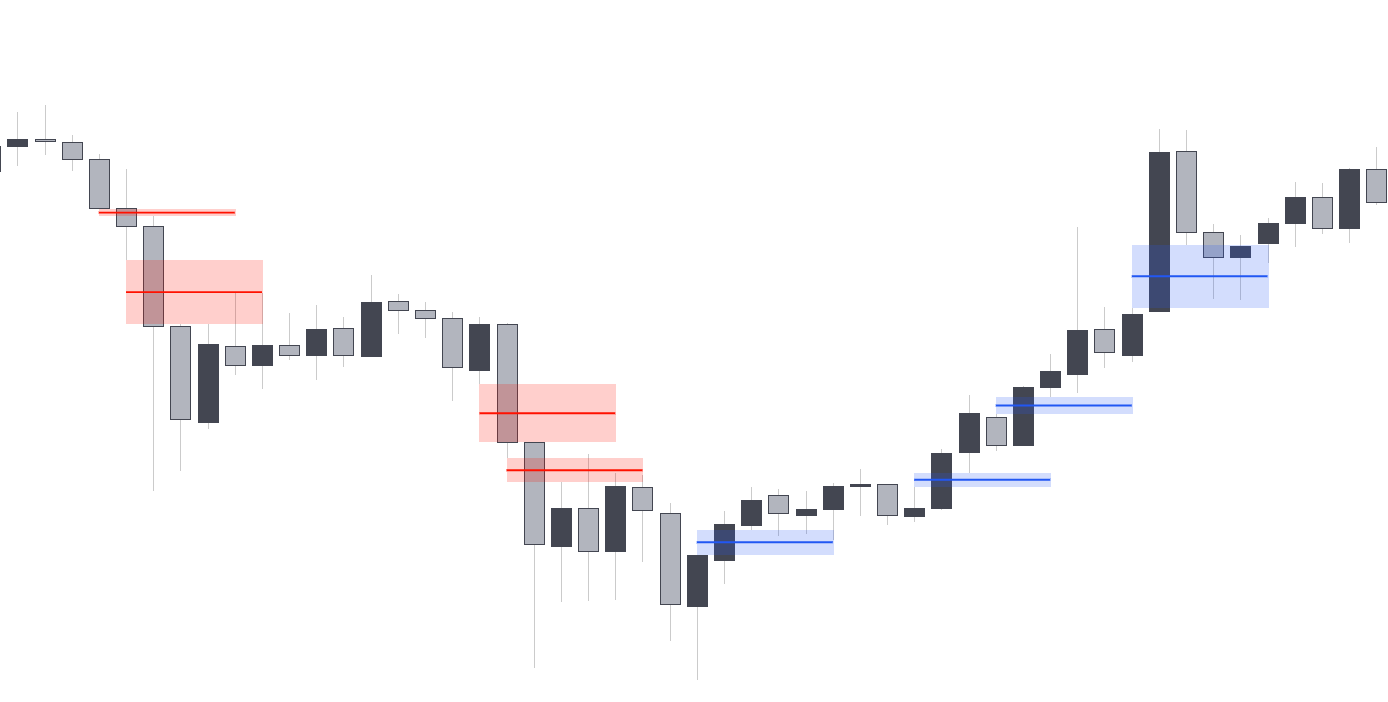
 Inverse fair value gaps are essentially mitigated fair value gaps, these can be used to provide retests areas.
A mitigated bullish FVG will lead to a bearish inverse FVG, where we can expect price to retrace upward and retest the area, while a mitigated bearish FVG will lead to a bullish inverse FVG, where we can expect price to retrace downward and retest the area.
Inverse fair value gaps are essentially mitigated fair value gaps, these can be used to provide retests areas.
A mitigated bullish FVG will lead to a bearish inverse FVG, where we can expect price to retrace upward and retest the area, while a mitigated bearish FVG will lead to a bullish inverse FVG, where we can expect price to retrace downward and retest the area.
For the sake of efficiency, inverse FVG’s are always based on the mitigation of the most recent detected FVG, disregarding any previous historical FVG that might get mitigated.
Double FVG
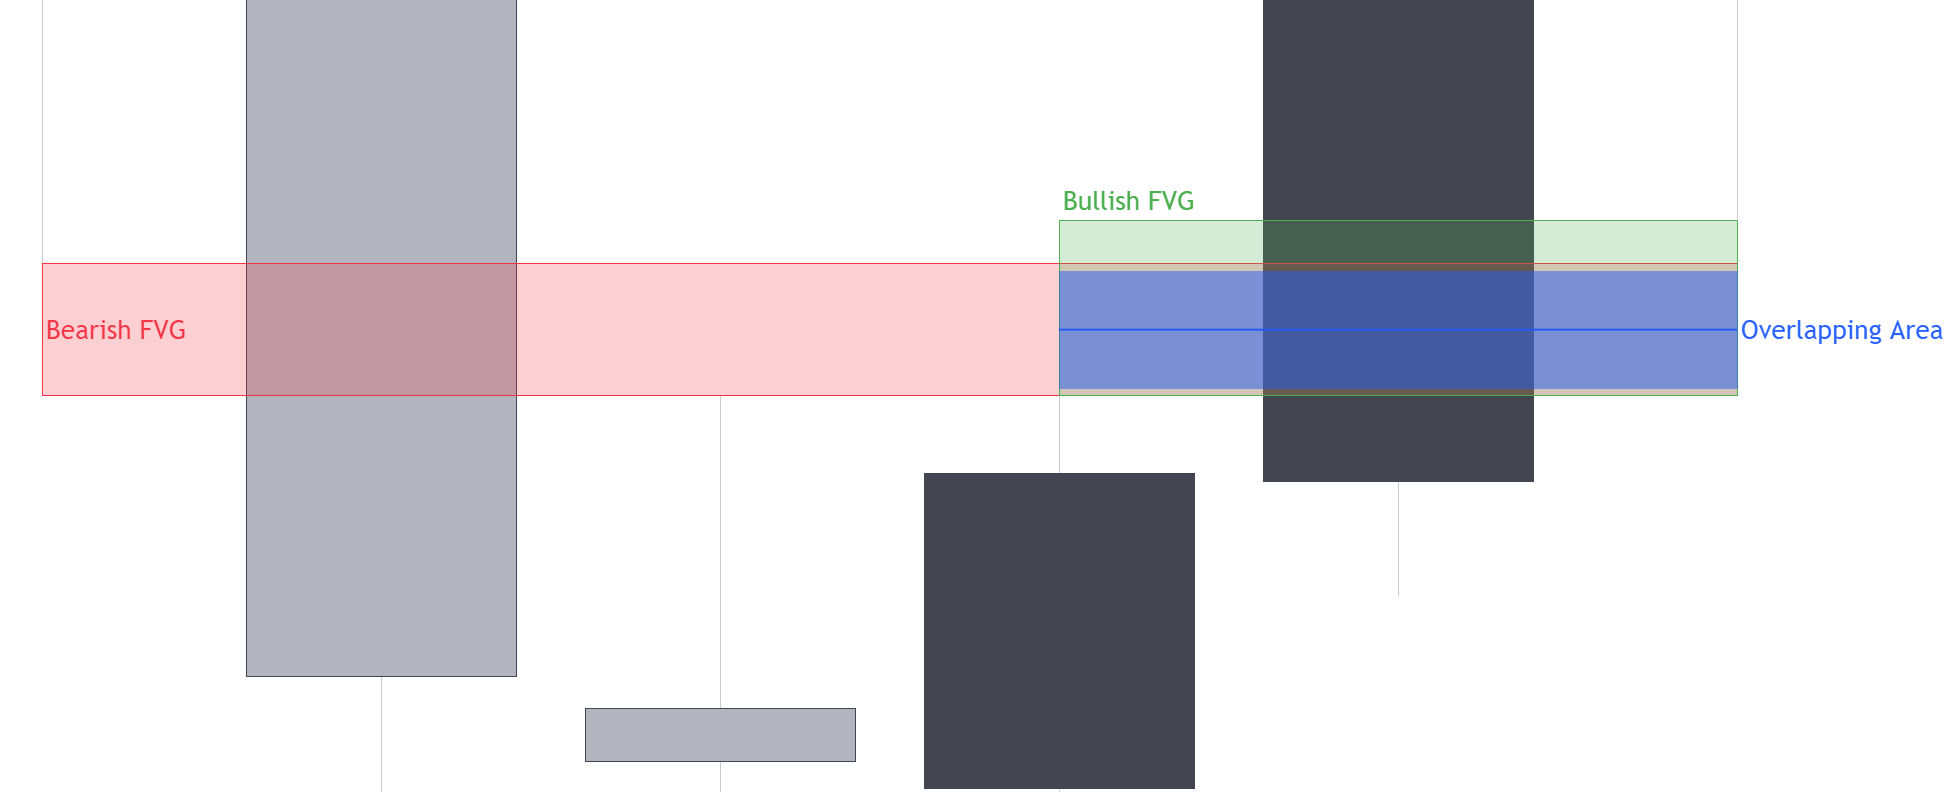 Double Fair Value Gaps, also called balanced price ranges occur when the areas of two Fair Value Gaps overlap. The overlapping areas highlight a new area of imbalance.
A bullish Balanced Price Range is determined by a new bullish Fair Value Gap area overlapping a previous bearish Fair Value Gap area, while a bearish Balanced Price Range is determined by a new bearish Fair Value Gap area overlapping a previous bullish Fair Value Gap area.
Double Fair Value Gaps, also called balanced price ranges occur when the areas of two Fair Value Gaps overlap. The overlapping areas highlight a new area of imbalance.
A bullish Balanced Price Range is determined by a new bullish Fair Value Gap area overlapping a previous bearish Fair Value Gap area, while a bearish Balanced Price Range is determined by a new bearish Fair Value Gap area overlapping a previous bullish Fair Value Gap area.
Volume Imbalance
 Volume Imbalances are market imbalances characterised by two adjacent candles with non overlapping candle bodies, while their wicks overlaps. These imbalances are more commonly found in stocks or second timeframes of cryptocurrencies and forex pairs.
Opening Gap
 Opening Gaps are market imbalances characterised by two adjacent candles with non overlapping candle wicks, highlighting an empty area. These imbalances are more commonly found in stocks or second timeframes of cryptocurrencies and forex pairs.
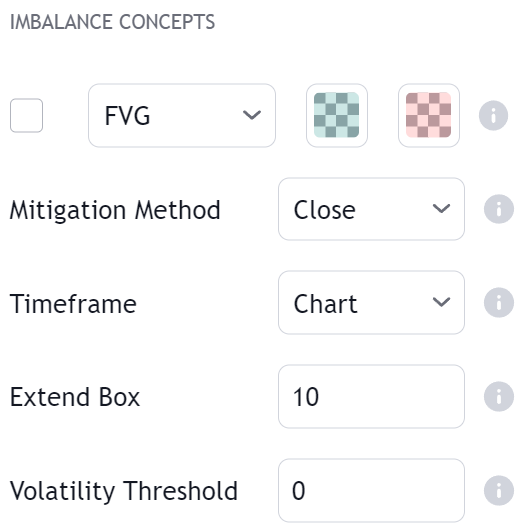
Mitigation Methods
Once price breaks a highlighted imbalance area it is said to have been “mitigated” and will automatically disappear. Within the Price Action Concepts® indicator, users can determine the condition for any imbalance to be considered mitigated trough the Mitigation Method setting, available options include:
| Method | Description |
|---|
| Close | Mitigates an imbalance once price close cross above the imbalance upper extremity in the case of a bearish imbalance, and under its lower extremity in case of a bullish imbalance. |
| Wick | Mitigates an imbalance once price high cross above the imbalance upper extremity in the case of a bearish imbalance, and when price low cross under its lower extremity in case of a bullish imbalance. |
| Average | Mitigates an imbalance once price cross the imbalance area average level. |
| None | Will not remove mitigated imbalances. |
This toolkit makes use of a buffer allowing for a maximum of 200 imbalances. Any newly detected imbalance making the buffer exceed this number will cause the toolkit to discard the oldest detected imbalance.
Volatility Threshold
The volatility threshold allows filtering out less significant imbalances, with higher values preserving imbalances with a larger range.
The volatility threshold is determined from a volatility estimator, the threshold act as a multiplier.Increments of 1 will return visible results. Floating points can be used.
Alerts
Users can be alerted on the detection of a bullish or bearish imbalance, as well as when an imbalance area is mitigated.