Liquidity Concepts
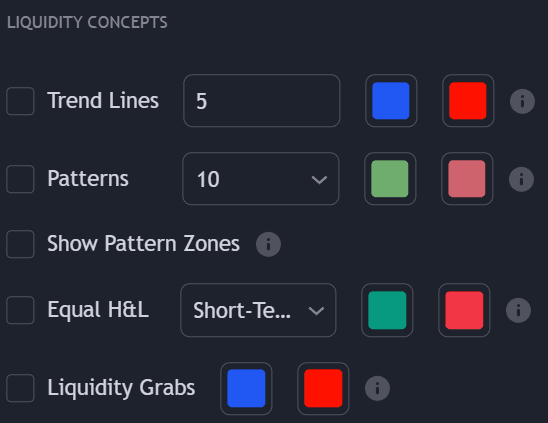
Price Action Concepts® covers a variety of concepts related to liquidity. Each of these concepts can be found in the Liquidity Concepts settings section and are described in the sections below.
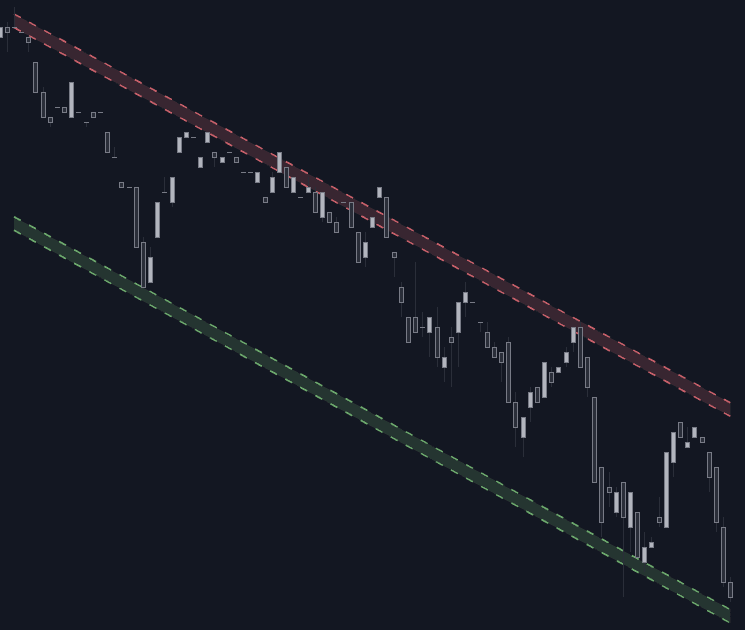
Liquidity Trendlines
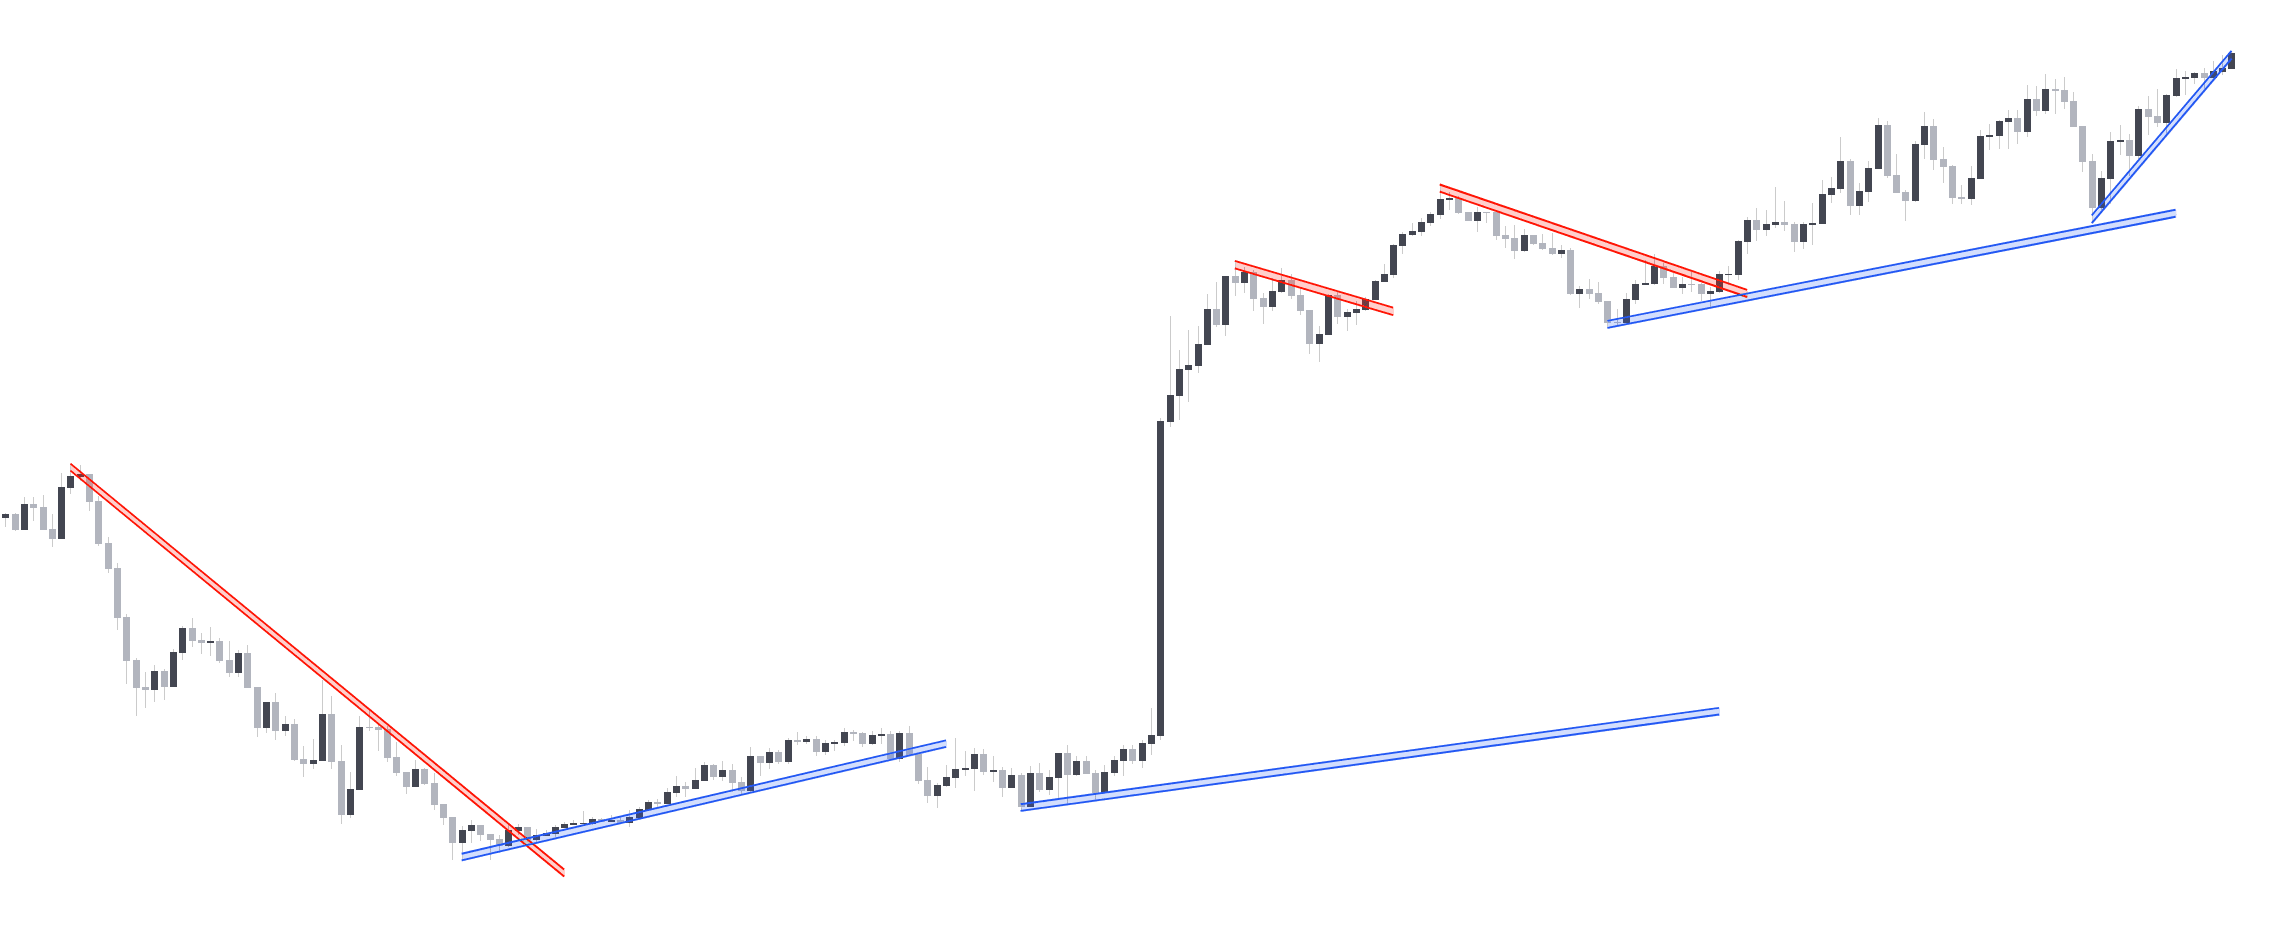
Liquidity Trendlines displays linear zones constructed by taking into account the amount of liquidity at certain price levels, with zones being displayed only if market participants found liquidity in them. The returned zones can give support areas (in blue) during up-trends or resistance areas (in red) during down-trends.
Once price breaks the extremity of a zone we can expect a trend reversal.
Once the conditions for a trendline to be displayed are met, the indicator will display it retrospectively.
The user can determine the amount of historical up-trendlines and down-trendlines to display on the chart to avoid clutter using the provided numerical input setting.
Builtins alerts for trendlines breakouts are available to the users.
Patterns
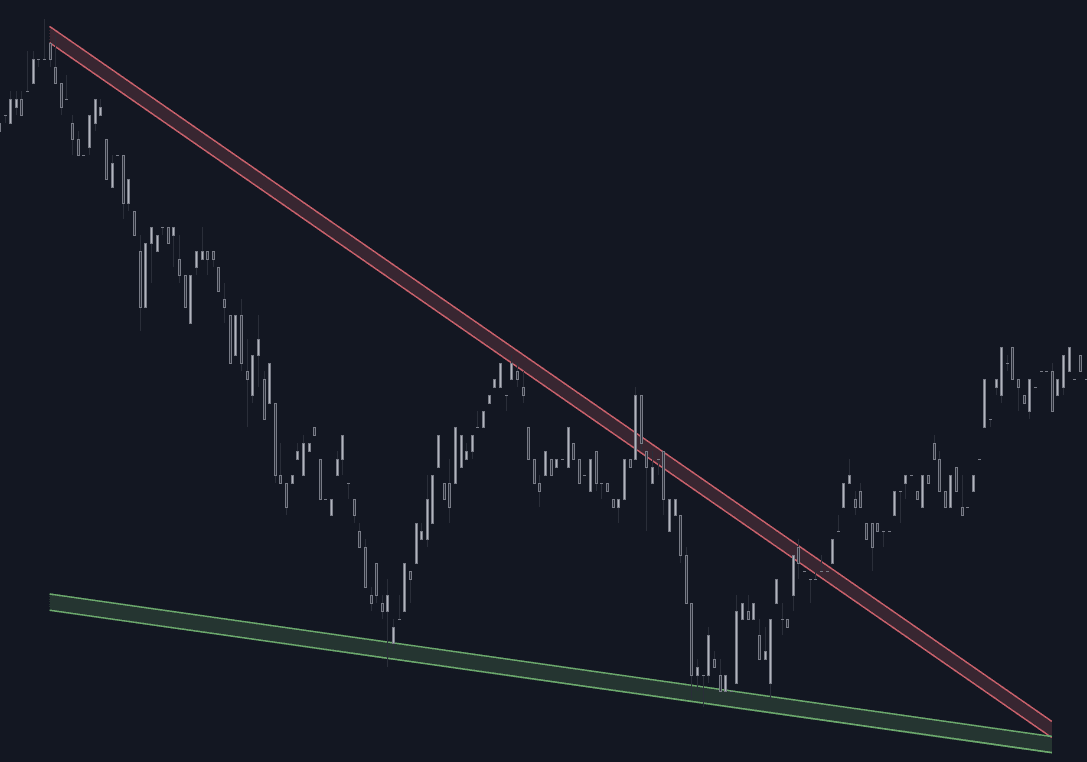
Price Action Concepts® includes an Automatic Pattern Detection feature able to detect various chart patterns as well as a dashboard to give users information about any detected pattern.
The Pattern Detection feature is able to detect the following patterns:
- Ascending/Descending Triangles
- Ascending/Descending Broadening Wedges
- Ascending/Descending/Symmetrical Triangles
- Double Tops/Bottoms
- Head & Shoulders
- Inverted Head & Shoulders
as well as providing general supports and resistances if any of the above patterns are not detected.
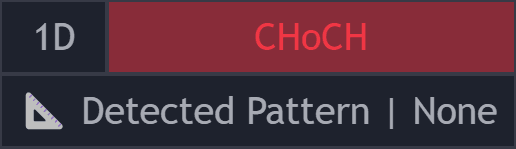
When a pattern is detected, it will be displayed on the dashboard located at the top-right of the chart. Solid lines will highlight the patterns. When no patterns are detected, dashed lines will be displayed that can be used as support and resistance.
Users can detect longer term chart patterns using the provided numerical drop-down menu setting, with higher values detecting longer term patterns.
Builtins alerts for detected patterns are available to the users.
Equal Highs & Lows
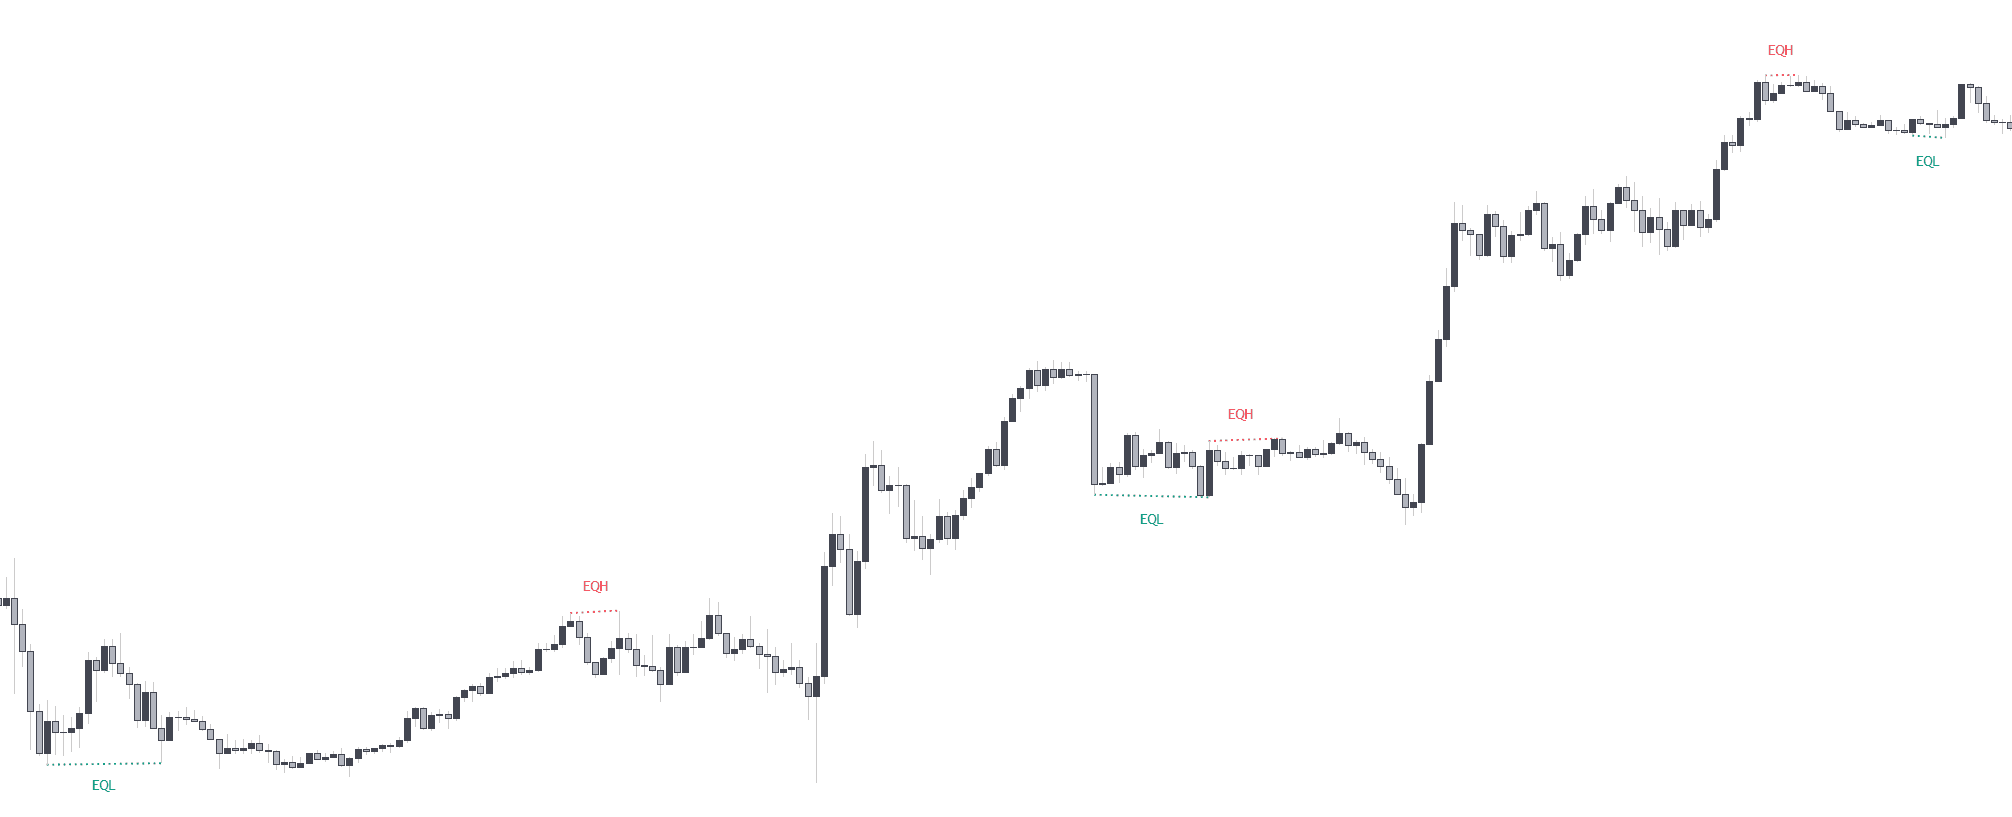
The toolkit returns historical equal high's & low's constructed from swing points. Equal high's & low's can be indicative of reversals, and incoming market structure such as CHoCH or BOS.
Users can display longer term equal high's/low's by increasing the numerical input at the right of the toggle (3 by default).
Equal high's & low's requires the detected swing points to be confirmed, which takes an amount of bars equal to the value set in the numerical input. As such it is important to understand these are displayed retrospectively.
Liquidity Grabs
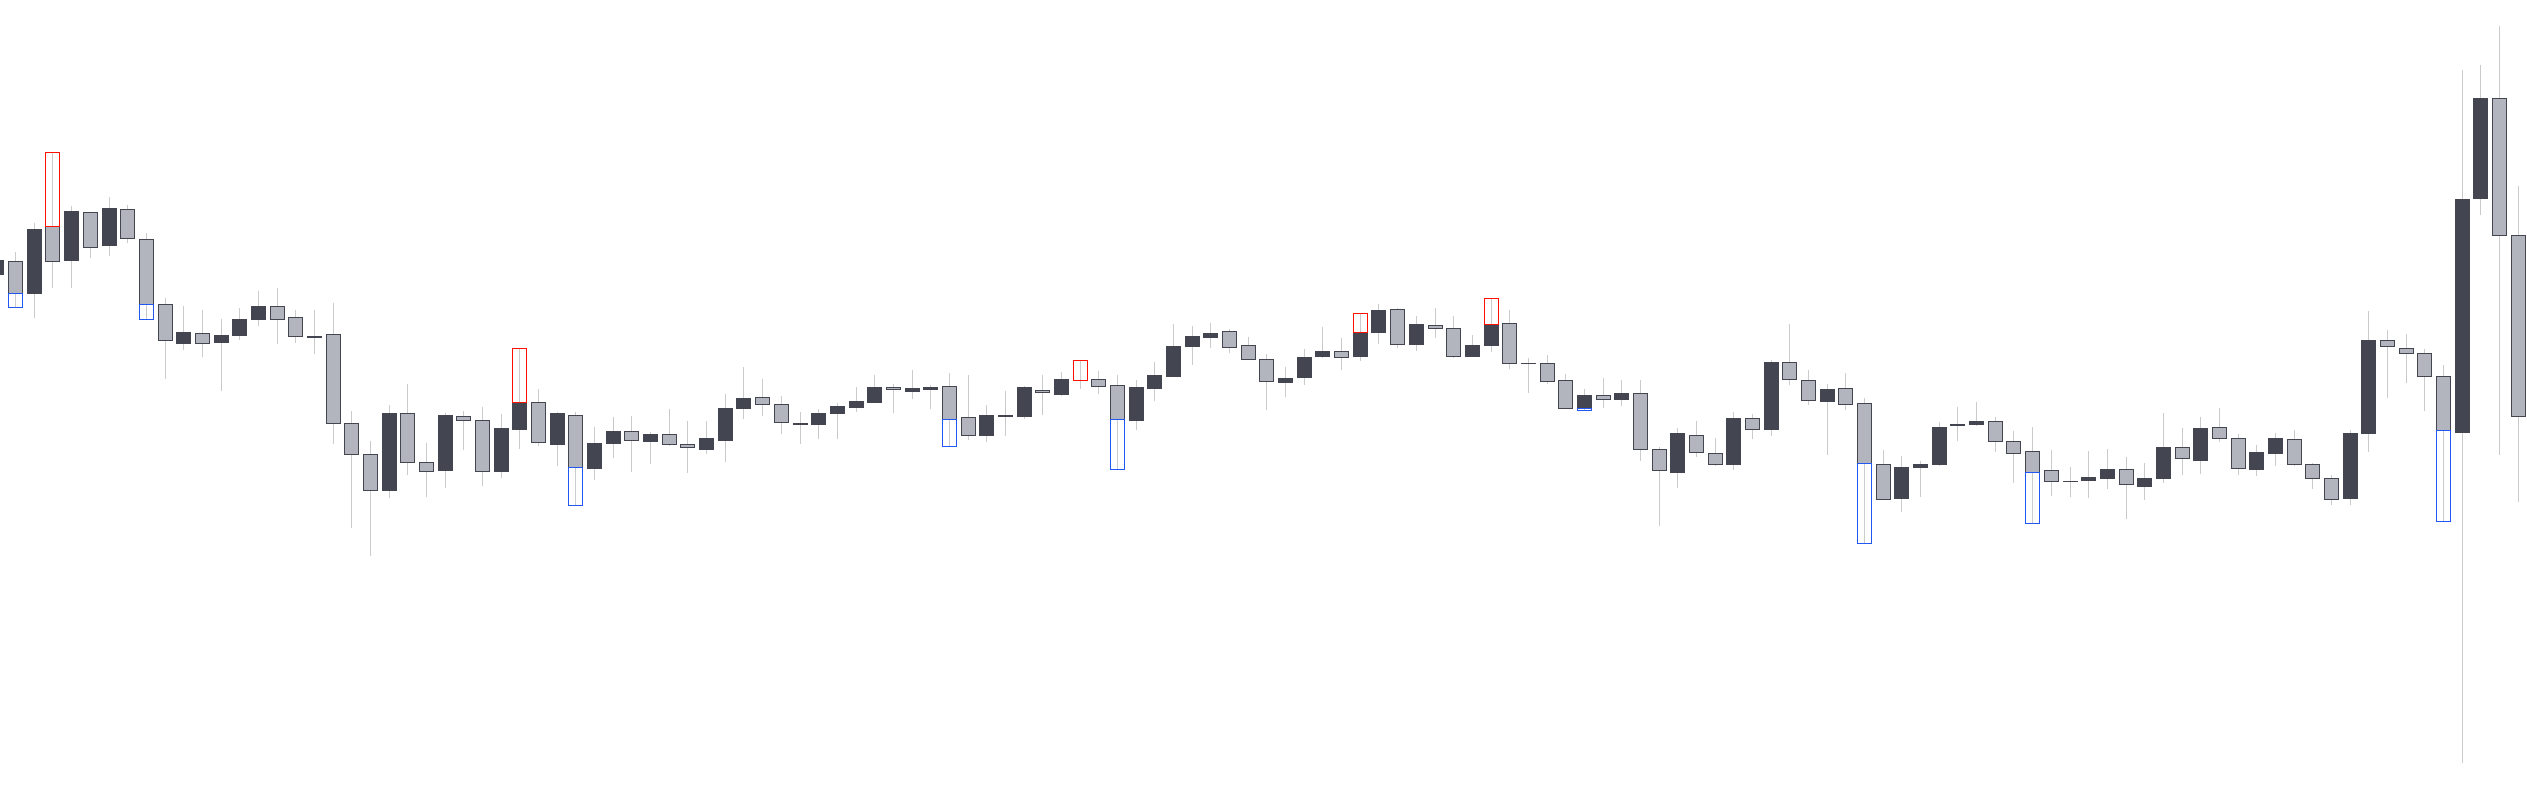
Liquidity Grabs highlight occurrences where trading activity took place in more liquid areas. These are highlighted by the toolkit with colored borders. A liquidity grab can be identified as a bullish grab if the activity took place in a demand area, or a bearish grab if this activity took place in a supply area.
Bullish liquidity grabs are highlighted in blue with borders ranging from the price low to candle body minimum and indicates a potential bullish reversal.
Bearish liquidity grabs are highlighted in red with borders ranging from the price high to candle body maximum and indicates a potential bearish reversal.
The occurrence of both bullish and bearish liquidity grabs at the same time can highlight market indecision's.
Built-in alerts for liquidity grabs are available to users within Price Action Concepts®.