 Market structure is a core component of the price action. The Price Action Concepts® toolkit automatically detects and highlights real time market structure on your chart, allowing for a clean picture of market trends without introducing traditional forms of technical analysis like moving averages.
Type Of Market Structures
 Market structure allows traders to understand trend reversals as well as trend continuations in the market through two distinct identifications:
- Change of Character (CHoCH)
- Break of Structure (BOS)
These are further described in the subsections below.
Change Of Character (CHoCH)
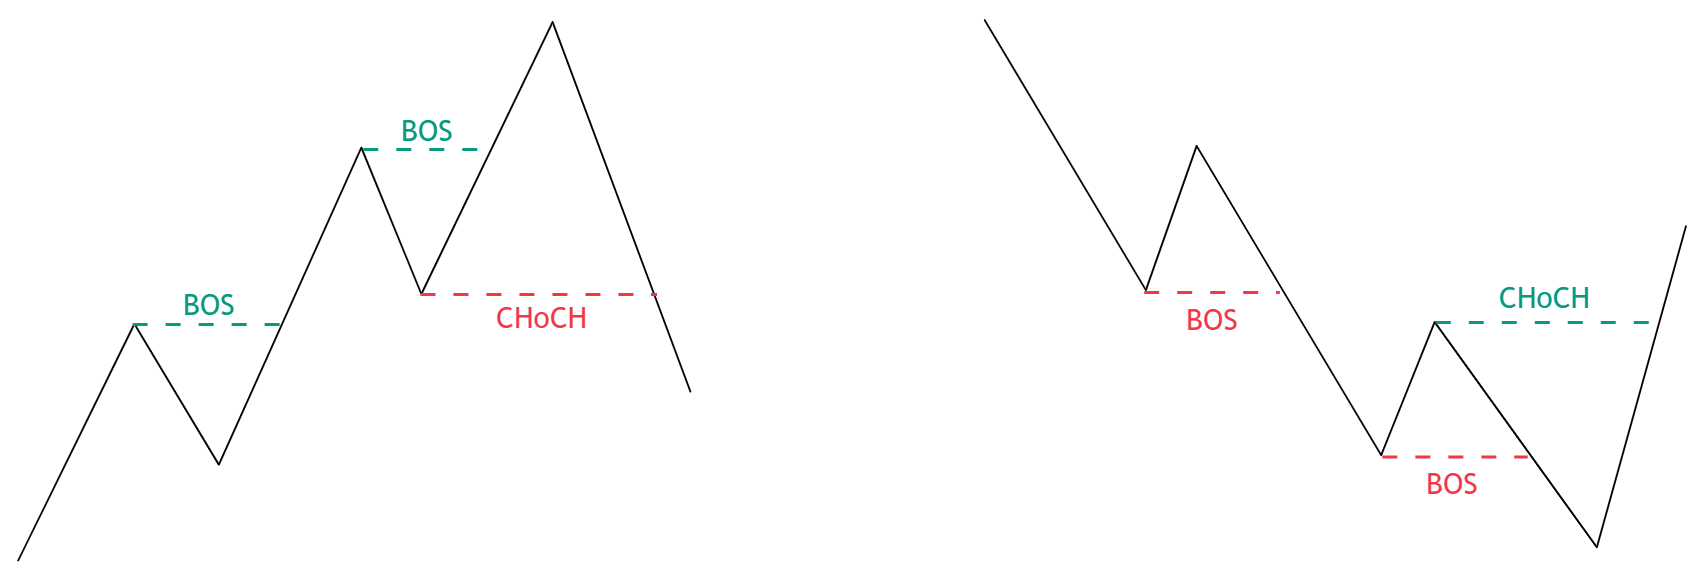
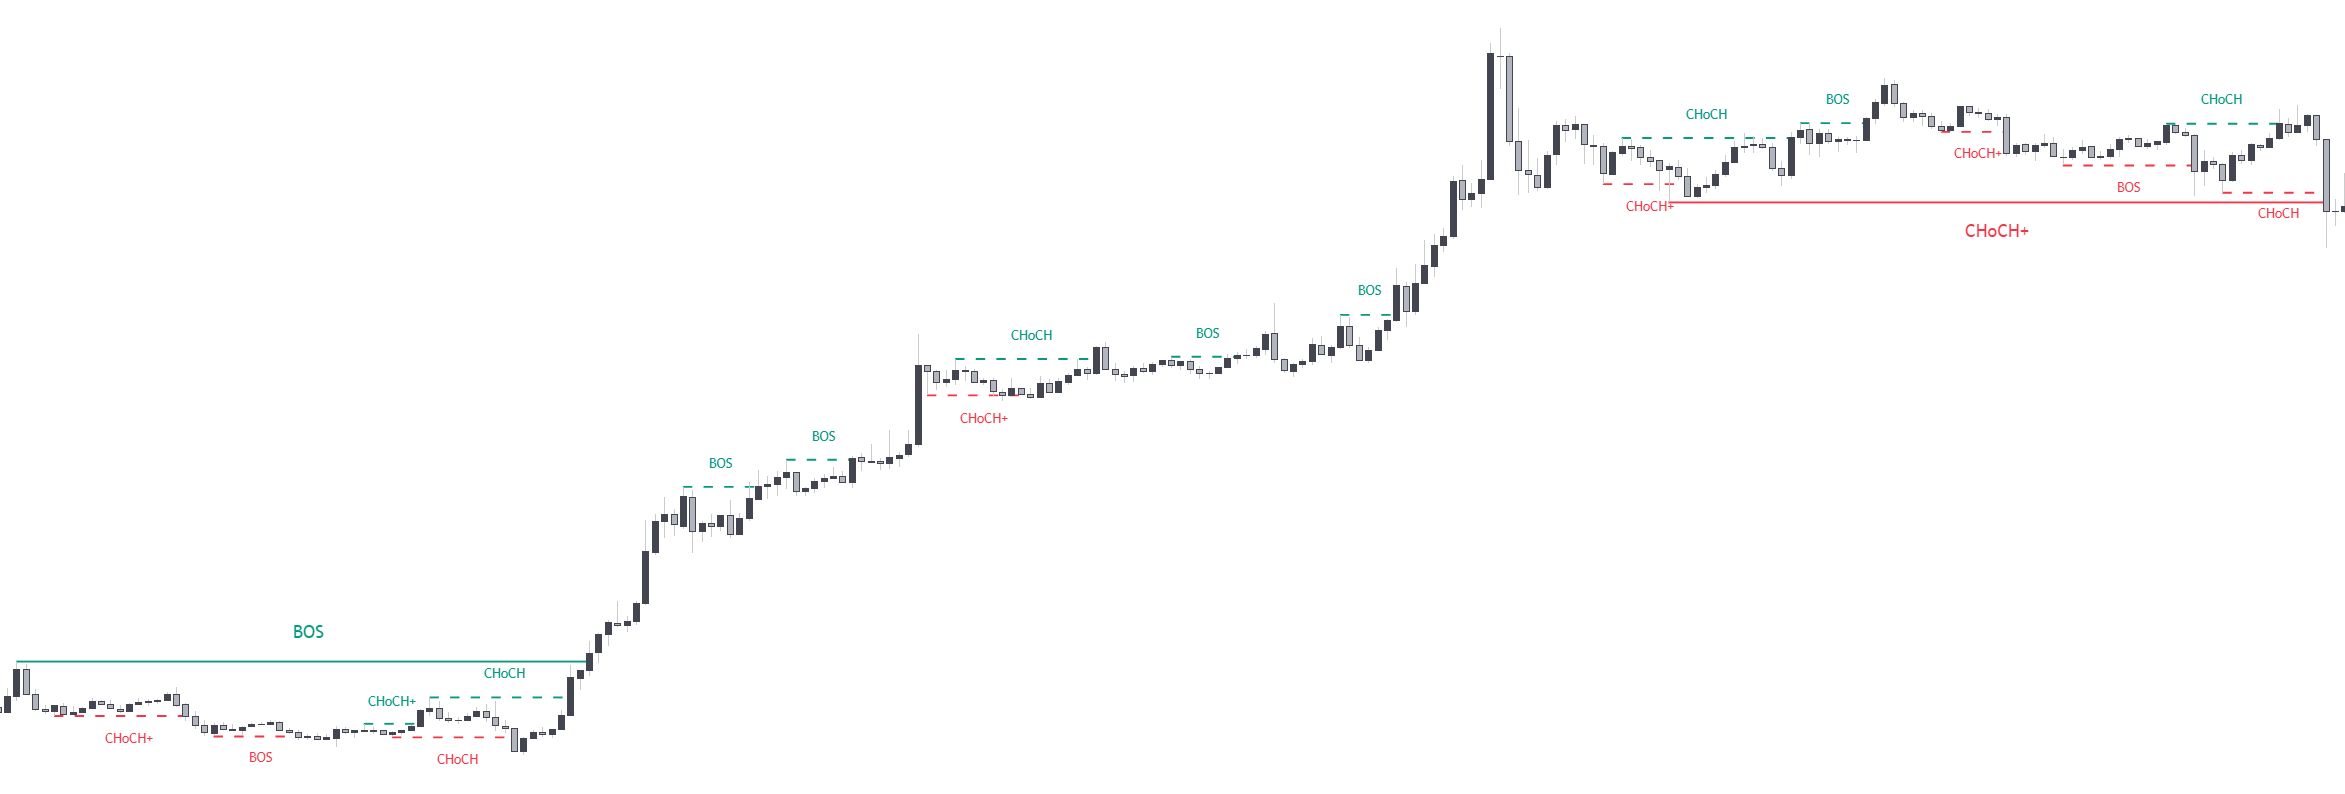
 A change of character (CHoCH), sometimes also referred as ‘market structure shift’ is characterized by price breaking a prior swing low during an uptrend (bullish CHoCH) or a prior swing high during a downtrend (bearish CHoCH), and thus indicates a potential market reversal.
The Price Action Concepts® toolkits labels two distinct type of CHoCHs:
A change of character (CHoCH), sometimes also referred as ‘market structure shift’ is characterized by price breaking a prior swing low during an uptrend (bullish CHoCH) or a prior swing high during a downtrend (bearish CHoCH), and thus indicates a potential market reversal.
The Price Action Concepts® toolkits labels two distinct type of CHoCHs:
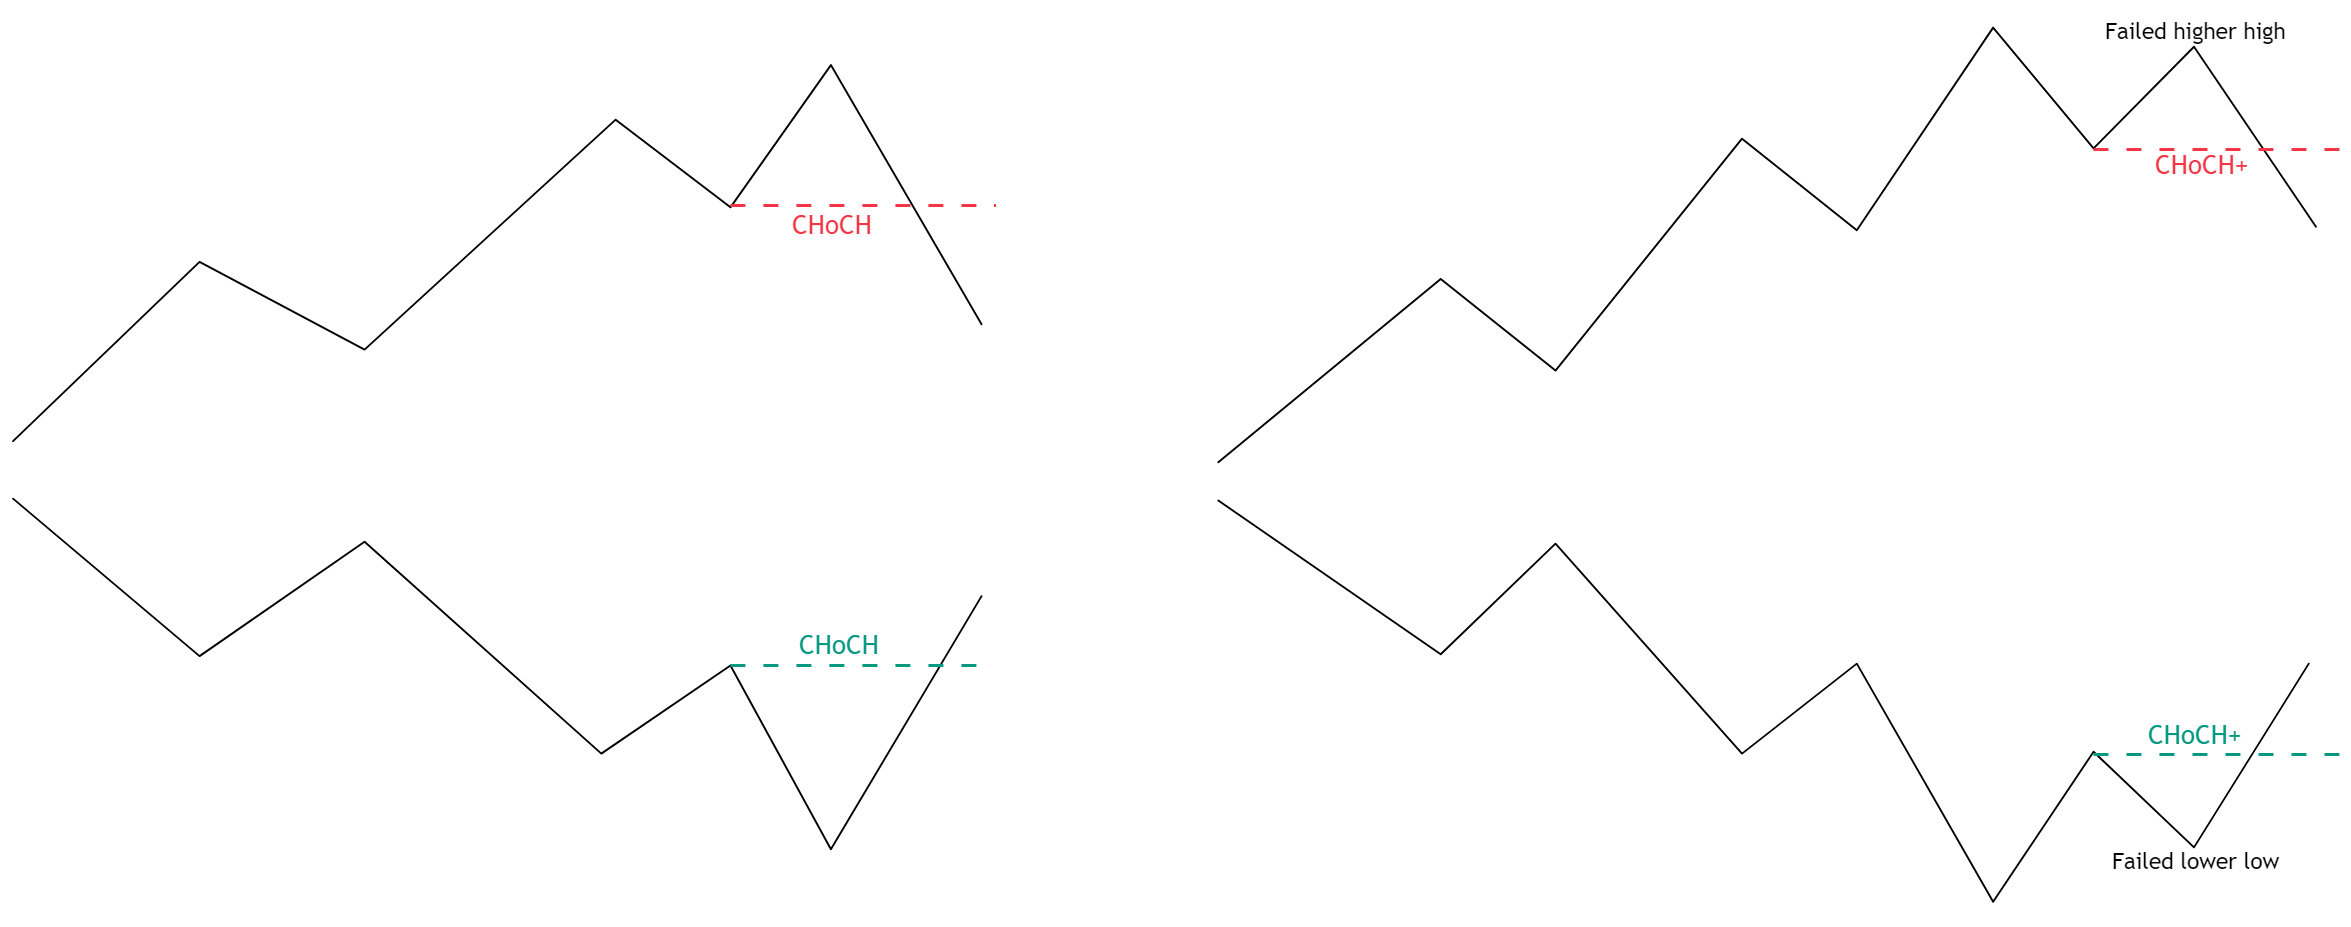
- Leading CHoCH (labelled as CHoCH)
- Supported CHoCH (labelled as CHoCH+)
The difference between each is based on the relative position of prior swing highs/lows. A leading CHoCH is characterized by price not having prior signs of a reversal, such as a failed higher high (lower high) during an uptrend or a failed lower low (higher low) during a downtrend.
On the other hand, a supported CHoCH (CHoCH+) is preceded by an early sign of market reversal, such as a failed higher high (lower high) during an uptrend or a failed lower low (higher low) during a downtrend.
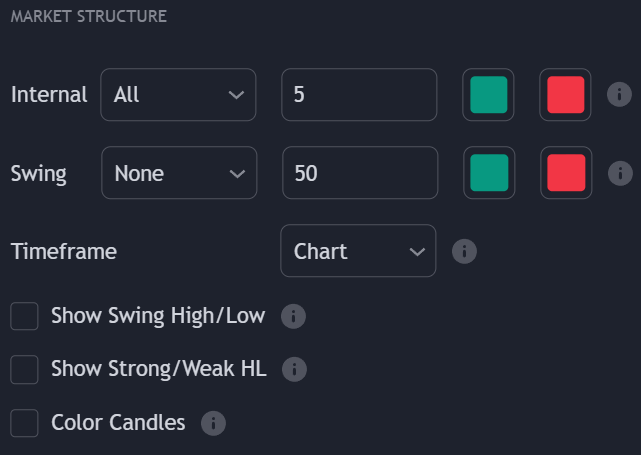
Users can show allow the toolkit to show all or only specific types of CHoCH’s from the drop-down menus within the Market Structure settings section in the toolkit.
Break Of Structure (BOS)
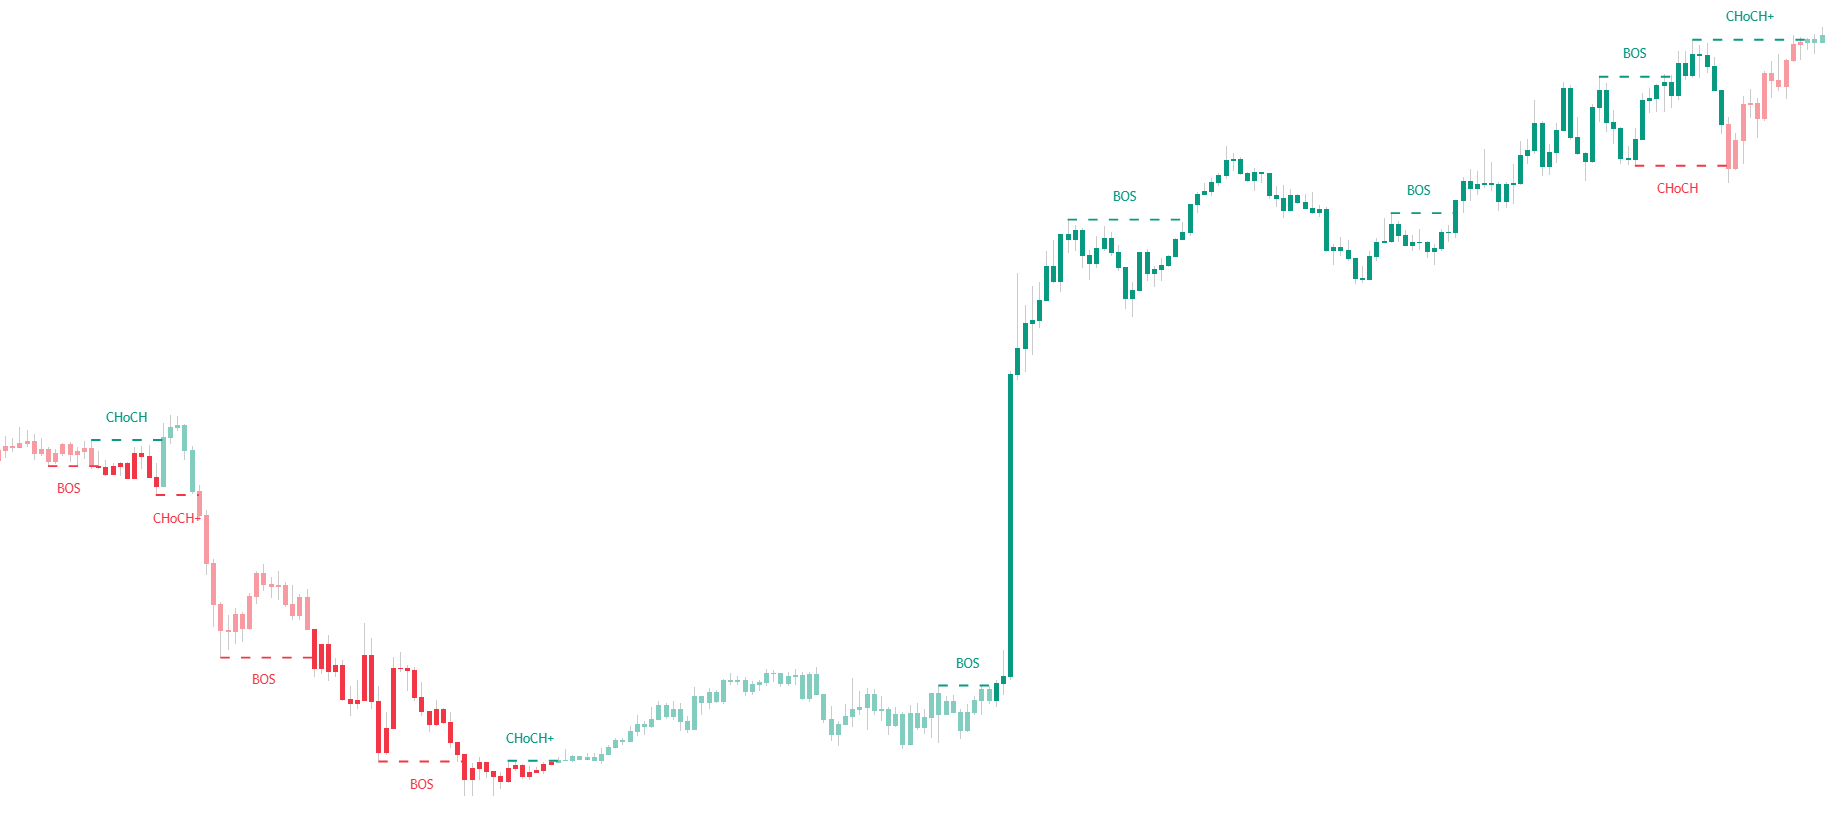
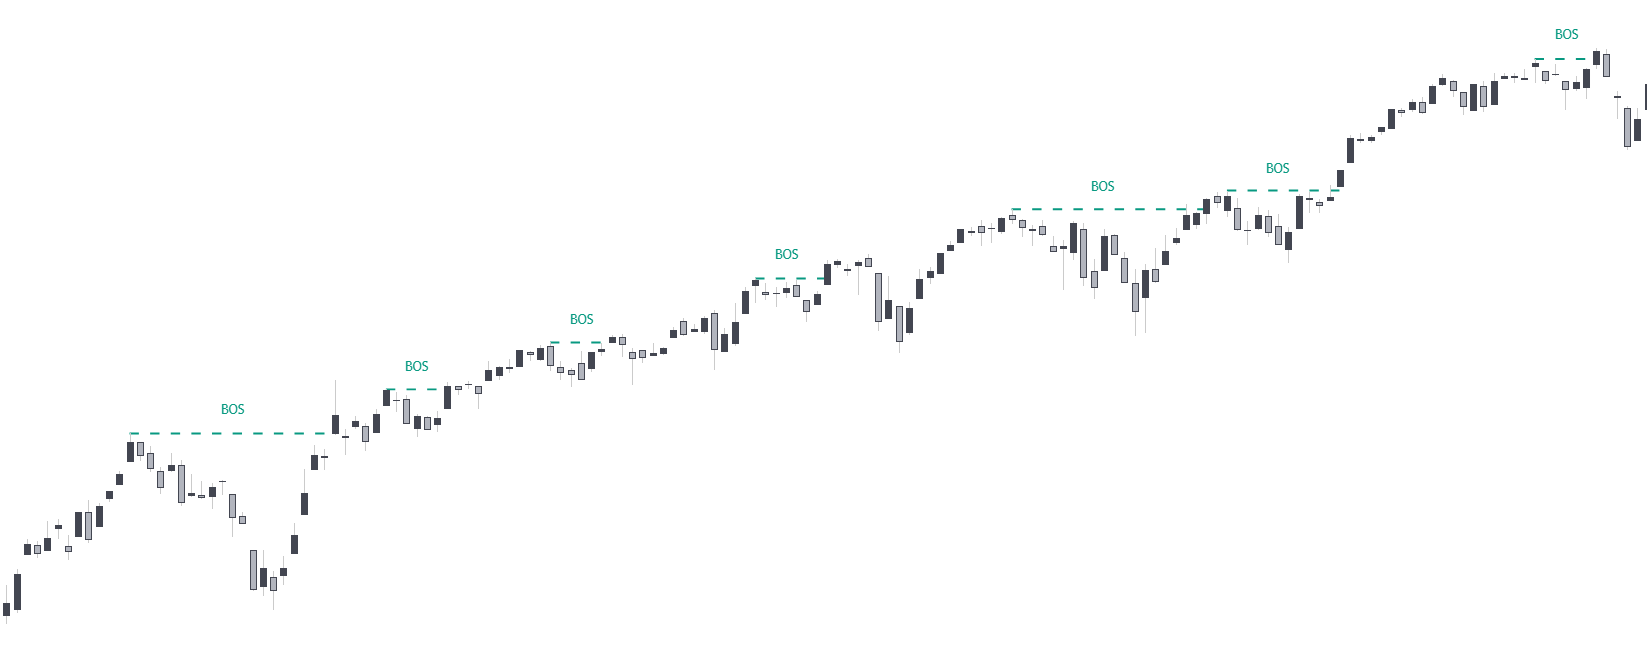 A break of structure (BOS) can be thought of primarily as a trend continuation label. This structure is the opposite of the CHoCH, with a BOS being when price breaks a prior swing high during an uptrend (bullish BOS) thus forming a new higher high, or when price breaks a prior swing low during a downtrend (bearish BOS) thus forming a new lower low. This structure only can occur after a CHoCH.
Since BOS’s indicate trend continuations, it is common to observe successive BOS’s.
A break of structure (BOS) can be thought of primarily as a trend continuation label. This structure is the opposite of the CHoCH, with a BOS being when price breaks a prior swing high during an uptrend (bullish BOS) thus forming a new higher high, or when price breaks a prior swing low during a downtrend (bearish BOS) thus forming a new lower low. This structure only can occur after a CHoCH.
Since BOS’s indicate trend continuations, it is common to observe successive BOS’s.
Swing & Internal Structure
 The Price Action Concepts® toolkit offers two distinct dimensions when it comes to market structure:
- Internal Structure
- Swing Structure
Internal structure are constructed from shorter term swing high/low points, while swing structure are constructed from longer term ones. Users can select the lookback used for the swing point detection for both the internal and swing market structures construction.
Internal structures can use a lookback in range (5, 49). Swing structures can use a lookback in the range (50, 100).
The toolkit highlights internal structure with dashed lines and labels with a smaller text size.
The size of the labels for internal and swing structure can be changed from the General Styling settings section.
Candle Coloring
 Users can color candles depending on the detected internal market structure. This is useful if users want to be able to determine a detected internal market structure without having labels and lines on their chart, freeing up space on the chart to use other indicators.
Candle coloring is affected by the colors settings selected by the user for the internal market structure. Candle coloring is determined as follows:
Users can color candles depending on the detected internal market structure. This is useful if users want to be able to determine a detected internal market structure without having labels and lines on their chart, freeing up space on the chart to use other indicators.
Candle coloring is affected by the colors settings selected by the user for the internal market structure. Candle coloring is determined as follows:
- Darker bullish color : Bullish CHoCH active
- Regular bullish color : Bullish BOS active
- Darker bearish color : Bearish CHoCH active
- Regular bearish color : Bearish BOS active
Users can make highlighted structure and candle colors monochrome from the General Styling settings by using the monochrome option in the Theme drop down menu.
Swing High/Low
Users can display swing high/low by enabling the “Show Swing High/Low” setting, highlighting past points where a reversal occurred. Displayed swing points can be denoted as:
- HH (Higher high)
- HL (Higher low)
- LH (Lower high)
- LL (Lower low)
The displayed swing points are affected by the period selected for the internal market structures, with higher values returning longer term swing points.
Swing points are displayed retrospectively, and as such are not detected where they are located. They should not be used for real-time applications.
Strong/Weak High/Low
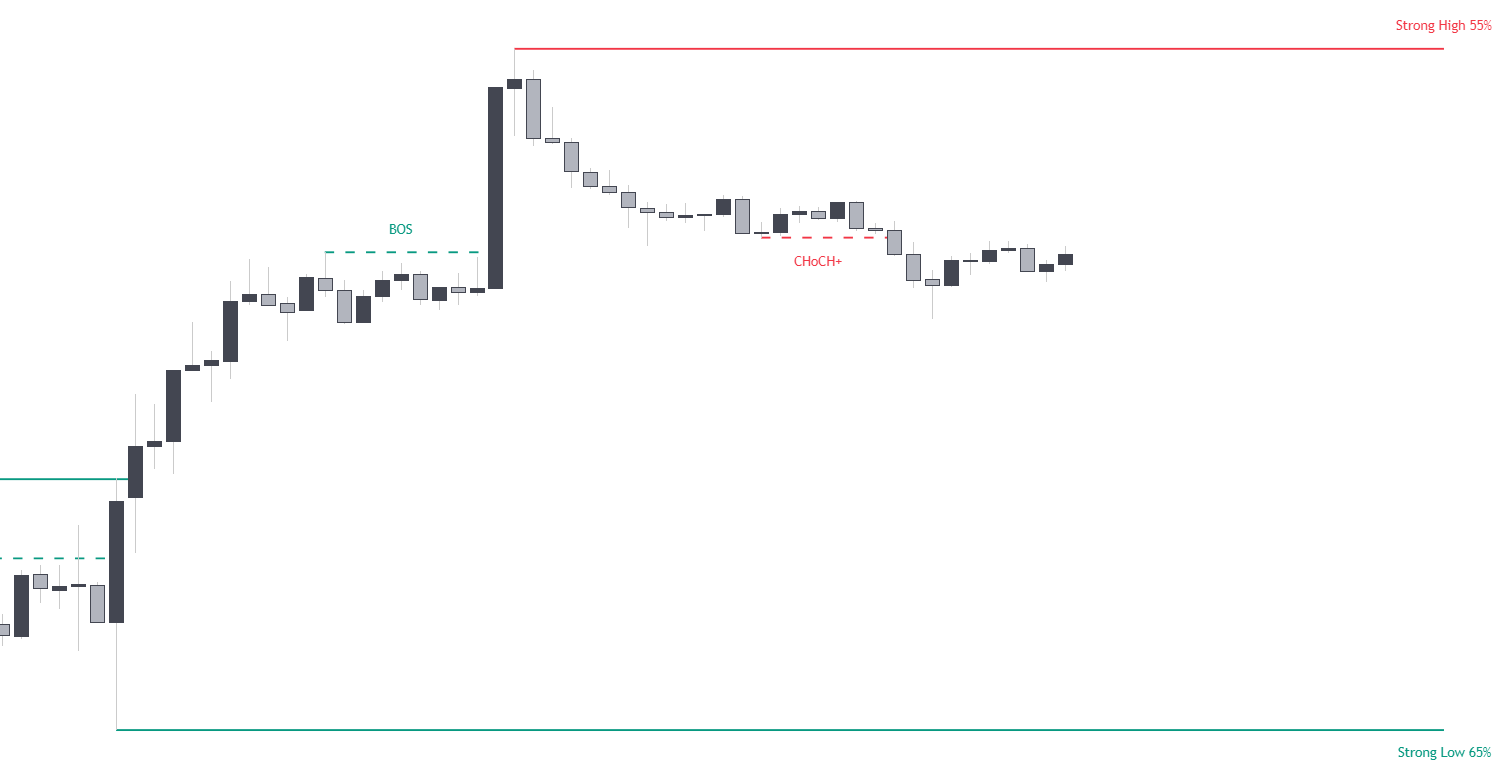 Strong/Weak High/Lows highlight maximum and minimum levels made from medium term swings. A relative percentage derived between the trading volume that occurred on both swings is also highlighted, and is used to determine if a maxima/minima is strong or weak.
The displayed swing points are affected by the period selected for the internal market structures, with higher values returning longer term swing points.
Strong/Weak High/Lows highlight maximum and minimum levels made from medium term swings. A relative percentage derived between the trading volume that occurred on both swings is also highlighted, and is used to determine if a maxima/minima is strong or weak.
The displayed swing points are affected by the period selected for the internal market structures, with higher values returning longer term swing points.
Alerts
Built-in alerts are available for each supported market structure, including swing structures, internal structures, and equal highs/lows.