
Replay Mode
Study chart history one candle at a time, at your own pace.
Replay Mode lets you return to a point in chart history and watch the following candles appear in sequence. Use it to practice reading a setup, review how a move developed, or trade the replay on a simulated account without starting with the full outcome visible.
Replay Mode is free with a signed-in account in Vela, our next-generation charting platform. Playback runs client-side, in your browser.
Start a replay
- Open the chart you want to review in Vela.
- Select Replay from the chart controls.
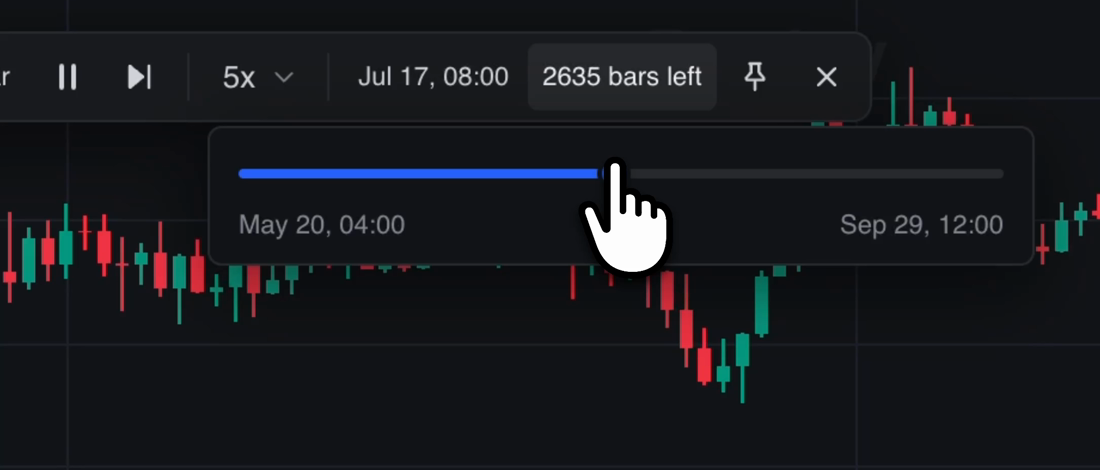
- Click the candle to start from, choose a starting date, or use the history slider to select a specific candle. Press Esc to cancel.
- Set the update speed, then start playback. Every replay starts at 5x.
The chart advances from your chosen point, revealing the candles that follow it. Start before the setup you want to study so you can review the information available as it develops.
Choose a starting point
Select a start date when you already know the period you want to revisit. Use the history slider when you want to find a particular candle or move through the available chart history visually.
For example, start just before price reaches a level you are watching. Decide what would confirm or invalidate your setup, then play forward to see what follows. Choose another starting point to review a different occurrence.
Control playback speed
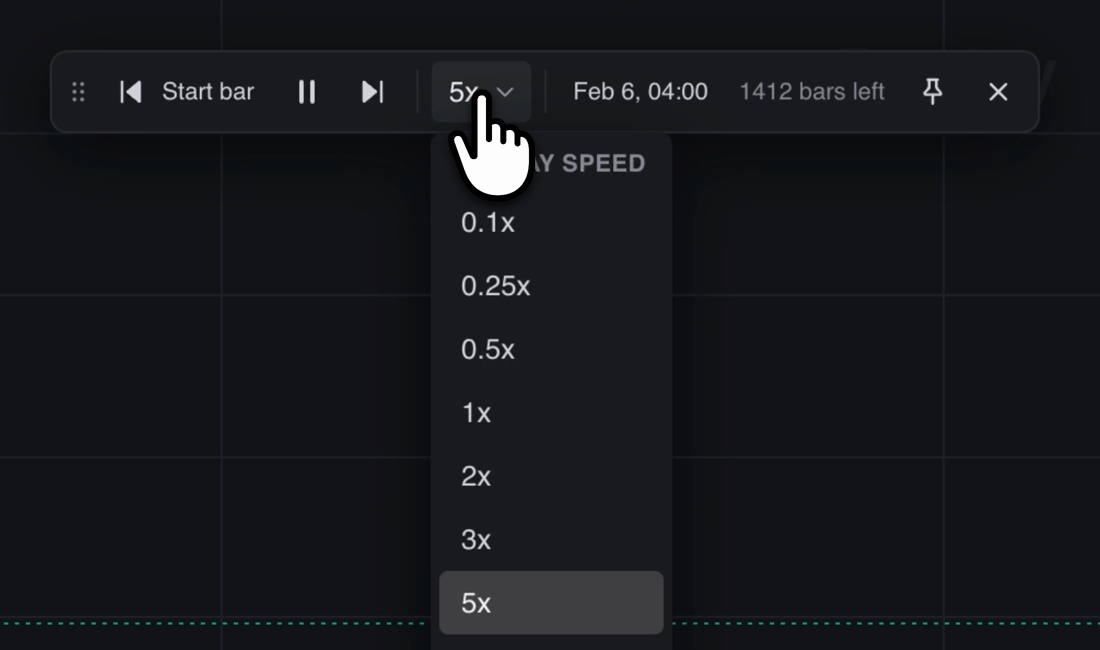
The update speed controls how quickly candles appear during playback. Every replay starts at 5x. Open the speed dropdown in the toolbar, shown as a multiplier such as 1x or 5x, to change it. Use a slower pace to inspect individual bars or a faster pace to review a longer stretch of history. Use Play/Pause to start or pause playback.
Playback speed and chart timeframe serve different purposes: the timeframe determines what each candle represents, while playback speed determines how quickly the replay reveals those candles.
Trade a replay
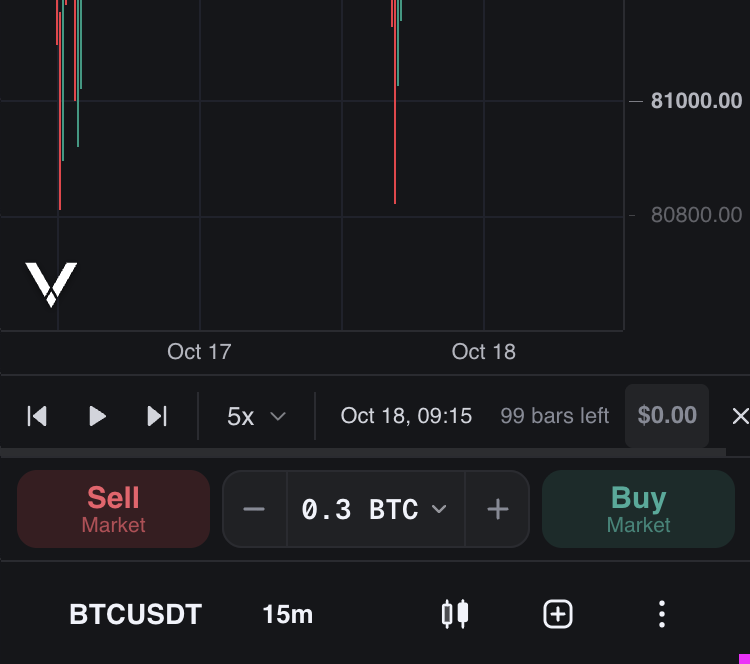
With Paper Trading, the replay bar becomes a trading bar: Sell, the size with its unit, and Buy, followed by the replay's running P&L. Orders fill at once, at market, on the replayed price, and your positions show as lines on the chart as history plays forward.

- Size orders the way you do live: the unit you picked for the asset carries over, and so do your order presets. Click the unit to open the same Size in choices beside the size.
- Right-click the chart at a price to place a limit or stop on the replay at once.
- Close part of a position, or reverse it, from its line on the chart.
- Replay trades use a separate simulated account that starts at $100,000. They fill with no commission and never touch your paper account.
While a replay is on, the order panel says Replay is on: trade it from the replay bar, and the chart's live Buy and Sell buttons hide. Replay trading needs a signed-in account.
On a phone, Trade in the bottom bar gives way to an order strip just under the replay bar: Sell, the size with − and + either side, and Buy. Sell and Buy trade the replay at once, at its price. − and + step the size by a round amount, such as $100 on $1,000. Tap the size, or the replay's P&L, to type it in another unit, pick a preset, and press Done.
Replay keys
| Shortcut | Action |
|---|---|
Shift+B / Shift+S | Buy / sell at market |
Shift+1 to Shift+9 | Trade the preset assigned to that key, at market |
Shift+C | Close the position |
Shift+R | Reverse the position |
Space | Play / pause |
Shift+→ | Step to the next update |
Replay results
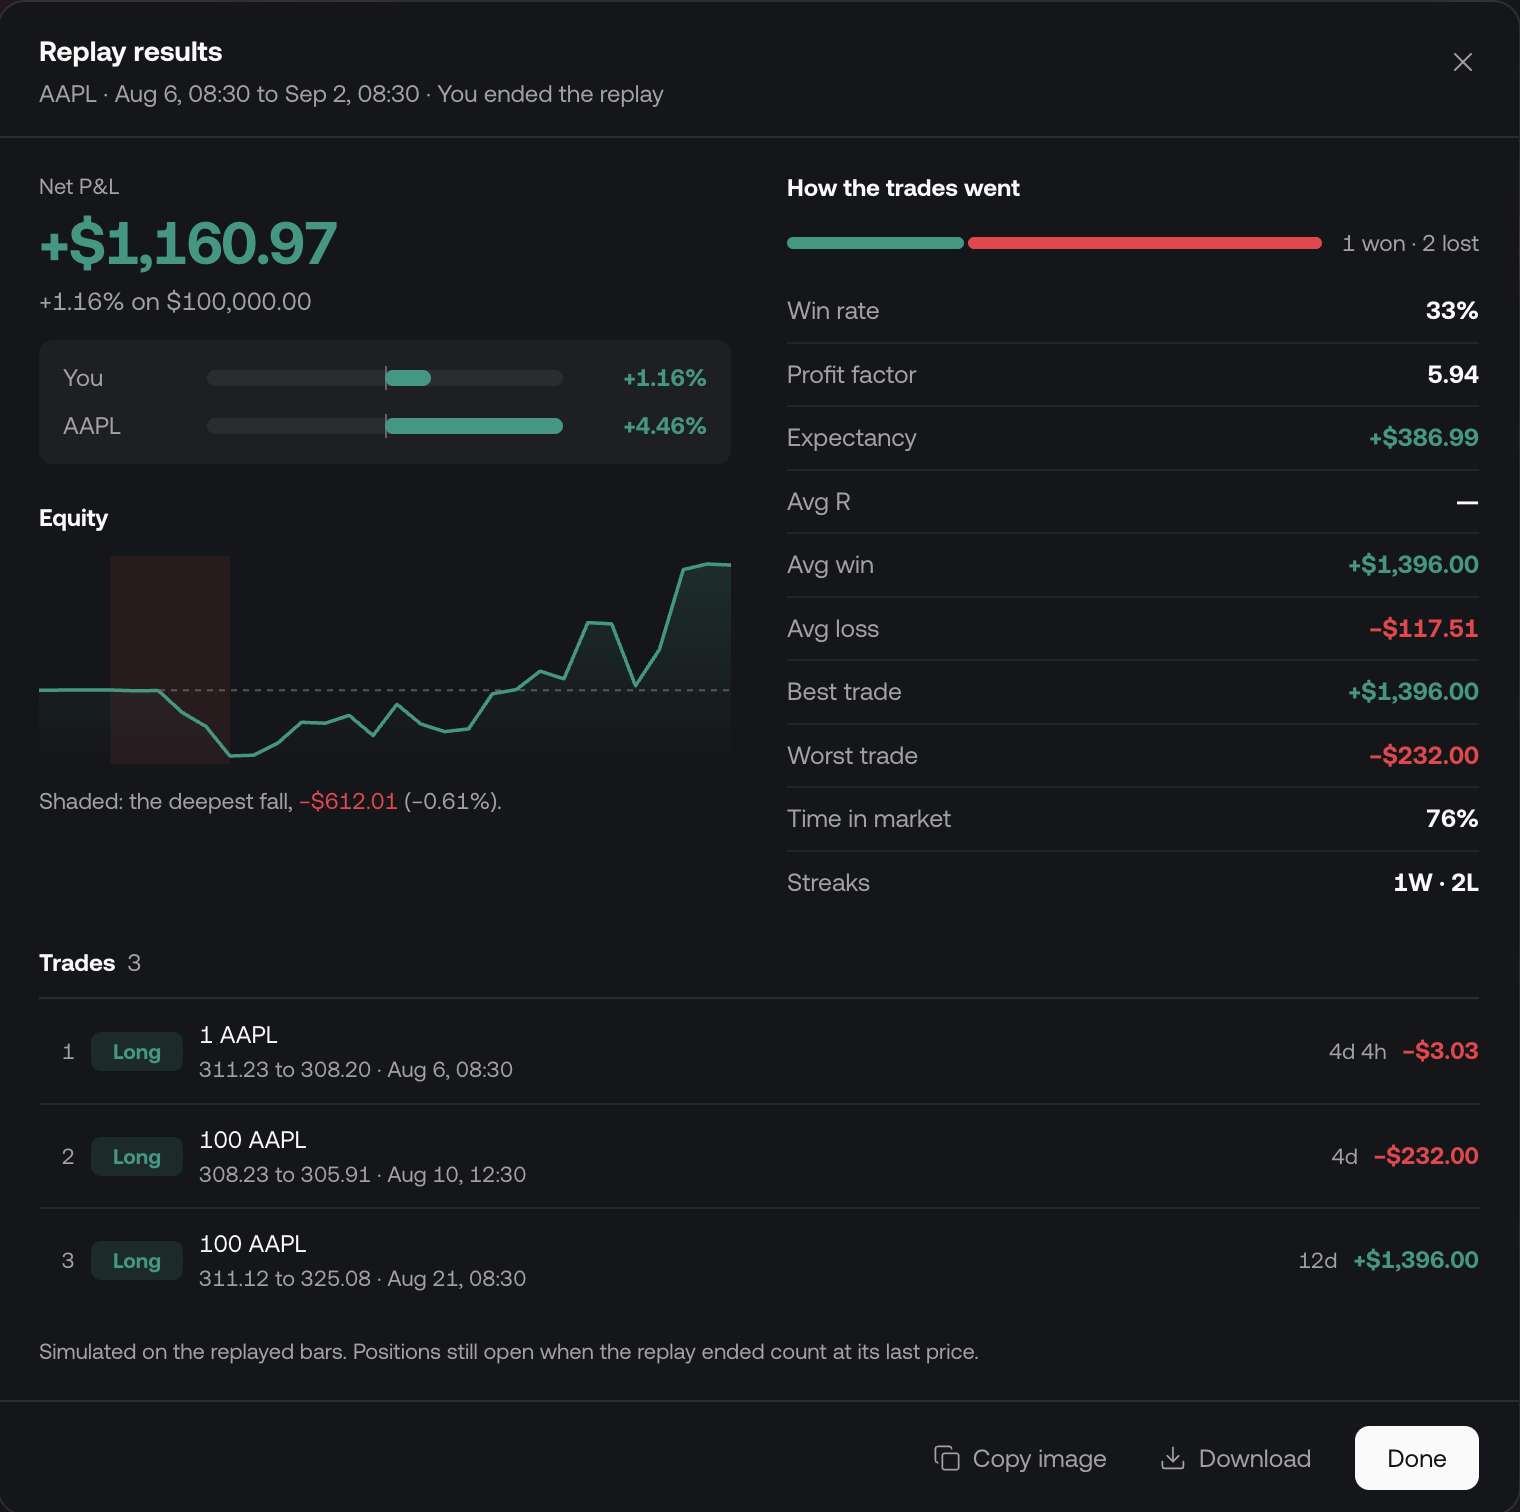
When a replay with at least one fill ends, a Replay results card sums it up: net P&L against $100,000, how you did against the symbol's own move, the equity curve with its deepest fall shaded, and how the trades went:
| Figure | Meaning |
|---|---|
| Win rate | Share of trades that made money |
| Profit factor | Gross profit divided by gross loss |
| Expectancy | Average P&L per trade |
| Avg R | Average result in multiples of the initial risk, when trades had a stop |
| Avg win / Avg loss | Average winning and losing trade |
| Best trade / Worst trade | The largest win and loss |
| Time in market | Share of the replay with a position open |
| Streaks | Longest run of wins and of losses |
Every trade is listed under the figures. Copy image and Download save the card as an image to share. If you rewind instead of ending, the results wait behind a View results button.
Floating or docked toolbar
The Replay toolbar can float over the chart or be docked/pinned.
- Floating: position the controls where they are convenient for the part of the chart you are reviewing.
- Docked/pinned: keep the controls in a fixed location while you follow the chart.
Use the toolbar's pin control to switch its placement.
Replay with multiple charts
Replay Mode supports multi-chart layouts. Open your layout, select Replay, choose the starting point, and set the update speed to review the charts together as playback progresses.
The smallest timeframe in the layout determines the replay step. For example, with 1-minute and 1-hour charts, playback advances on the 1-minute interval; selecting the 1-hour chart does not make each update jump ahead by an hour.
Every plan supports up to 16 charts per tab. Sign in to use multi-chart Replay; no paid plan is required.