
Making indicators
Have Quant write an indicator from a request, a screenshot, or a selected chart region, then plot and repair it.
Ask Quant in the chat for the study you want. It writes a Pine Script® indicator, plots it on the active chart, and marks it in the legend so you can tell it apart from library studies.
This page is about generating custom studies. Quant can also add scripts from the LuxAlgo Library when you ask for them in chat. To browse Library studies or add built-in and order-flow indicators yourself, use the Indicators picker.
Describe the study
Tell Quant what you want in the chat. Include where it should render: in its own pane below the chart (oscillators like RSI) or as an overlay on the price candles (moving averages, bands, signals), plus any colors, line styles, or conditions that matter to you.
Review the script
Quant plots the result on the active chart. Open Pine editor to see the generated Pine Script®, then Run (after you sign in). You can edit the code by hand at any point and re-run it.
Iterate
Request one change per message ("make the overbought zone red", "add an alert condition when the lines cross") until it matches what you had in mind. Small, single-purpose requests produce much better edits than a list of five changes at once. You can create, edit, or remove multiple scripts in the same chat; name the script you want to change.
Every plan, including Free, has unlimited tools per chart, including Quant scripts.
Keep it on the workspace
Scripts Quant creates and edits belong to the current workspace until removed. There is no separate Add to workspace or commit step to keep them there.
A single chat can manage several scripts. Ask Quant to create another indicator, edit a named script, remove one you no longer need, or add a script from the LuxAlgo Library. Creating a new script does not require starting a new chat.
To find scripts you created with Quant or saved from the Pine editor, open Indicators → My scripts. Use the editor’s Save control or Ctrl+S / ⌘S to save a reusable script; see Pine editor.
Add to chart
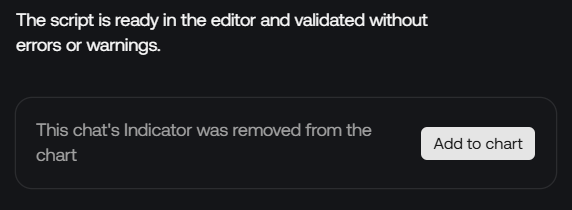
Add to chart adds the latest script created during the chat session to the active chart. It does not select the latest script merely because you edited it.
For example, if you create an RSI indicator, then create a moving average, then edit the RSI, Add to chart selects the moving average. To choose a specific Quant-created script, use My scripts in the Indicators picker.
Starring a Quant script is separate: Favorites follow your account, so you can find starred scripts in the picker on any workspace.
From a screenshot
Quant can reverse-engineer an indicator or chart markup from an image.
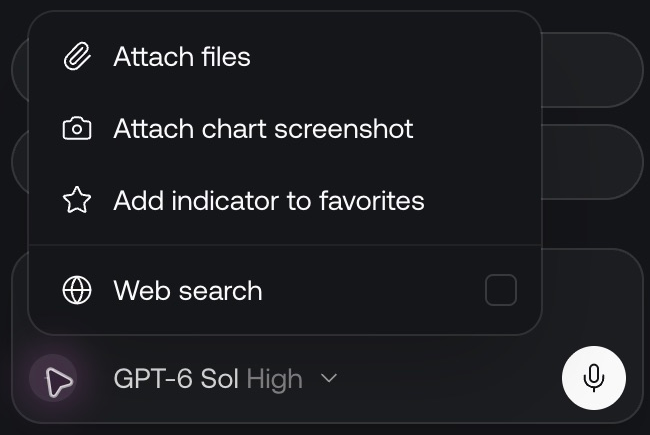
Ways to hand it one:
- Upload or paste into the chat, or Attach files from the +
- From a screenshot under the prompt on an empty chat, then pick the image
- Attach chart screenshot from the + — the whole active pane
To save an image for a post, presentation, or review, use Screenshots from the right-hand rail. That export workflow is separate from attaching an image to a Quant message.
Images also work as a target: instead of describing the visual result you want, show it. "Make it look like this" with a screenshot is often more precise than a paragraph of styling instructions.
From a region on the chart
When you only care about part of the pane — a pattern, a label, a stretch of candles — use Capture area for Quant on the left drawing toolbar, above Measure.
- Click the tool. The chart dims.
- Drag a rectangle around what you want Quant to see. Resize from the handles, or drag the box to move it.
- Type (or speak) in the prompt on the selection, then send. Quant gets the crop plus your message.
This is not a drawing: it does not save with the workspace and it does not sit in the Object tree. Exit capture, Escape, right-click the chart, or a click outside the box leaves the tool.
Use it to ask about markup already on the chart ("what is this ABCD"), or to point at the thing you want changed ("add a bgcolor to the ratio labels").
Writing good prompts
- Start simple. "An RSI oscillator with signals" is a better opening than a full specification. Get a working base, then refine.
- Say what done looks like. Pane vs overlay, colors, line styles, and how it should behave in a specific case (e.g. "when price gaps, the band should not reset").
- Build in small steps instead of asking for a full toolkit at once. Each request should add or change one thing.
- For something large, ask for a plan first. Have Quant propose the structure, agree on it, then implement step by step.
- After the first output, request one change per message. Batched change lists tend to get partially applied. Name the script you want to change when a chat contains several.
If the study depends on a specific market or timeframe to make sense, set the chart to it before iterating. Quant runs the script against the active chart's data, so you see realistic output while you refine.
When something breaks
Two kinds of errors can occur:
- Syntax errors: the script fails to compile and nothing plots.
- Runtime errors: the script compiles, but fails while running over history or on new bars. These appear as a message at the bottom of the chart.
Quant code repair is included with Premium, Ultimate, and AI Ultra. See Plans for feature access.
For either, Fix with Quant feeds the error back to Quant and asks it to repair the script. If a script runs but doesn't visibly plot, inspect Pine editor: the plot calls may be conditioned on something that never happens on this symbol or timeframe.