Panels
Open and manage the tools beside your charts from the right-hand panel rail.
The right-hand panel rail opens tools beside your charts. Click a tool’s icon to open it in place of whatever is open, so the chart keeps its width. Shift-click a tool to open it alongside the panels already open, and click an open tool to close it. The Object tree and Data window sit at the bottom of the rail. Your panel arrangement belongs to the workspace, while the content of account tools such as the Journal follows your account.
| Tool | Use it for |
|---|---|
| Watchlist | Follow symbols and open them on the chart. |
| Journal | Review your account’s trades and notes. |
| Pine editor | Inspect, edit, run, and save scripts. |
| Object tree | Find and manage drawings and indicators on the active chart. |
| Data window | Read plot values at the crosshair. |
| Tables | Read indicator tables and dashboards beside the chart. |
The Screenshot control is above these tools, and Chart settings is at the bottom of the rail. See Screenshots for image exports and Pine editor for the scripting workflow.
The Journal opens from the same rail, but its trades and notes belong to your account and are not included when you share a workspace.
Watchlist
The watchlist keeps the symbols you follow beside the chart. Use the docked view for quick access and the selected symbol's details, or Advanced view for performance, relationships, research, and exposure across the whole list.
Tables
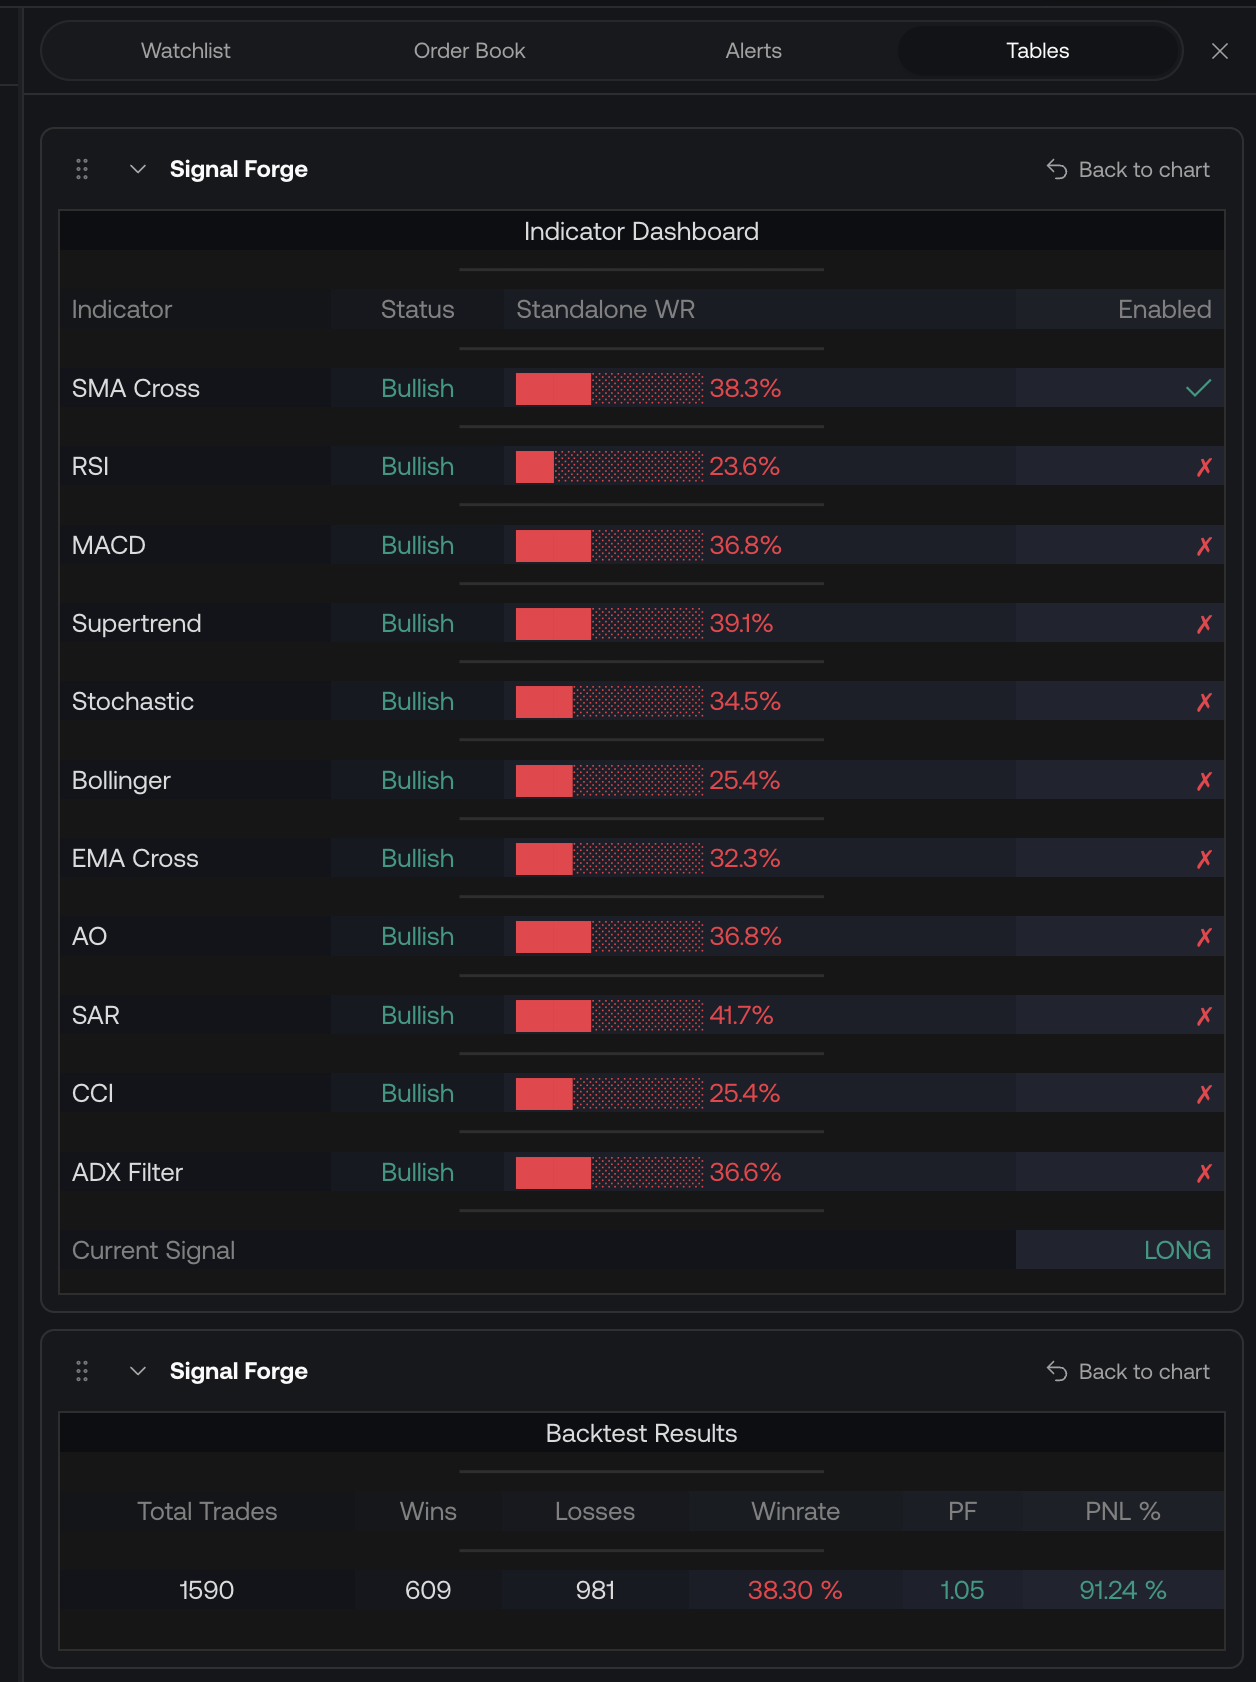
Move indicator tables and dashboards into the Tables panel to free up space on the chart. The panel gives them a dedicated, scrollable area beside the chart.
Move a table to the panel
- Right-click the table or dashboard on the chart.
- Select Move to panel.
- Open Tables from the right-hand rail to view it alongside the chart.
Bring it back to the chart
Click Back to chart in the table's header in the Tables panel. The table returns to the chart and leaves the panel.
Detached-table notice
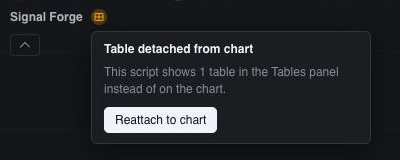
When a table is in the panel, a table icon appears beside the indicator's name on the chart. Click it to open the Table detached from chart notice. It shows how many tables from that script are in the Tables panel and offers Reattach to chart as another way to bring them back.