
Indicators
Add indicators from Basic, Order flow, the LuxAlgo Library, or My scripts, read what each one does, star favorites, and save templates.
Indicators apply to the active chart. In a multi-chart layout, click the cell you want before adding one.
Open the picker
Click Indicators in the chart topbar. Press / to jump to the search field.
Find the study
Search by name, concept, or alias, or browse the sections on the left: Basic, Order flow, the LuxAlgo Library, and My scripts.
Check it, then add it
Click a row to see what the indicator does in the panel on the right, then click Add to chart. Depending on the study it renders either as an overlay on the price candles or in its own pane below. If the price pane is maximized, or the indicator's pane is collapsed, adding it brings that pane back into view.
What's in the picker
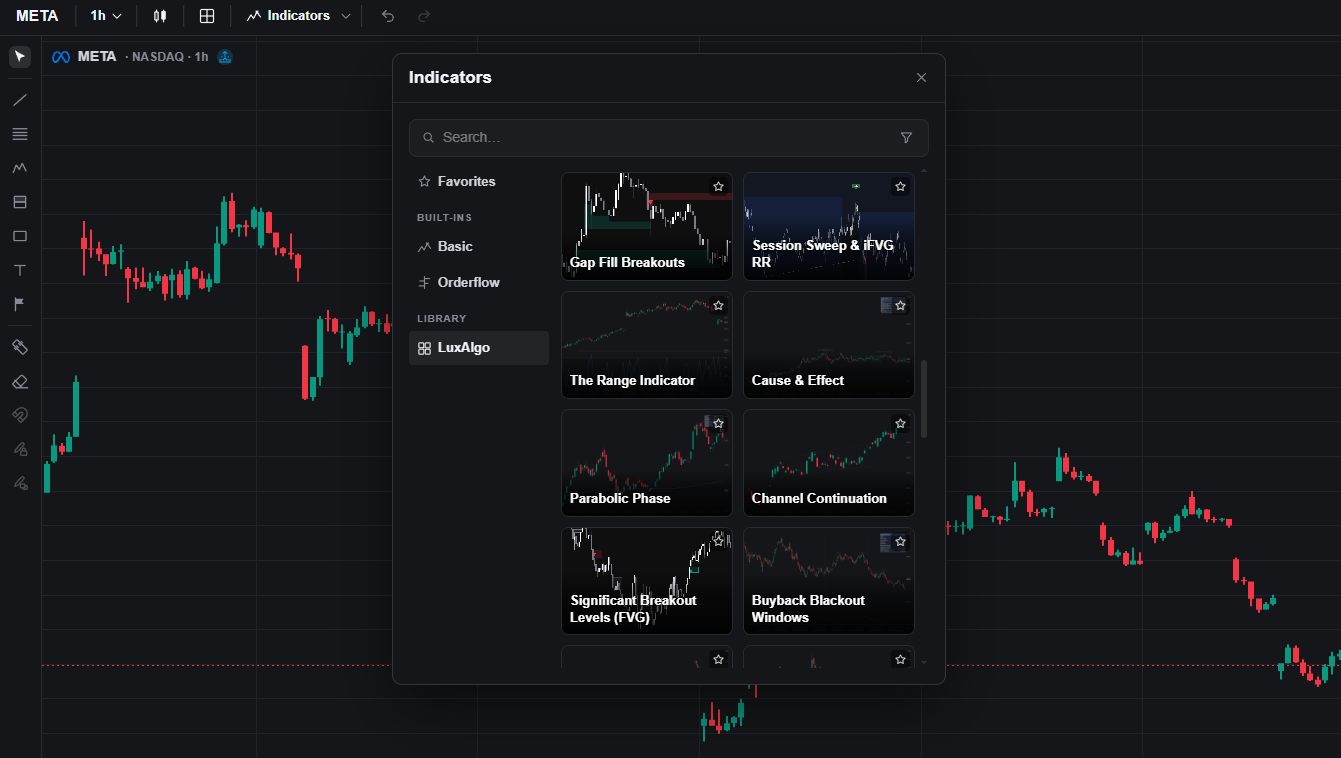
The sidebar is grouped by source:
- Yours: Favorites, the studies you have starred, and My scripts, covered below.
- Built-in: Basic holds standard studies such as RSI, MACD, Bollinger Bands, and moving averages, grouped by type. Order flow holds the native order-flow tools built on footprint data: volume delta, volume profiles, trade count, and more. These have their own documentation (see Order Flow), and most of them need a symbol whose venue provides footprint data (see Data).
- Library: Discover, All scripts, and Concepts for the LuxAlgo Library.
- Families: the Library by family, such as Trend, Momentum, Volatility, SMC / ICT, Wyckoff, Patterns, and Machine Learning, each with its script count.
Volume can also plot as a native pane, separate from the indicator system.
Indicator details
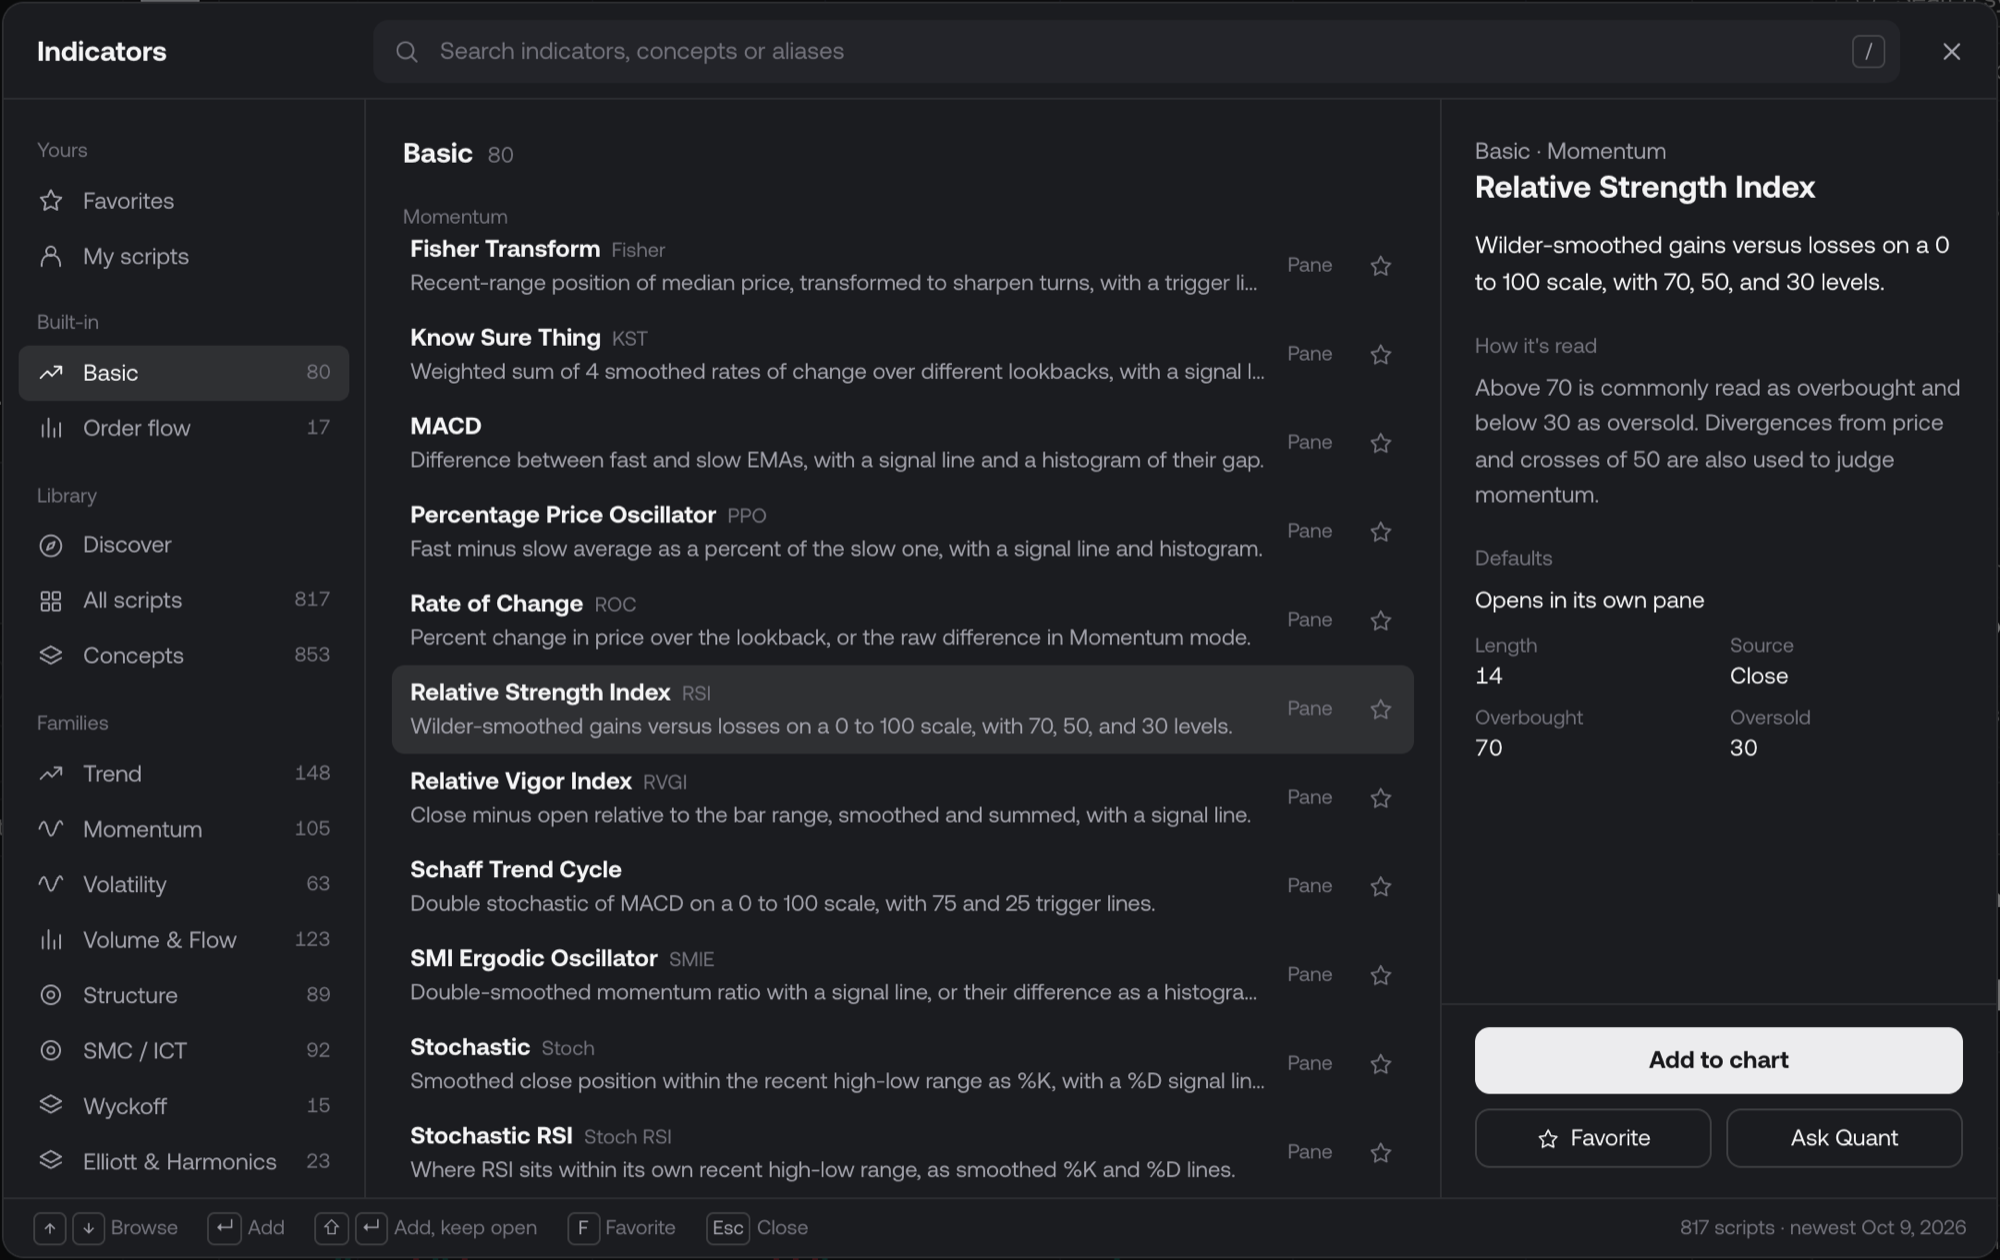
Click any row to open its details on the right.
Built-in studies are described in plain words: what the indicator measures, How it's read, and its Defaults, including whether it plots on the price chart or opens in its own pane and its main settings (for example, RSI's length, source, and overbought and oversold levels). An order-flow tool that the current market can't draw says so, so you can switch to a supported symbol before adding it.
Library scripts show a chart preview, the family and release date, a description, their tags, and View in the Library, which opens the script's page on luxalgo.com.
Every detail panel has the same actions:
- Add to chart adds it to the active chart and closes the picker.
- Favorite stars it.
- Ask Quant closes the picker and puts a question about the indicator in the Quant prompt, ready for you to edit or send.
Search
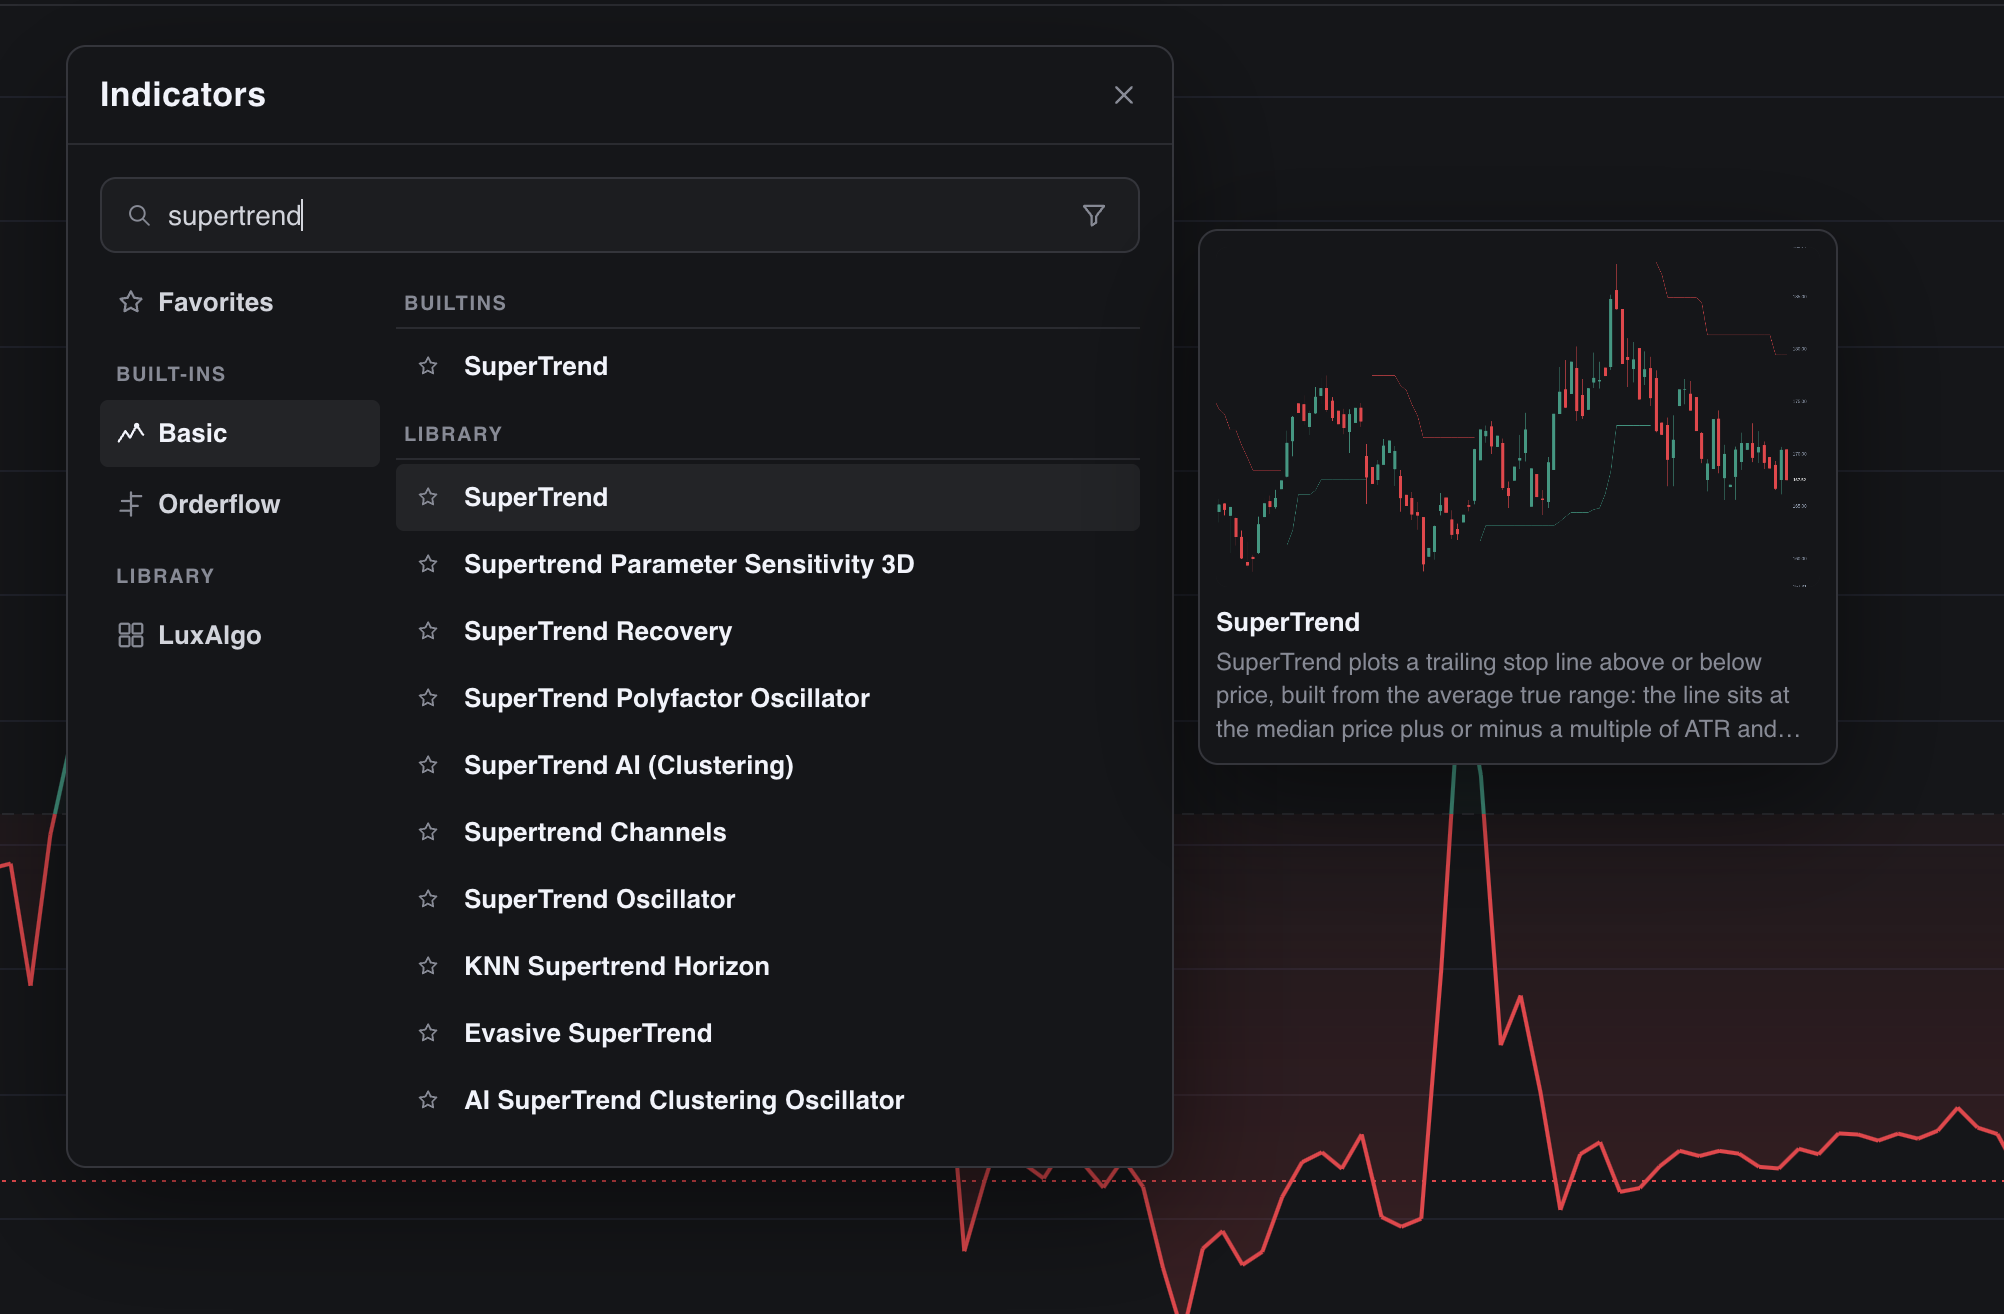
Type in Search indicators, concepts or aliases to search everything at once. Results are grouped into Built-in, Library, and Concepts. A Library script also matches when it implements a concept you typed, so searching an idea such as "order block" finds the scripts built on it, each with a thumbnail, its family, and its date. The first result is selected, so Enter adds the top match.
Keyboard
| Key | Action |
|---|---|
↑ / ↓ | Browse the list |
Enter | Add the selected indicator |
Shift + Enter | Add it and keep the picker open, to add several in a row |
F | Favorite the selected indicator |
/ | Jump to search |
Esc | Close the picker |
Favorites
Star any indicator you reach for often. The same set shows under Favorites in the picker and in a chevron next to Indicators in the topbar. The chevron adds one back onto the chart without opening the full picker.
You can star from four places:
- The star on each row in the picker
- Favorite in the detail panel, or
Fon the selected row - A star on the legend of anything already on the chart, with the row's other controls
- More actions → Add to favorites in the Pine editor for the script you are editing
Click a star again to remove it. Starred Library and Quant scripts keep their source, so they can be added again from Favorites after a reload. Favorites follow your account.
My scripts
Open Indicators → My scripts to find scripts you created using Quant alongside scripts you saved from the Pine editor. They are listed by name. Select one and click Add to chart to add it to the active chart. Sign in to see your scripts.
To keep code you write or paste yourself, open the Pine editor, then use Save or Ctrl+S / ⌘S. Saving a script is separate from running it on the chart and from starring it as a favorite.
A Quant chat can create and manage multiple scripts, so use this list when you want a specific one. The chat's Add to chart action selects the latest script created during that session, rather than the latest edited script. See Keep it on the workspace.
LuxAlgo Library
The LuxAlgo Library is the encyclopedia of trading and technical analysis. Years of in-house implementations of every trading concept in the history of the craft, built to display automatically on your charts: trend, momentum, volatility, structure, SMC/ICT, Wyckoff, Elliott, patterns, machine learning, and more. Hundreds of studies, written by the same team, ready to plot.
It is natively built into the picker. Open Indicators, pick a Library section, and add a study the same way you add RSI. No import, no script paste, no extra account.
- Discover leads with New releases (See all lists every new script), then More to explore, a rotating set of picks (Shuffle draws new ones), and a card for every family.
- All scripts lists the whole Library. Sort by Newest or A–Z, and switch between a grid of preview cards and a list.
- Concepts lists the trading ideas the Library implements, such as order blocks, fair value gaps, or RSI divergence, with their other names. Select a concept to read what it is and Browse the scripts that implement it.
- A family in the sidebar shows only its scripts, with chips that narrow it to one part of the family.
You can also ask Quant, our coding agent, to add Library scripts directly from chat. Every Library indicator can be customized on the spot with Quant. Ask for the change you want (colors, signals, extra conditions, a different overlay) and Quant rewrites the code on the active chart.
If none of these are what you need, Quant can also generate a custom study from a description or a screenshot. Quant scripts plot on the active chart and are marked in the legend so you can tell them apart from picker studies. Scripts Quant creates and edits belong to the workspace until removed, with no separate commit step. Find Quant-created scripts under My scripts in the picker.
Every plan, including Free, has unlimited tools per chart, subject to fair-use performance limits. Free includes the Library's free indicators; Essential, Premium, Ultimate, and AI Ultra include the full Library.
Read a free indicator’s source
Free indicators on luxalgo.com/library include their Pine Script® source and a Copy code button. Open the indicator’s Library page to inspect or copy it. To work with that code in Vela, paste it into the Pine editor, review it, and run it on your chart.
Templates
An indicator template is a saved snapshot of everything on a chart: every Basic, Order flow, Library, and Quant script indicator, with the exact settings each one had when you saved. Templates belong to your account, not to a workspace, so a setup built in one workspace can be loaded in any other.
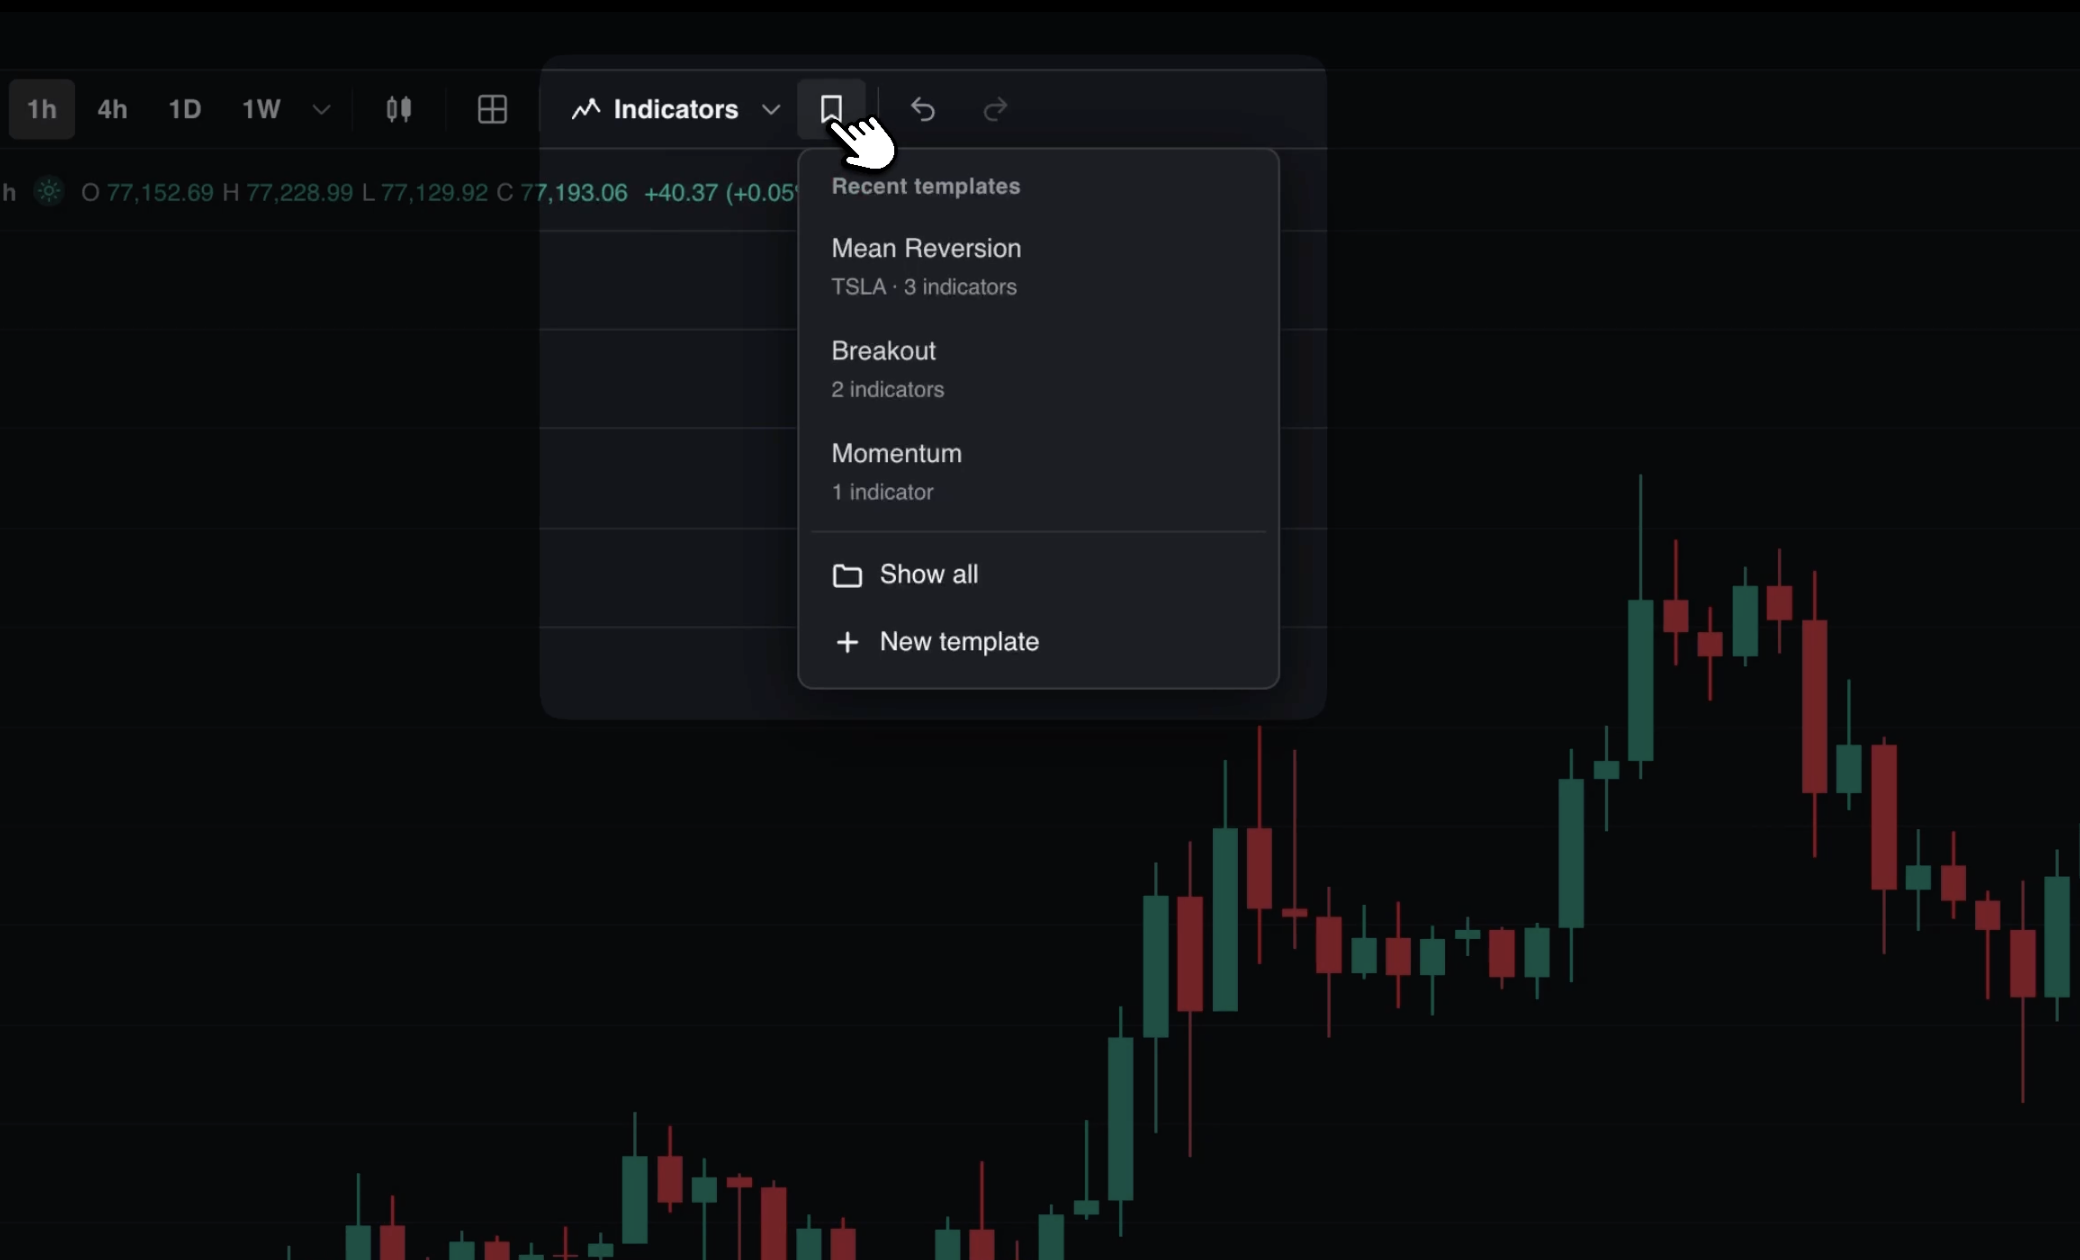
Open them from the Indicator Templates button (the bookmark icon) in the chart topbar, right next to Indicators. On mobile, the same entry lives in the three-dots drawer of the bottom bar.
Save a template
Set up the chart
Add and configure the indicators you want to keep on the active chart. The template captures the chart as it is when you save.
Choose New template
Click Indicator Templates, then New template. The list of indicators the template will carry is shown so you can check it before saving.
Name it and save
Type a name, or leave it blank for New template. Saving under a name you already use asks whether to replace the existing template.
Under Chart, two optional chips link the current symbol and timeframe to the template. Both are off by default: a template is an indicator set first, and the market is opt-in. When a chip is on, loading the template also switches the chart to that symbol or timeframe.
Load a template
The dropdown lists your five most recently updated templates; click one to load it. Show all opens the full list, where each row also has Rename and Delete.
Loading a template replaces the indicators on the chart. It does not stack on top of what is already there. In a multi-chart layout you are asked where to apply it:
- Apply to selected chart replaces the indicators on the active chart only.
- Apply to all charts replaces the indicators on every chart in the layout.
Settings are restored exactly as saved. If an indicator's defaults change later, a template keeps the values you saved with it.
Every plan, including Free, has unlimited indicator templates.
Configure
Each indicator has its own settings: lengths, sources, colors, visibility of individual plots. Open them from the gear on the chart legend next to the indicator's name, or through the Object tree.
The Data window in the right-hand panel rail shows the exact value of every plot under the crosshair, which is useful when several studies overlap and you can't tell which line is which.
Remove and manage
- Toggle an indicator off in the Indicators picker, or remove it from the Object tree.
- The Object tree can also hide an indicator without removing it, lock it, duplicate it (handy for running the same study with two different settings), and reorder what draws on top.
- Right-click the chart and choose Remove indicators to clear all of them at once.