
Performance
Read the overall results and see when and where the strategy made or lost money.
Open the Backtest viewer, then select Performance. This tab brings together the profit curve, headline results, daily and weekday charts, and a detailed performance table.
The symbol, timeframe, strategy name, and date range at the top identify the backtest being reviewed. Keep these consistent when comparing results with another run.
Screenshots show an example BTCUSD backtest. Values depend on the strategy, data, and settings. Select an image to view it at full size.
Profit curve and summary
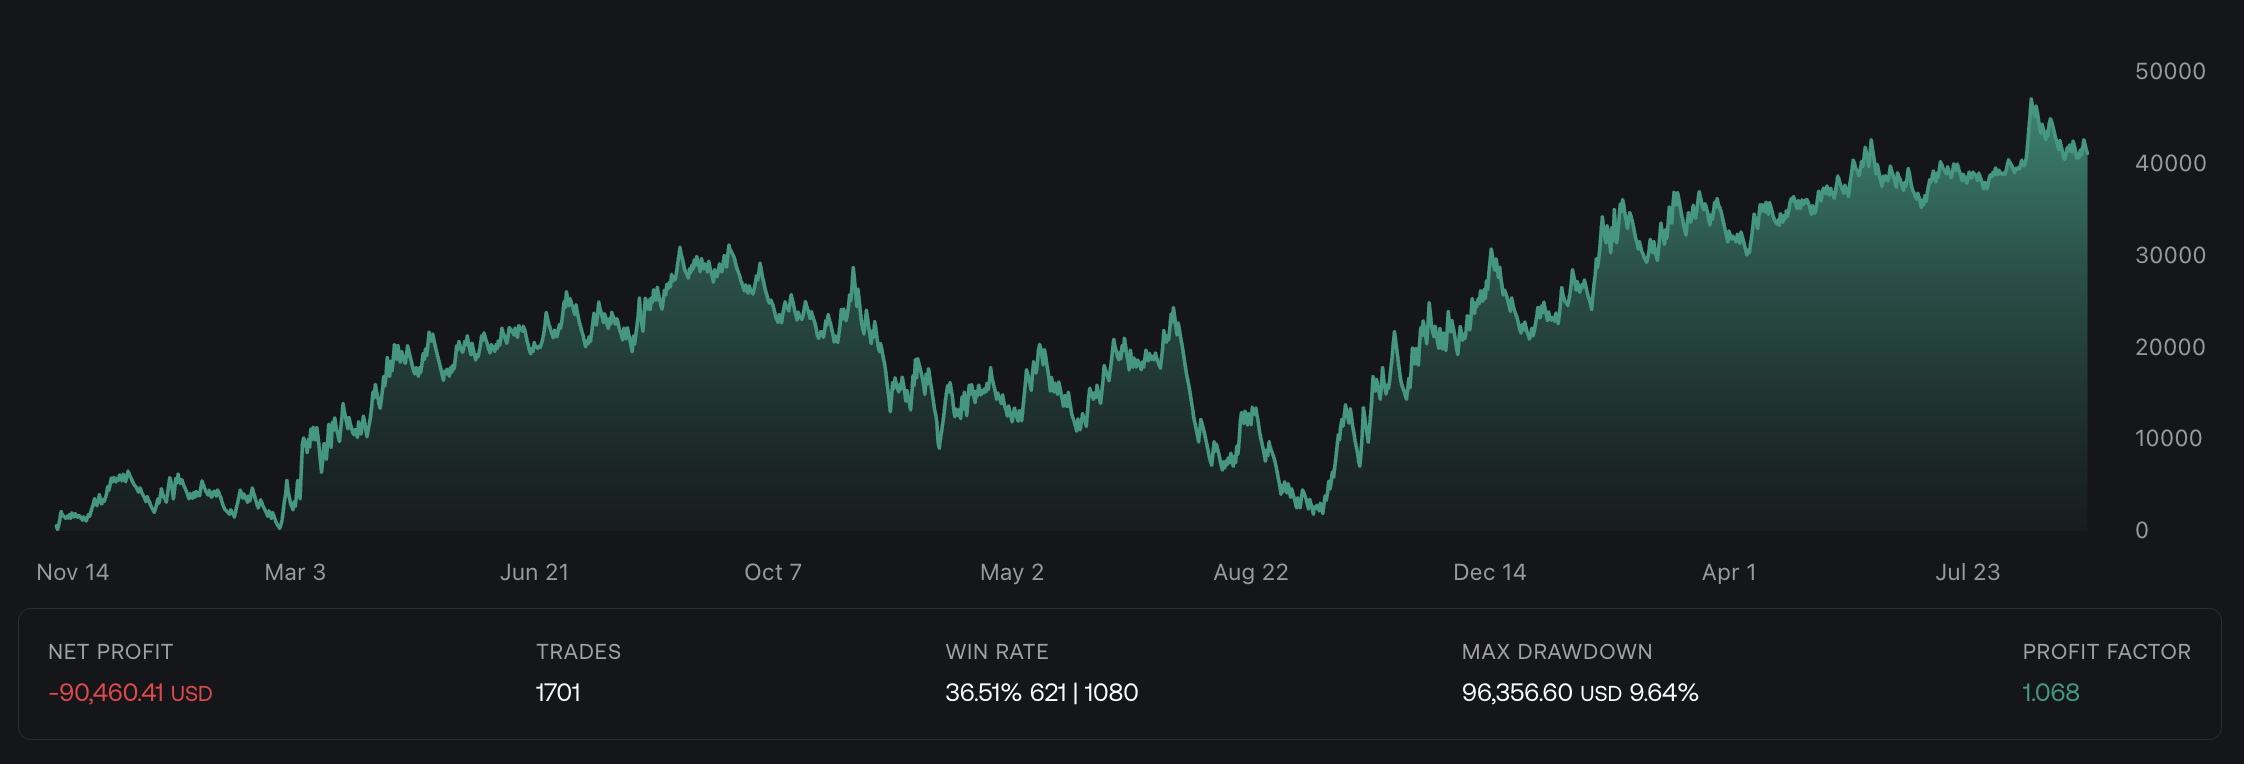
Read the curve from left to right through the date range. Rising sections show improving cumulative P&L, while falling sections show losses relative to an earlier point. Green and red shading distinguish values above and below zero. A decline can still be a drawdown while the curve remains above zero.
| Metric | Meaning |
|---|---|
| Net Profit | The overall profit or loss reported for the backtest. Read it alongside the strategy's commission and slippage settings. |
| Trades | Number of closed trades in the backtest. A result based on a few trades provides less evidence than one observed repeatedly. |
| Win Rate | Percentage of closed trades that won. The counts beside it show winning and losing trades. |
| Max Drawdown | Largest decline from an equity peak to a later low, displayed as an amount and percentage. This is different from the final loss. |
| Profit Factor | Gross profit divided by gross loss. A value of 1 means the two are equal; 1.5 means $1.50 of gross profit for each $1 of gross loss. |
Win rate and profit factor answer different questions. For example, four $200 wins and six $100 losses give a 40% win rate and a profit factor of about 1.33, before any additional costs. A high win rate alone does not establish profitability.
Daily and weekday results
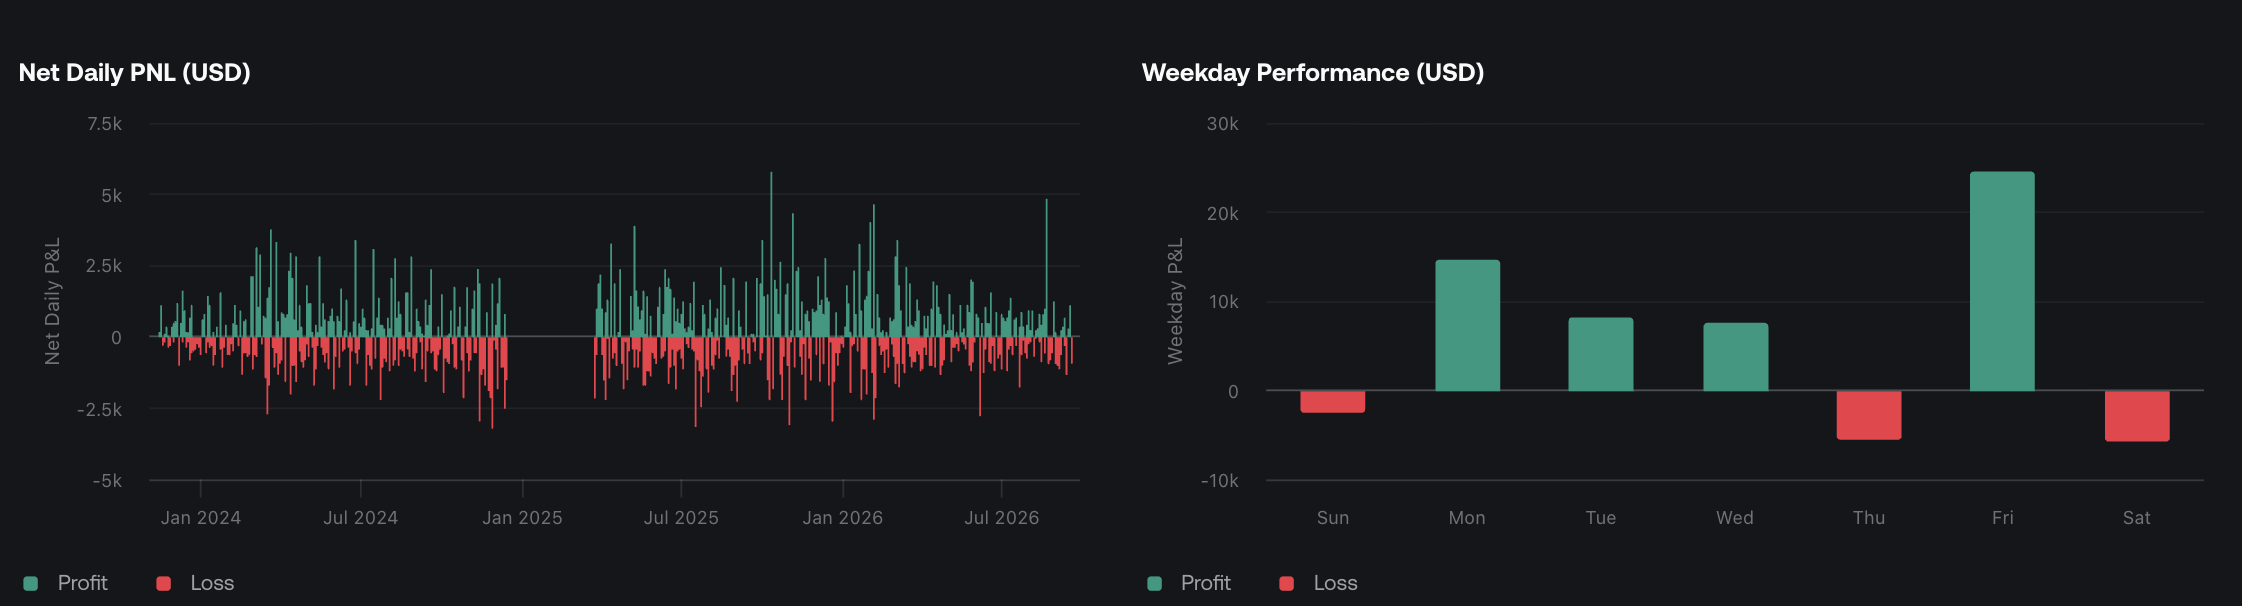
Net Daily PNL (USD) shows results across the backtest's dates. Bars above zero are profitable days and bars below zero are losing days. This view helps reveal whether the result is spread across the period or concentrated in a few unusually large days.
Weekday Performance (USD) groups results from Sunday through Saturday. A positive Tuesday bar describes the combined Tuesday result in this backtest; it does not mean every Tuesday was profitable. Use Trades Log's calendar to inspect individual dates.
Performance table
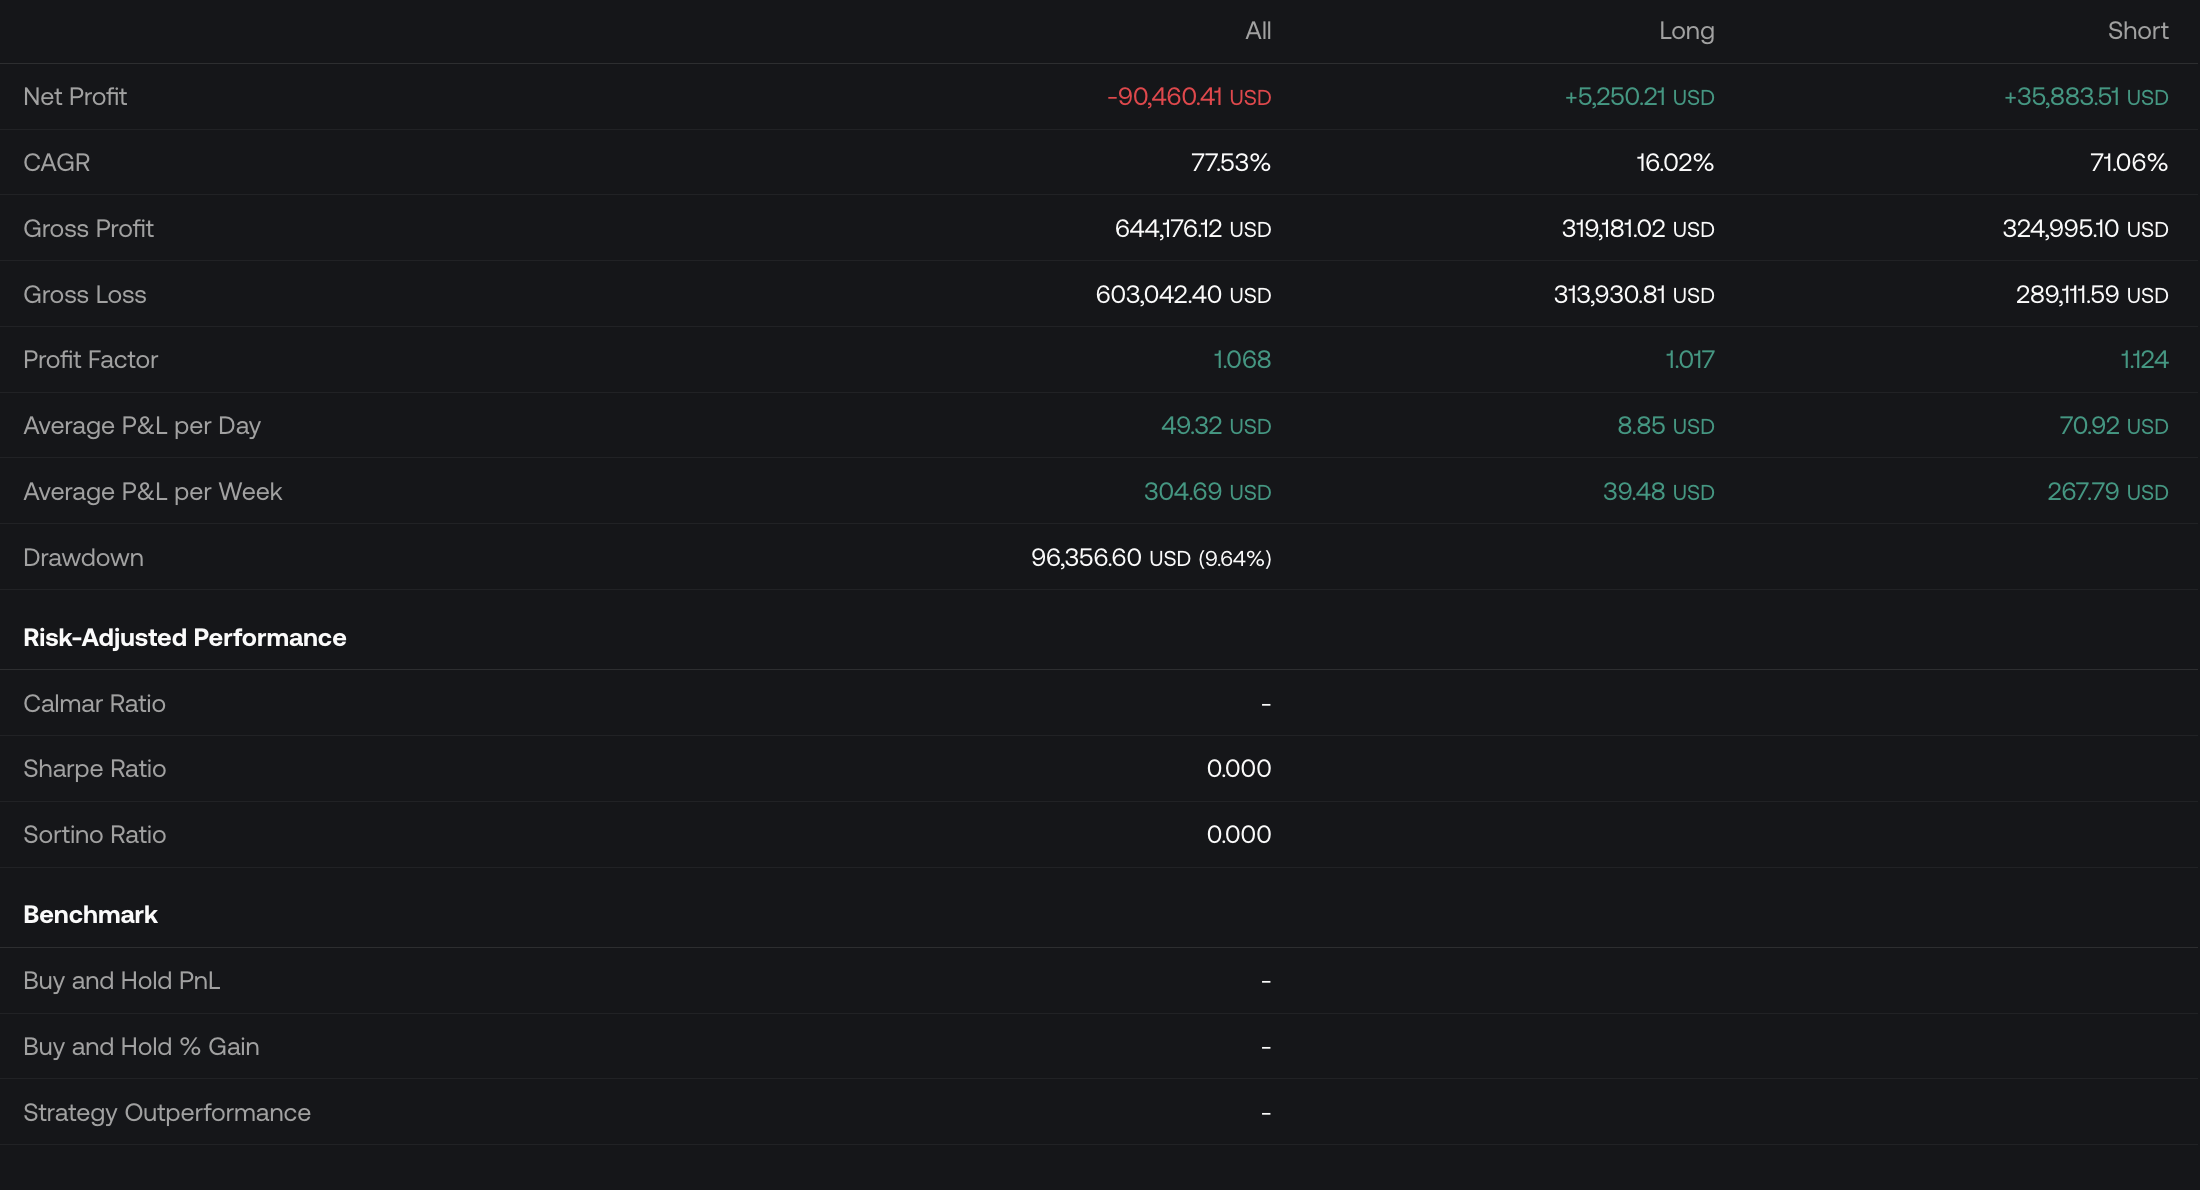
The All, Long, and Short columns separate the combined backtest from each direction. This helps identify whether the strategy's strengths and weaknesses are shared by both sides.
| Row | How to read it |
|---|---|
| Net Profit | Reported profit or loss for that column. |
| CAGR | Compound annual growth rate: growth expressed as an annualized rate. It is not the raw percentage change over the displayed date range. |
| Gross Profit | Total profit from winning trades. |
| Gross Loss | Total loss from losing trades, displayed as a loss amount. |
| Profit Factor | Gross profit relative to gross loss. |
| Average P&L per Day / Week | Average result at the stated time interval. It does not mean every day or week produced that amount. |
| Drawdown | The backtest's peak-to-trough decline, shown in currency and percentage terms. |
The headline total, chart, and trade-level breakdowns can show different P&L totals. Do not assume a trade-level sum includes every cost reflected in the headline result. Check the strategy properties when comparing runs. The Simulation tab uses closed-trade P&L before commission for the trade outcomes it replays. Its drawdown calculations also include unrealized P&L, reflecting changes in open positions.
Risk-adjusted performance
These rows put returns in the context of variability or drawdown:
| Metric | What it describes |
|---|---|
| Calmar Ratio | Return relative to maximum drawdown. |
| Sharpe Ratio | Return relative to overall return variability. |
| Sortino Ratio | Return relative to downside variability. |
They emphasize different aspects of risk, so they are not interchangeable. Compare like-for-like backtests and settings. A dash means no value is displayed; it should not be read as zero.
Benchmark
Buy and Hold PnL and Buy and Hold % Gain provide a passive holding comparison when values are available. Strategy Outperformance shows the strategy's comparison with that benchmark. These rows help distinguish the strategy's result from the benefit or cost of simply holding the market over the period.
For the individual trades behind these results, continue to Trades Analysis or Trades Log.