
Simulation
Replay your backtest's trades to explore different outcomes and drawdowns.
Open the Backtest viewer, then choose Simulation. Simulation replays the backtest's closed trades many times to explore how results change when trades repeat or arrive in a different order. Each replay is one run, or trial.
Drawdown calculations include unrealized P&L, reflecting changes in profit and loss while positions are still open. A trade can finish profitable while experiencing a drawdown before it closes.
It helps answer questions such as: “How much worse could the drawdown look with a different sequence?” and “How often do these replays finish profitable?”
Simulation's trade outcomes use closed-trade P&L before commission, as noted below the simulation results, even where charts use the label “net profit.” This describes the trade outcomes being replayed; drawdown also accounts for unrealized P&L while positions are open. Simulation replays observed trades to explore repeatability and sequencing risk. It does not generate new market regimes or establish what will happen in live trading.
Screenshots show an example BTCUSD backtest. Results vary with the trade history and settings. Select an image to view it at full size.
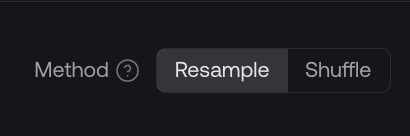
Resample or Shuffle
| Method | What happens | What you learn |
|---|---|---|
| Resample | Randomly selects existing trade results with replacement: a trade can appear more than once, while another may not appear. | How outcomes vary when the observed mix of trades changes. |
| Shuffle | Reorders the same trades. | How trade order affects the path, drawdowns, and streaks. |
For example, start with three trades: +$100, −$50, +$200. A resample could select +$100, +$100, −$50, ending at +$150. A shuffle could produce −$50, +$200, +$100, still ending at +$250.
With Random P&L variation set to zero, every Shuffle run has the same ending total. The journey to that total can still differ substantially. With variation enabled, trade amounts can change, so do not assume identical ending totals.
Settings
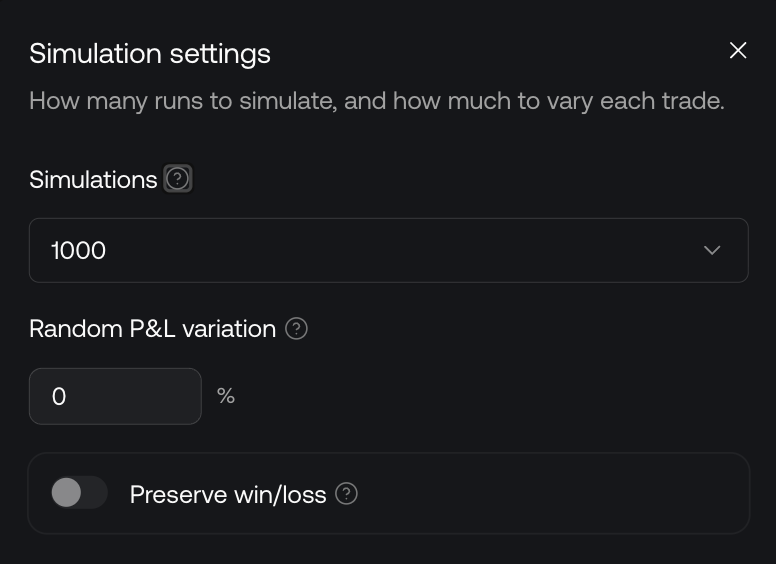
Simulations is the number of trials to run. For example, 1,000 means 1,000 replays of the trade history, not 1,000 trades. Increasing it to 2,500 generally makes estimates less sensitive to random sampling, but does not fix assumptions or add evidence about unseen market conditions.
Random P&L variation changes a trade's outcome each time it occurs in a replay. Zero leaves its original amount unchanged. The tooltip describes approximate variation; it does not specify a precise probability distribution or hard upper and lower bounds. Do not read the setting as a guaranteed ±percentage range, or as a specific model of slippage or fills.
Preserve win/loss is intended to retain whether a trade is a winner or loser when variation is applied. It does not lock the trade's amount. The setting's label does not specify how zero outcomes or other edge cases are handled.
Drawdown and thresholds
A drawdown is a decline from an equity peak to a later low. If equity rises to $12,000, falls to $9,000, then recovers, that decline is $3,000. It is not the run's ending loss.
Simulation includes unrealized P&L when calculating drawdown, so changes in open positions contribute to the decline. Drawdown is not limited to losses recorded when trades close.
Actual max drawdown is the largest peak-to-trough decline in the original backtest. “Actual” refers to the original backtest, not live trading. Use it as the reference for the simulated drawdowns and thresholds. When comparing with Performance, check the backtest and settings; including unrealized P&L does not by itself establish that every figure in the two tabs is interchangeable.
USD and percentage units
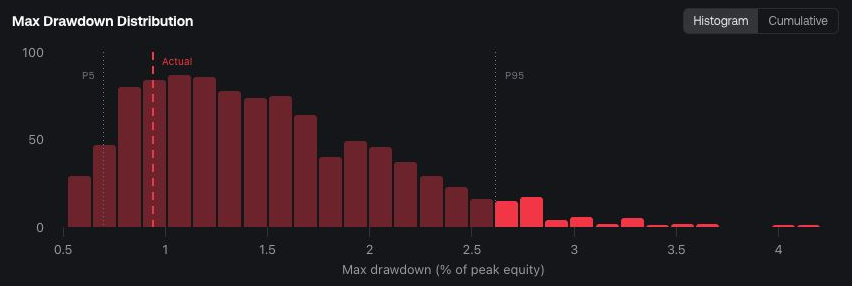
USD expresses the decline as a dollar amount. The percentage drawdown axis is labeled Max drawdown (% of peak equity): the decline is measured relative to the relevant equity peak, not simply starting capital.
In the $12,000-to-$9,000 example, drawdown is $3,000, or 25% of the $12,000 peak. Keep the selected unit in mind when reading thresholds and distributions.
1.5× DD, 2× DD, 3× DD, and custom values

These controls choose a threshold relative to the original maximum drawdown. If the original drawdown is $1,000, 1.5× DD sets a $1,500 threshold, 2× DD sets $2,000, and a custom multiplier of 3.1 sets $3,100.
The multiplier changes the level being measured. It does not change position sizing or multiply trade losses.
P(drawdown ≥ threshold) is the share of simulated runs whose maximum drawdown reaches or exceeds that level. If 200 of 1,000 runs reach a $2,000 threshold, the reported probability is 20%.
When using percentage units, two percentages can appear: one describes the drawdown threshold, and the other the share of runs crossing it. A 4% drawdown threshold with a 20% probability means one fifth of runs reached at least that drawdown; it does not mean the threshold is 20%.
Summary metrics

| Metric | How to read it |
|---|---|
| Probability of profit | Share of whole runs ending above zero. If 600 of 1,000 runs finish positive, this is 60%. It is not the percentage of individual winning trades. |
| Final net profit (every run) | The common ending P&L in Shuffle when variation is zero. Different paths can still lead to this same total. Remember the before-commission basis. |
| Median outcome | The middle ending P&L when runs are ordered from lowest to highest. Roughly half finish below it and half above it. |
| Risk of ruin | Share of runs losing all starting capital, as defined by the page tooltip. This is separate from crossing your chosen drawdown threshold. A reported zero does not prove there is no real-world risk. |
| P95 / P99 drawdown | The 95th / 99th percentile of runs' maximum drawdowns, including unrealized P&L. Roughly 95% / 99% are at or below that value; the remaining tail can be worse. These are not guaranteed limits. |
| P95 losing streak | The 95th percentile of each run's longest consecutive losing streak. A value of 8 means roughly 95% of runs have a longest losing streak of 8 trades or fewer. |
Read the charts
Simulated Net Profit Paths
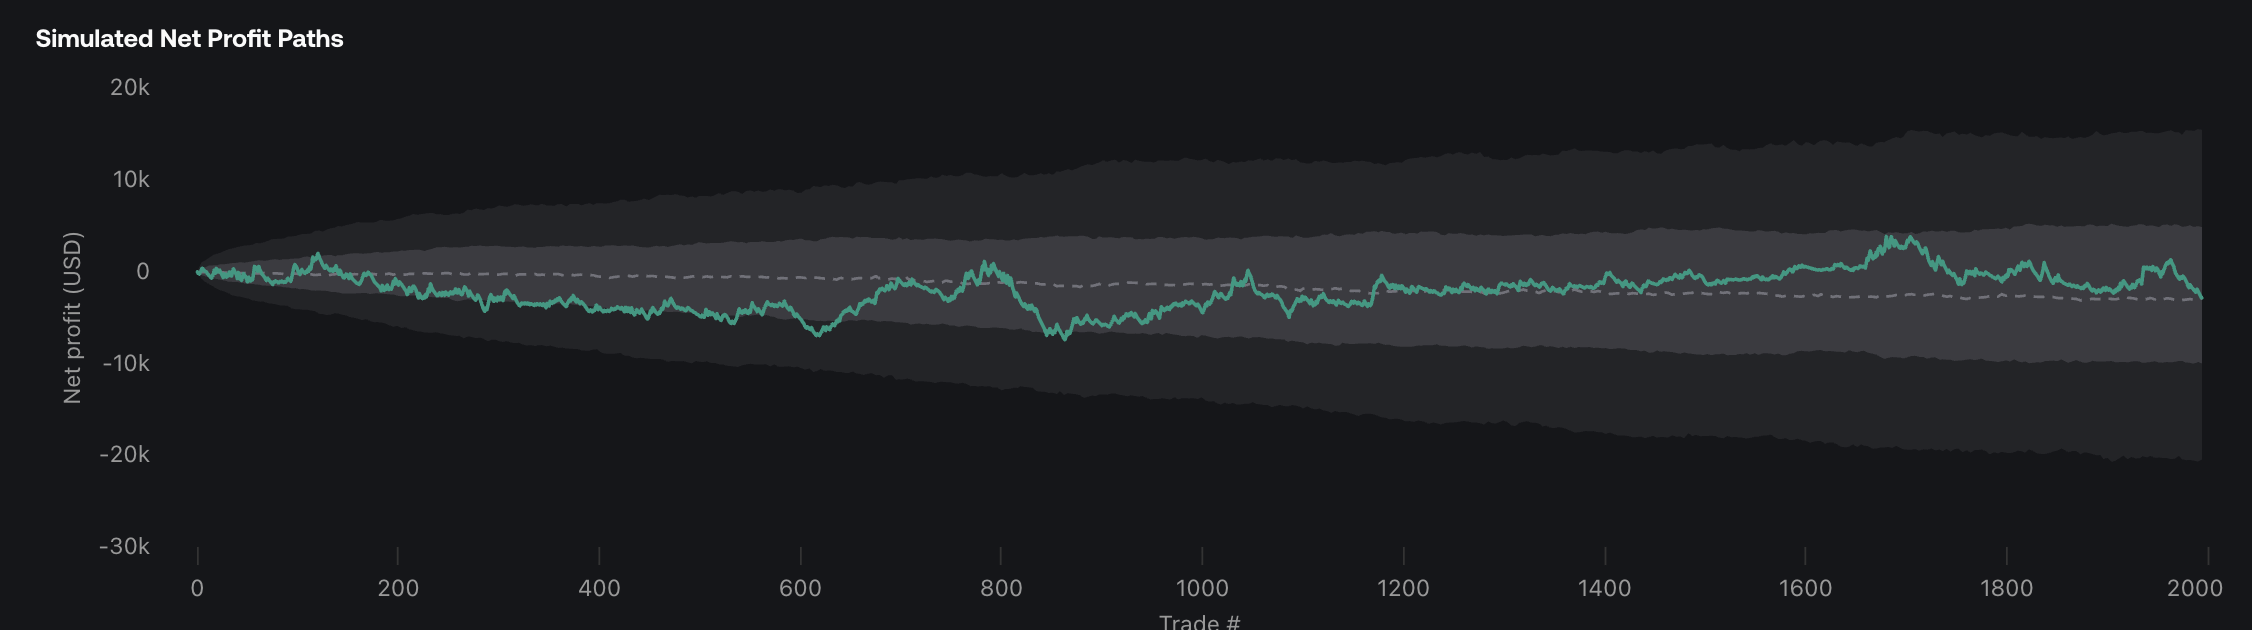
The actual line follows the original backtest sequence. The median line shows the middle simulated result at each point in the replay.
The 25–75% band contains the middle half of simulated values at each point; the wider 5–95% band contains the middle 90%. These are point-by-point ranges, not a promise that a particular run stays inside a band for its entire path. The median line need not represent one individual run.
Outcome Distribution
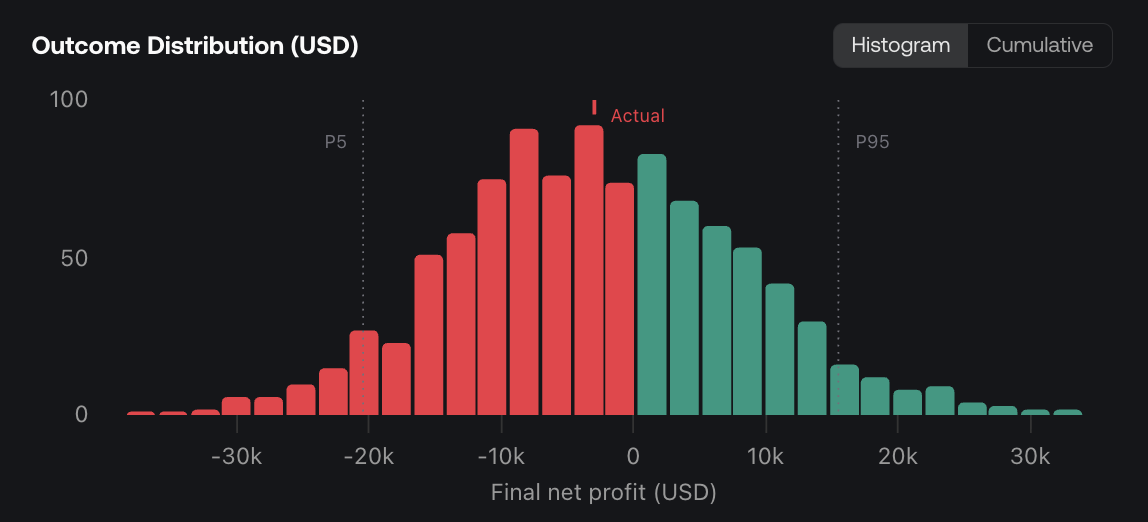
The histogram groups runs by their ending P&L. A bar over the $0–$500 bucket shows how many runs finished in that range.
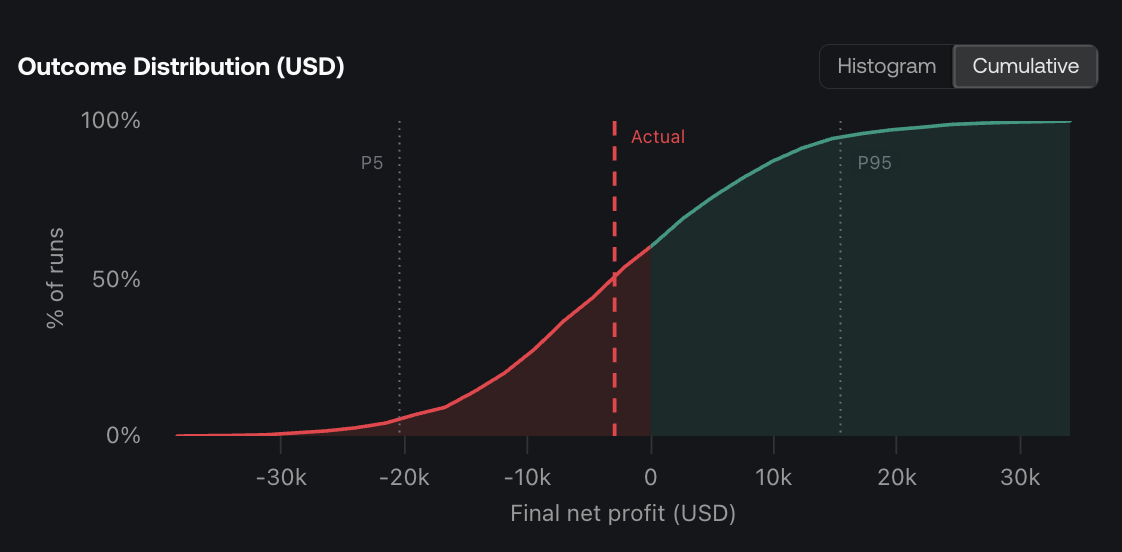
The cumulative view shows the share of runs ending at or below a given amount. For example, 70% at $500 means 70% ended at $500 or less, including any losing runs.
Max Drawdown Distribution
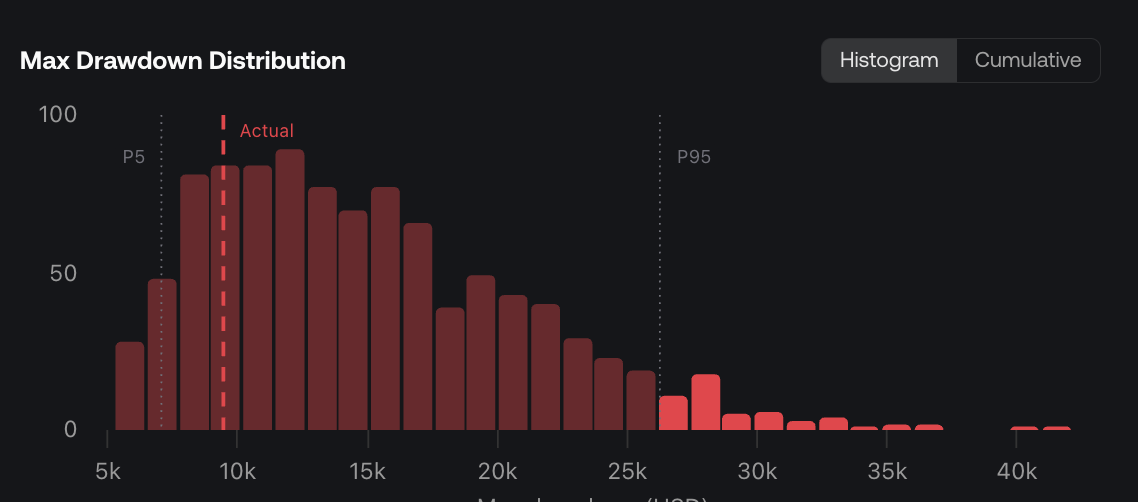
This groups each run by its worst peak-to-trough decline, including changes in unrealized P&L while positions are open, not its ending loss. A run can finish profitable and still contribute a large drawdown to this chart.
Switch to Cumulative to read the share of runs whose maximum drawdown is at or below a given amount. For example, 90% at $10,000 means 90% of runs had a maximum drawdown of $10,000 or less. The summary probability P(drawdown ≥ threshold) instead measures runs that reach or exceed the selected threshold.
Check whether the axis is in USD or percentage units before comparing the distribution with a selected threshold.
Streaks & Recovery

Longest losing streak counts the greatest number of consecutive losing trades in a run.
Max DD duration counts trades from the equity peak before the deepest drawdown to its trough. Recovery counts trades from that trough back to the prior peak. For example, if the peak occurs after trade 10, the trough after trade 15, and the prior peak is regained after trade 23, the decline takes 5 trades and recovery takes 8.