
Strategies
Run strategy scripts on the chart and review the backtest overlay.
A strategy script plots on the active chart and shows its trades and performance on that same chart. This page is about reading a strategy that is already there. To have Quant write one, see Making strategies.
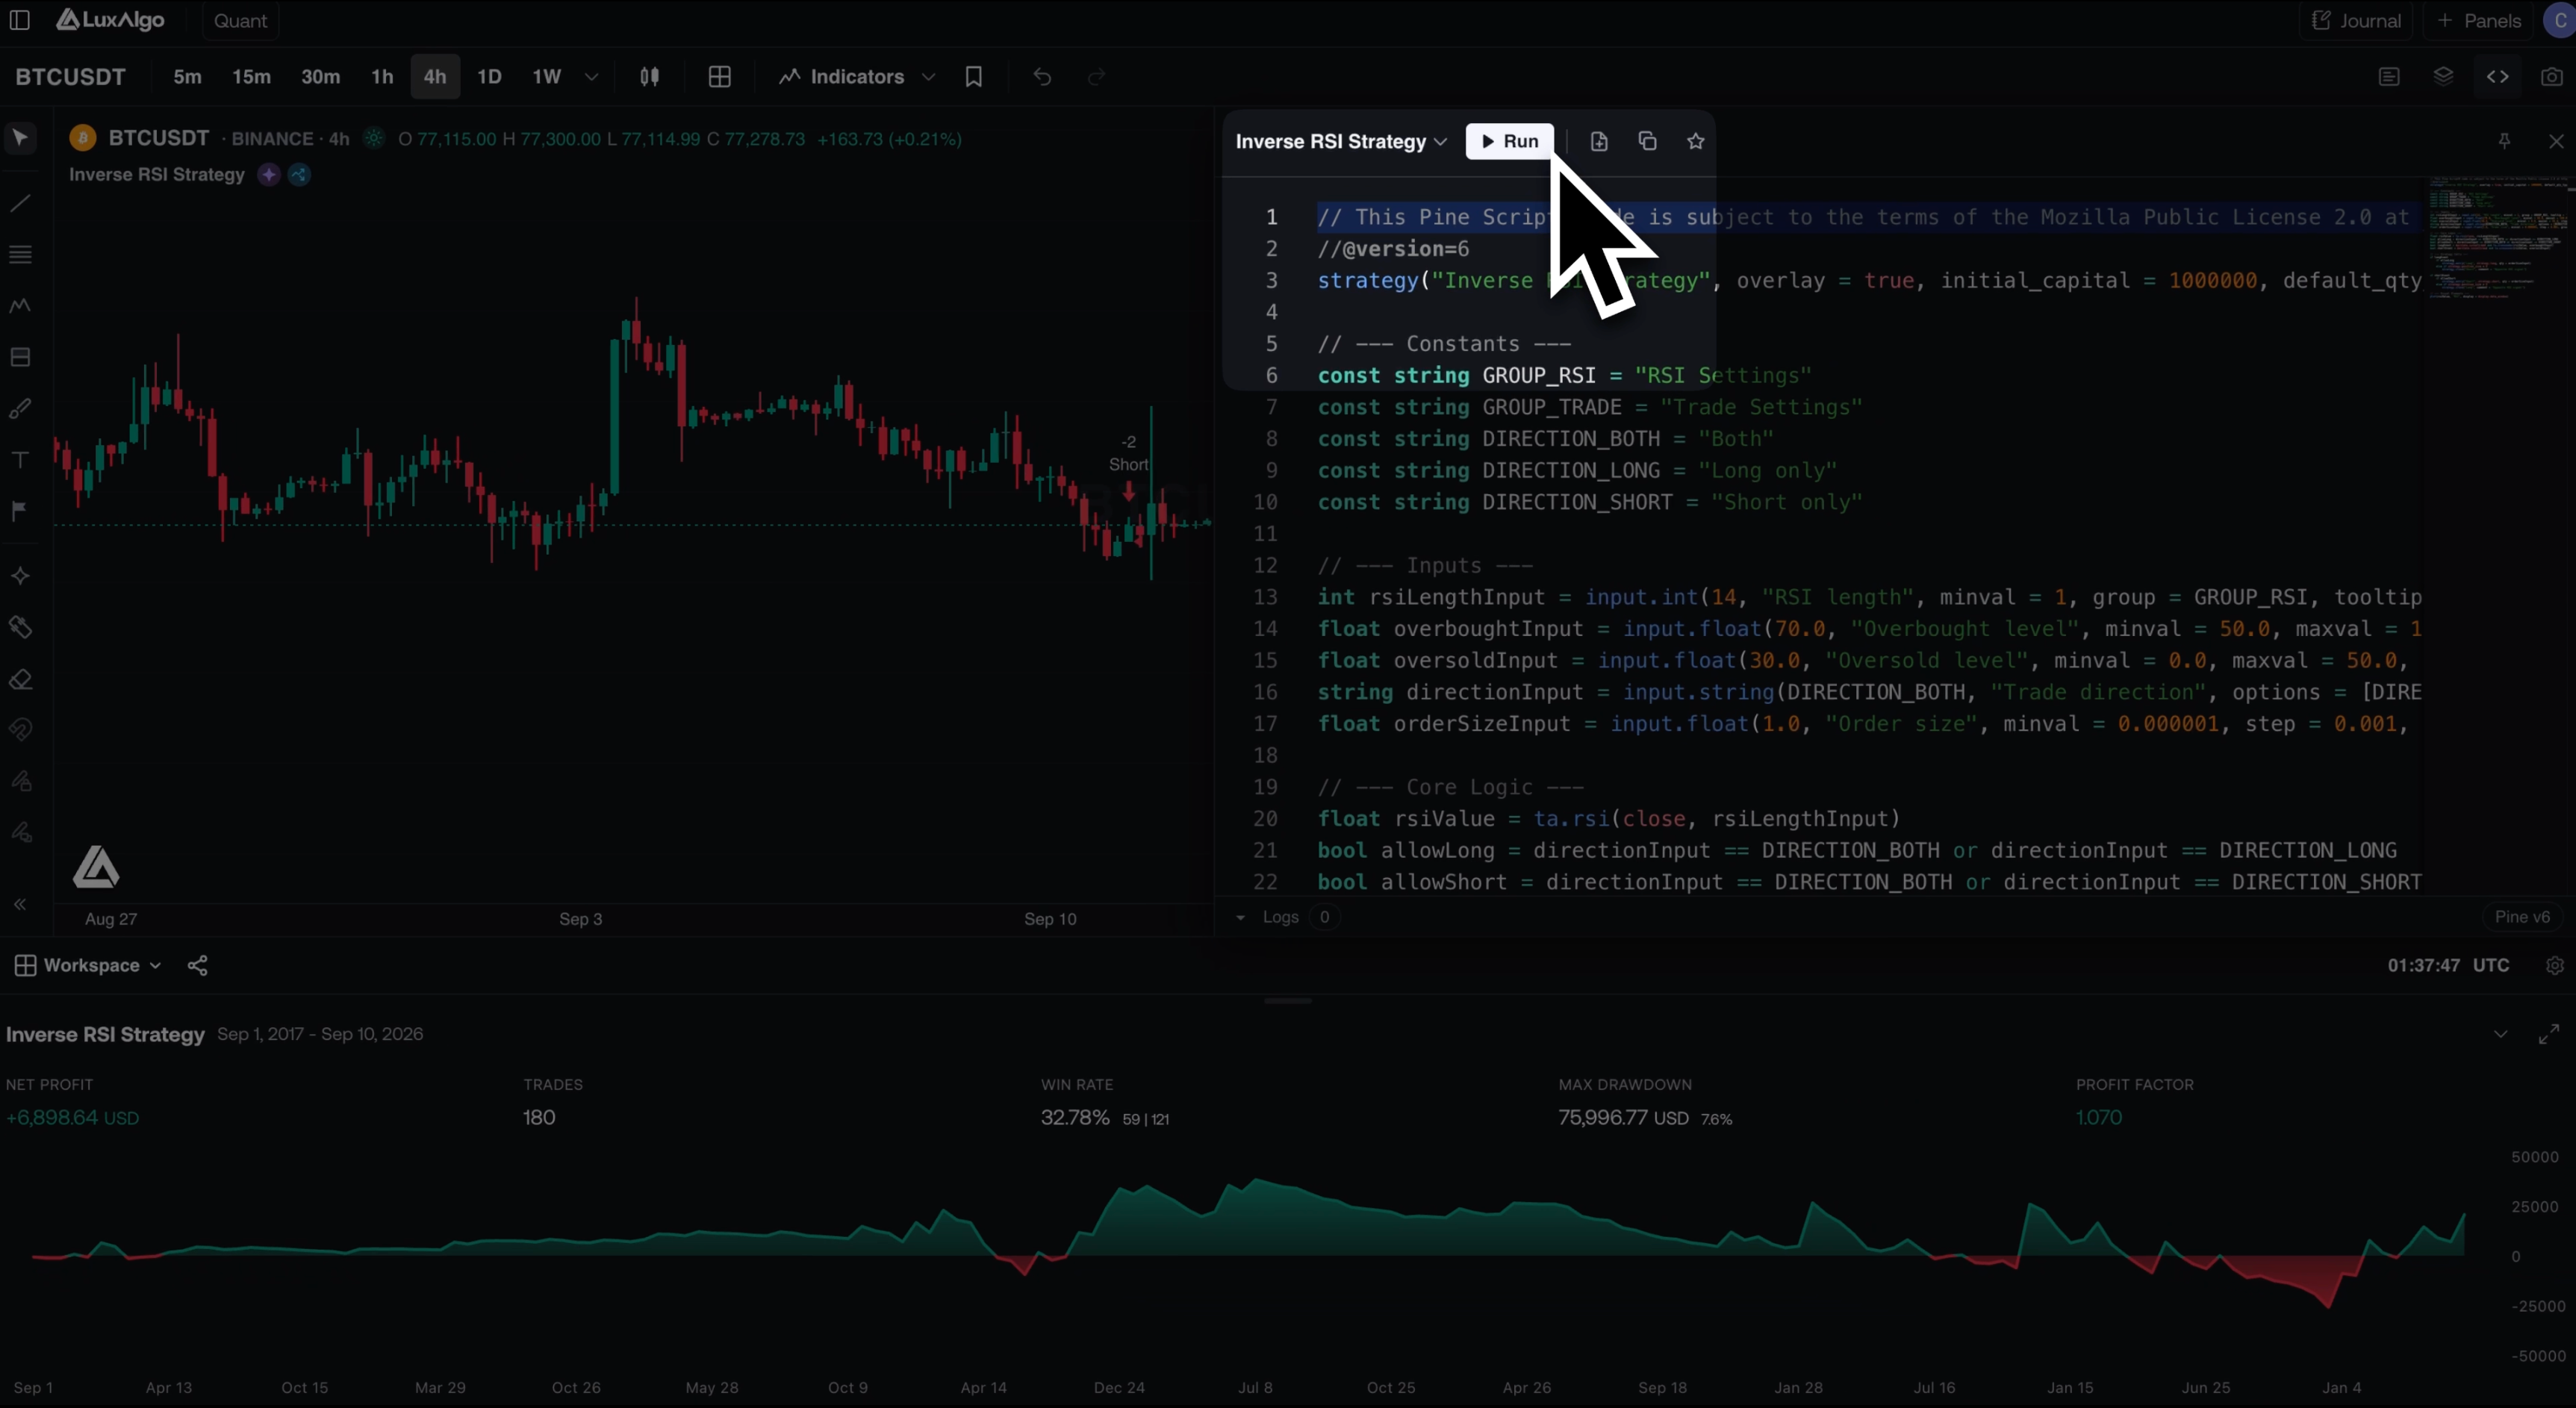
Run
When the Pine editor holds a strategy(...) script, click Run (signed in). The strategy executes over the chart's history: the chart marks every entry and exit, and a Backtest Summary strip appears below with the headline numbers:
| Metric | What it tells you |
|---|---|
| Net profit | Total profit and loss across all closed trades |
| Trades | Number of closed trades. Treat any metric with few trades behind it as noise |
| Win rate | Percentage of trades that closed profitable. Meaningless in isolation: a 30% win rate with large winners can outperform a 70% win rate with large losers |
| Max drawdown | The largest peak-to-trough drop in equity along the way: the pain you would have had to sit through |
| Profit factor | Gross profit divided by gross loss. Above 1 means the strategy made more than it lost; the further above, the better |
The strip can also toggle a historical net profit chart. Use the maximize button on the strip to open the full viewer.
Heikin Ashi does not produce realistic backtest results. HA candles use averaged prices you cannot trade at, so fills and P&L will not match a live market. Switch to a standard chart type before trusting the numbers.
Backtest viewer
The maximized viewer has four tabs:
- Performance: the net profit curve, summary metrics, net daily P&L, weekday performance, and a performance table broken out by all trades, longs only, and shorts only. The long/short split is worth checking: many strategies make all their money on one side.
- Trades Analysis: distribution views (P&L distribution, win rate, trade duration vs. P&L, and an analysis table). This is where you spot whether performance comes from many small edges or a few outliers.
- Trades Log: a sortable record of every trade, with entry, exit, net P&L, and cumulative P&L. Switch to the calendar view for daily results.
- Simulation: resample or shuffle the backtest's trades to explore simulated profit paths, outcome and drawdown distributions, the probability of crossing a selected drawdown threshold, and risk of ruin. Drawdown calculations include unrealized P&L from open positions. See the guide for examples, settings, and how to read each chart.
To review the same strategy on different data, return to the chart and change the symbol or timeframe. Reopen the viewer and check the symbol, timeframe, and date range in its header before comparing results.
Script settings
Open the settings gear in the toolbar:
- Inputs: the script's
input.*parameters (lengths, thresholds, toggles, whatever the script exposes). Changes re-run the backtest immediately, so you can sweep a parameter and watch the summary strip react. - Properties (strategies only): the simulation settings, independent of the script's logic:
- Initial capital: starting equity for the simulation
- Order size: how much each entry commits
- Pyramiding: how many entries may stack in the same direction
- Commission and slippage: per-trade costs; leaving these at zero flatters every strategy, so set them realistically before trusting the numbers
- Margin: leverage constraints
Saving
Star a run from the summary strip or the viewer. A saved strategy keeps everything needed to reproduce it: the script, symbol, timeframe, inputs, and backtest properties.
Saved strategies are listed in the Strategies panel of the sidebar, each with its profit, timeframe, win rate, and when it was last updated. When you have none saved yet, the panel offers a few strategy ideas; picking one fills the Quant prompt without sending it.
Results can differ across data feeds and fill models. Re-run on the symbol and timeframe you care about rather than trusting numbers produced elsewhere.