
Dashboard
Equity, Edge Score, daily P&L, drawdown, and the calendar for the selected range.
Maximize from the journal column (or use the full-screen view on mobile). Dashboard is the performance read for the selected account and date range.
The range tabs sit in the header: Today, Week, Month, Year, YTD, All, or a custom window from the calendar control next to them. The same range is kept when you minimize.
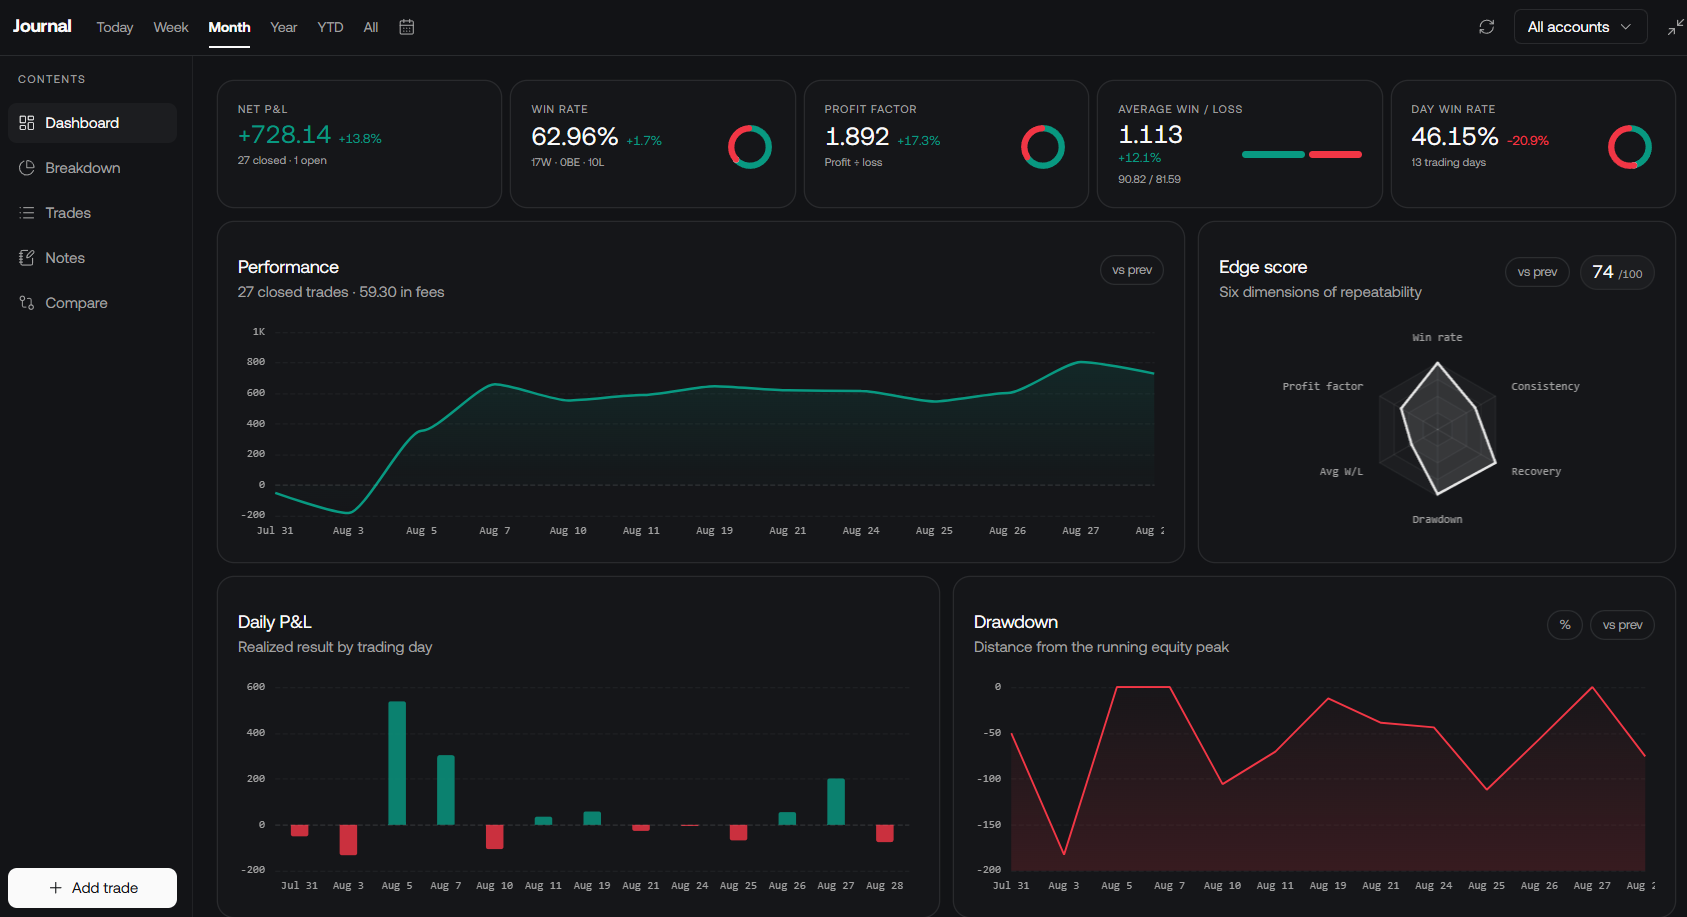
Headline cards
Five cards lead the page. Each can show a delta versus the previous window of the same length:
- Net P&L — closed and open counts, account currency
- Win rate — wins / breakevens / losses
- Profit factor — gross profit ÷ gross loss
- Average win / loss — size of a typical winner versus a typical loser
- Day win rate — winning days ÷ trading days, not winning trades

Performance and Edge Score
Performance is the equity curve. Toggle compare to overlay the previous period.
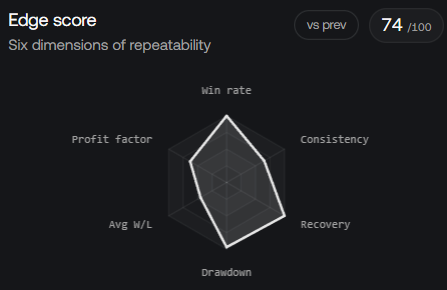
Edge Score is a 0–100 composite of six repeatability dimensions: win rate, profit factor, average win/loss, drawdown, recovery, consistency. It appears after five closed trades. Toggle compare to overlay the previous period on the radar.
Treat Edge Score as a repeatability read, not a guarantee.
Daily P&L, drawdown, and the calendar
Daily P&L is realized result by trading day.
Drawdown is distance from the running equity peak. Switch to % when the account has an initial balance.
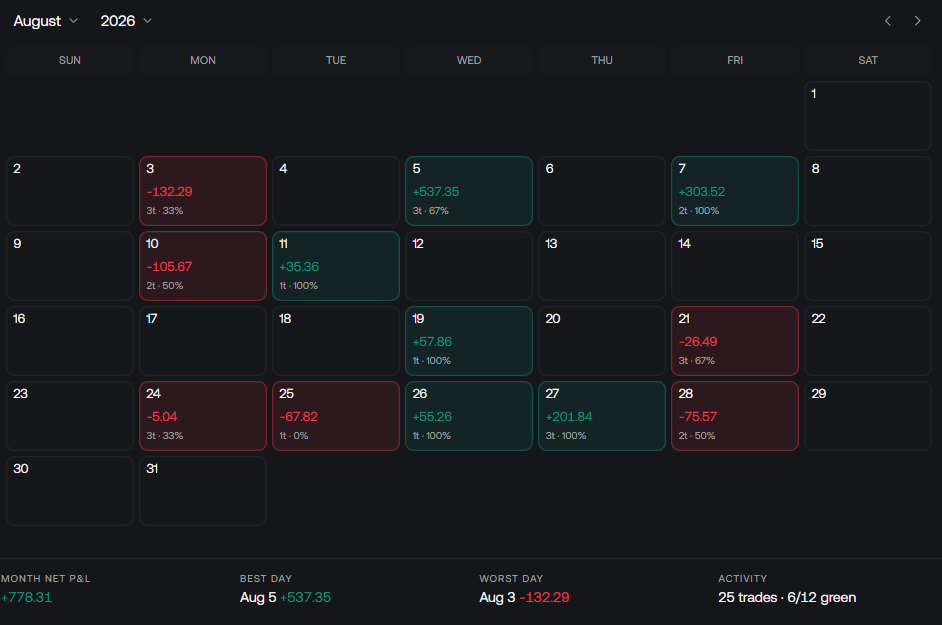
The calendar colors each day by result and totals the weeks and the month. Click a day to open its review: that session's net P&L, trade count, fees, volume, running P&L, the day's trades, and the day note.
Recent trades on the right open a review. Risk & behavior at the bottom is max drawdown, expectancy per trade, average duration, current streak, and best / worst day.
Expectancy in R needs a stop loss on the trade. Drawdown % needs an initial balance on the account.
Return to chart puts the column back.