
Bar Stats
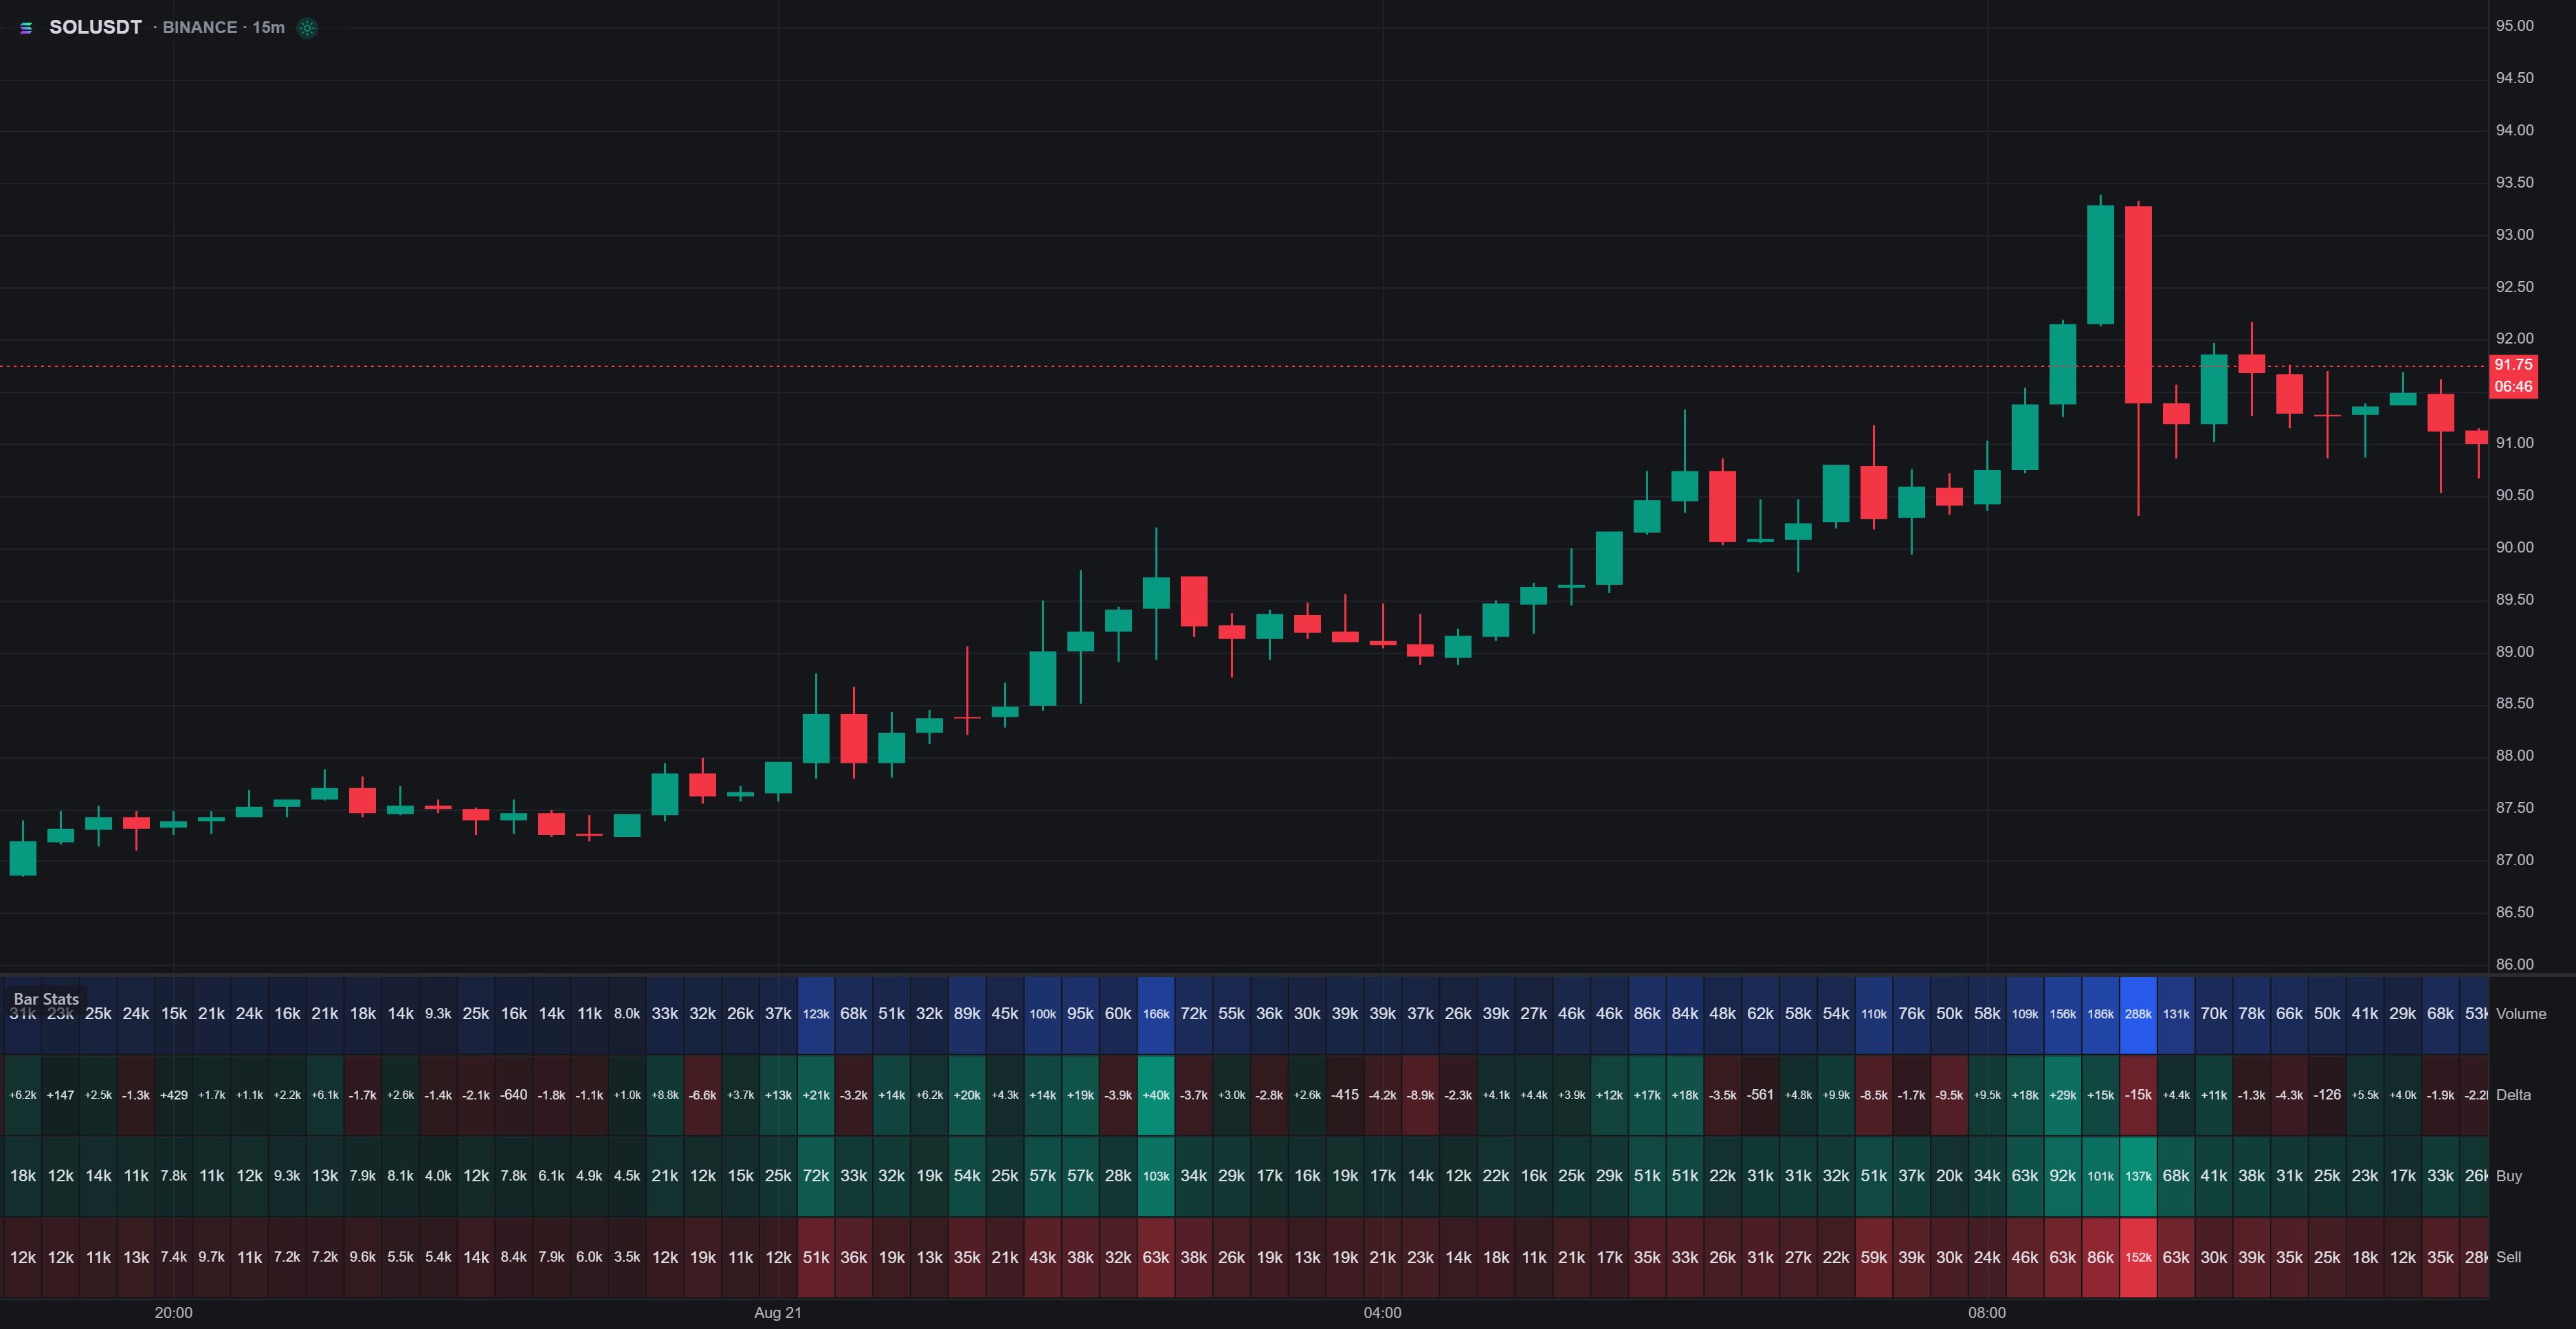
Volume, delta, and trade counts for each candle, in a pane under the chart.
Bar Stats is a pane under the chart with one column per candle and one row per statistic. Scan volume, delta, and trade counts across history without opening a Footprint.
Needs footprint data. It also needs a fixed bar duration, so it is unavailable on monthly timeframes. Add it from Indicators → Orderflow.
Rows
Toggle which stats to show. Defaults are Volume, Delta, Buy, and Sell. Trade-count rows start off, because not every source has counts.
| Row | What it is | Default |
|---|---|---|
| Volume | Buy volume + sell volume | On |
| Delta | Buy volume − sell volume | On |
| Buy | Aggressive buy (ask) volume | On |
| Sell | Aggressive sell (bid) volume | On |
| Buy trades | Ask-side trade count | Off |
| Sell trades | Bid-side trade count | Off |
| Trades | Buy trades + sell trades | Off |
Delta uses up/down colors. Everything else is a single color, stronger on larger bars relative to what is on screen.
Settings
- Rows: toggle each stat and set its color. Delta has up and down colors.
- Values: Auto prints numbers when you are zoomed in enough; Off is color only.
Colors follow the visible range: scroll or zoom and the scale updates.
For the same totals on a single footprint bar, use the Stat table on Footprint.