
Trade Count
Print-count tools: total trades per bar, buy/sell delta, and the running sum.
These three tools count prints, not volume. They need footprint data with trade counts; bars without counts leave a gap rather than plotting zero. They also need a fixed bar duration, so they are unavailable on monthly timeframes. Add them from Indicators → Orderflow.
Volume and trade count diverging is the signal worth watching: high volume on few prints means large players; high print counts on modest volume means a crowd of small ones.
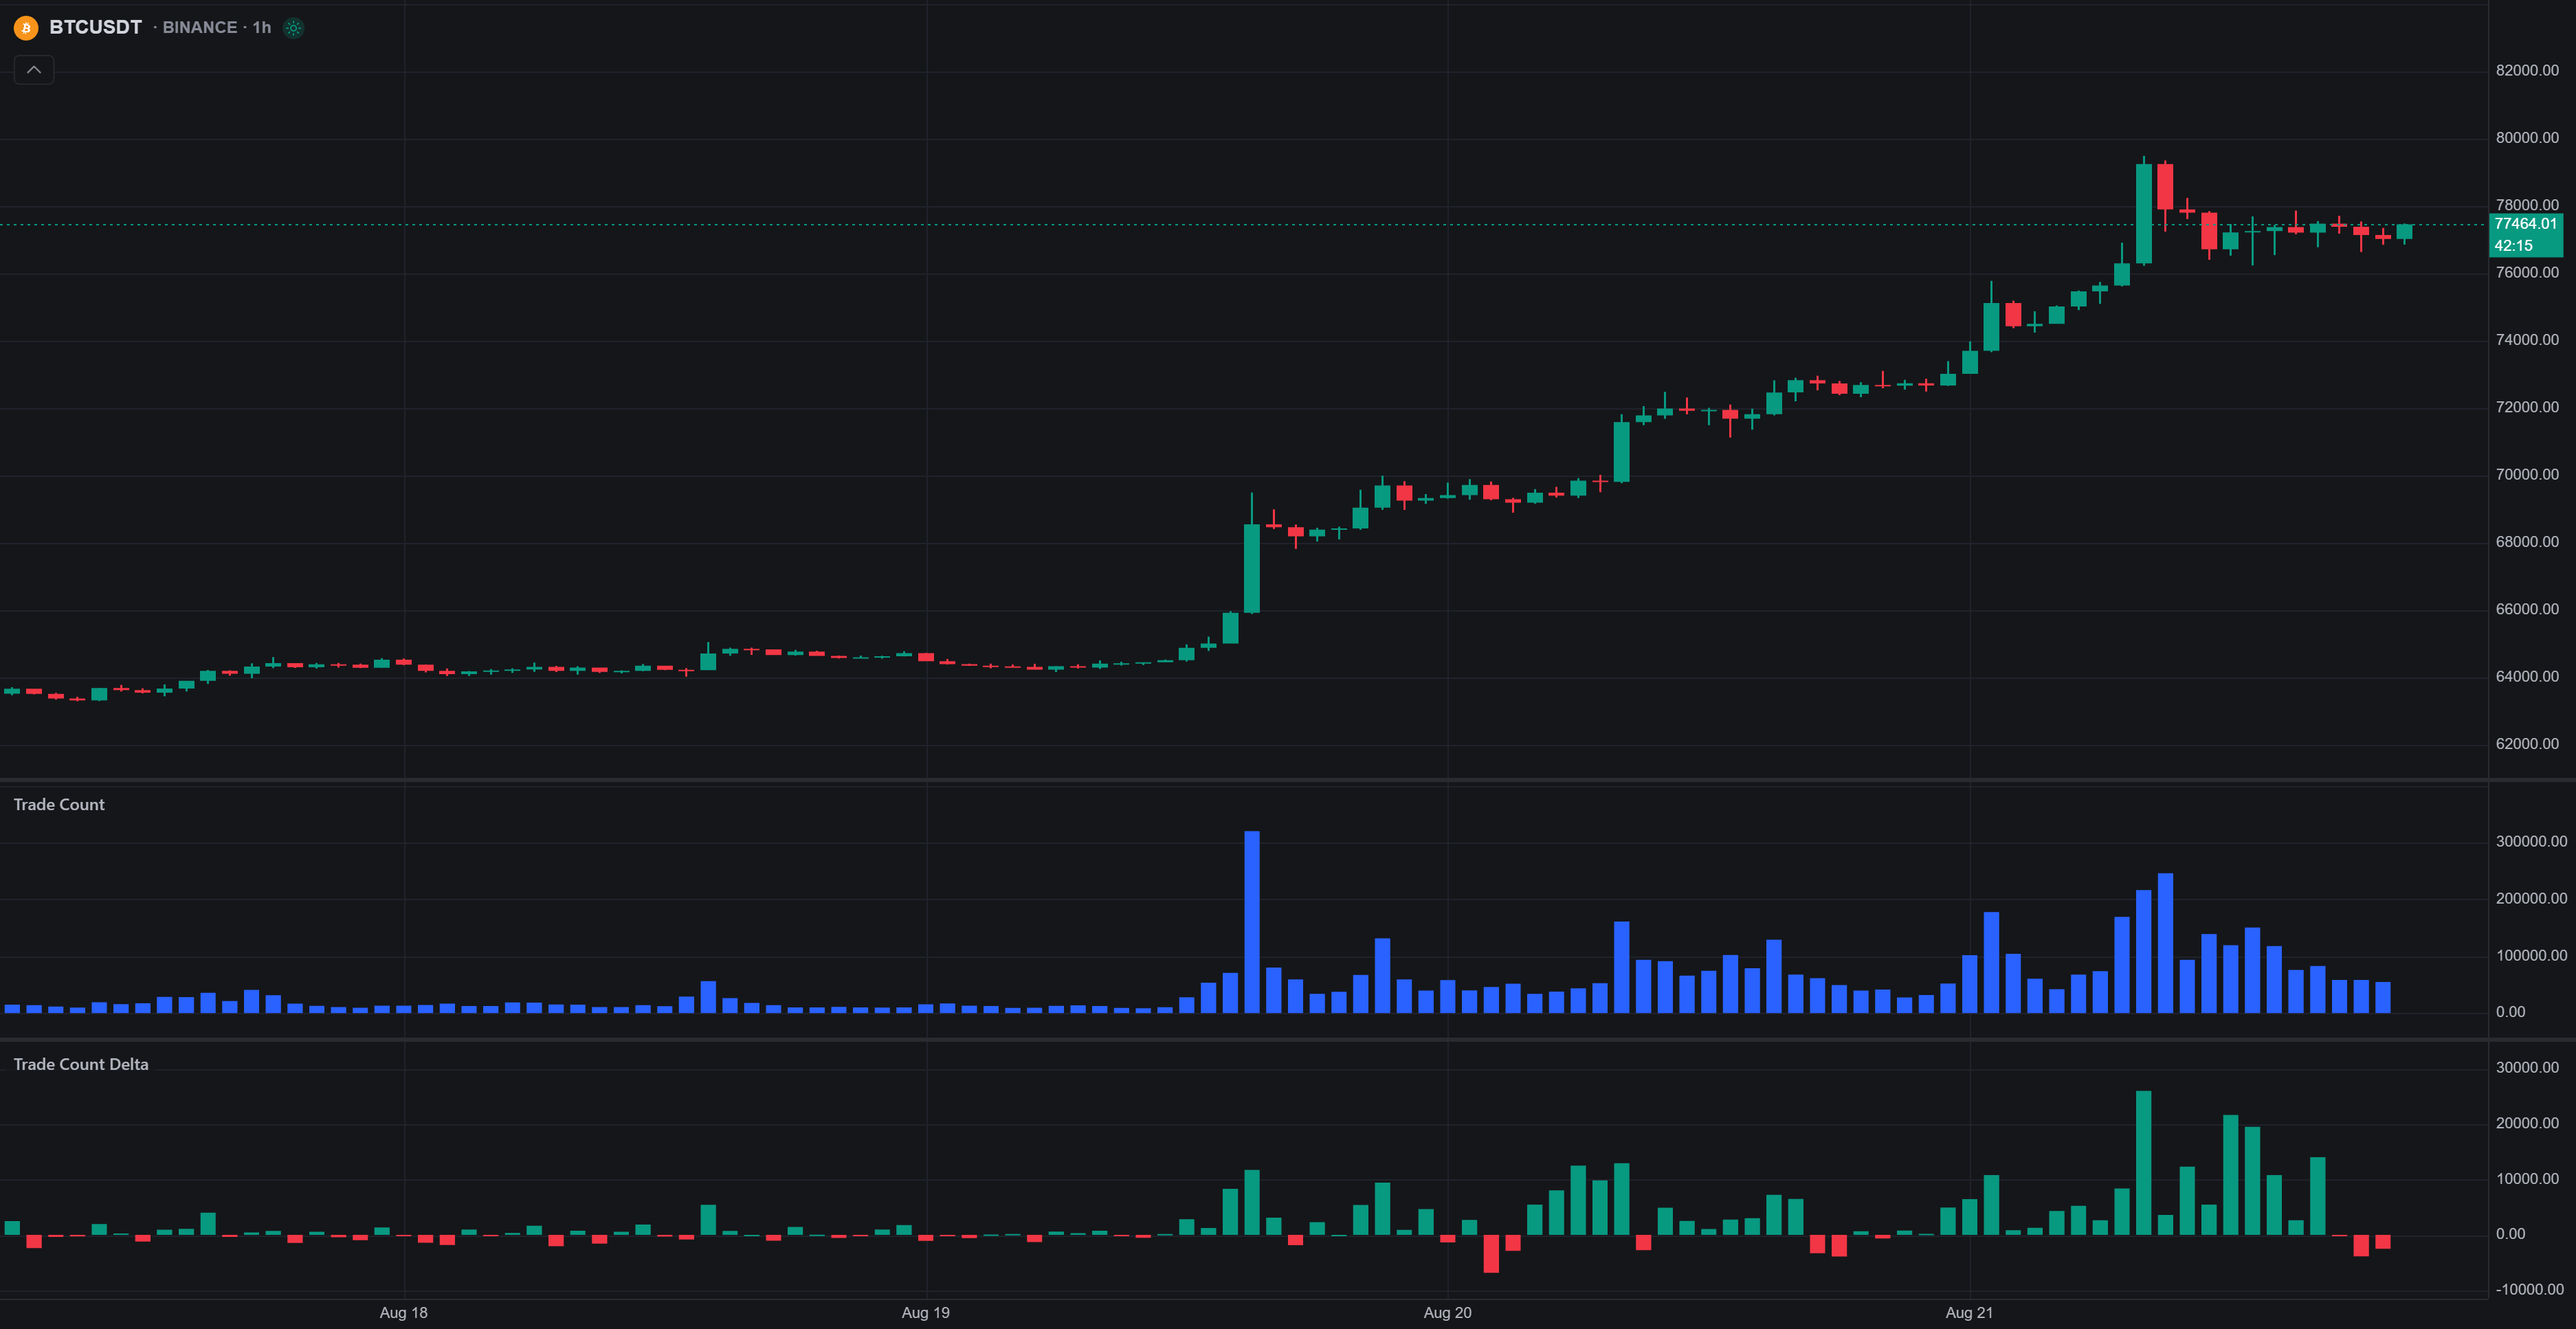
Trade Count
Trade Count is buy count + sell count per bar, as columns in a new pane. It shows how many prints occurred, not how much volume they were: participation rather than size.
The only setting is the column Color.
Trade Count Delta
Trade Count Delta is buy count − sell count per bar, as sign-colored columns in a new pane (Up / Down colors). It answers whether more prints were buys or sells, regardless of their size.
Compared against Volume Delta on the same bar, it separates crowd from size: positive volume delta with negative trade count delta means a few large buyers absorbed many small sellers.
Cumulative Trade Count Delta
Cumulative Trade Count Delta (CTCD) is the running sum of per-bar Trade Count Delta. It shows whether buy or sell prints have been accumulating, not how large those prints were.
- Style: Candles (default, with intra-bar wicks showing how far the count delta swung within each bar), Line, or Area.
- Anchor: where the running sum resets, in UTC periods: Day (default), Week, Month, or All data.
CTCD is the print-count sibling of Cumulative Volume Delta. When the two disagree (CVD climbing while CTCD is flat), the buying is coming from fewer, larger trades rather than broad participation. Watching them together separates size from crowd.