
TPO
TPO (market profile) sessions from candles: chart type and overlay, with full structure options.
Time Price Opportunity (TPO) builds a session profile from candles: how much time price spent at each level, shown as letters or blocks. Where a volume profile answers "how much traded here", a TPO answers "how long was it accepted here".
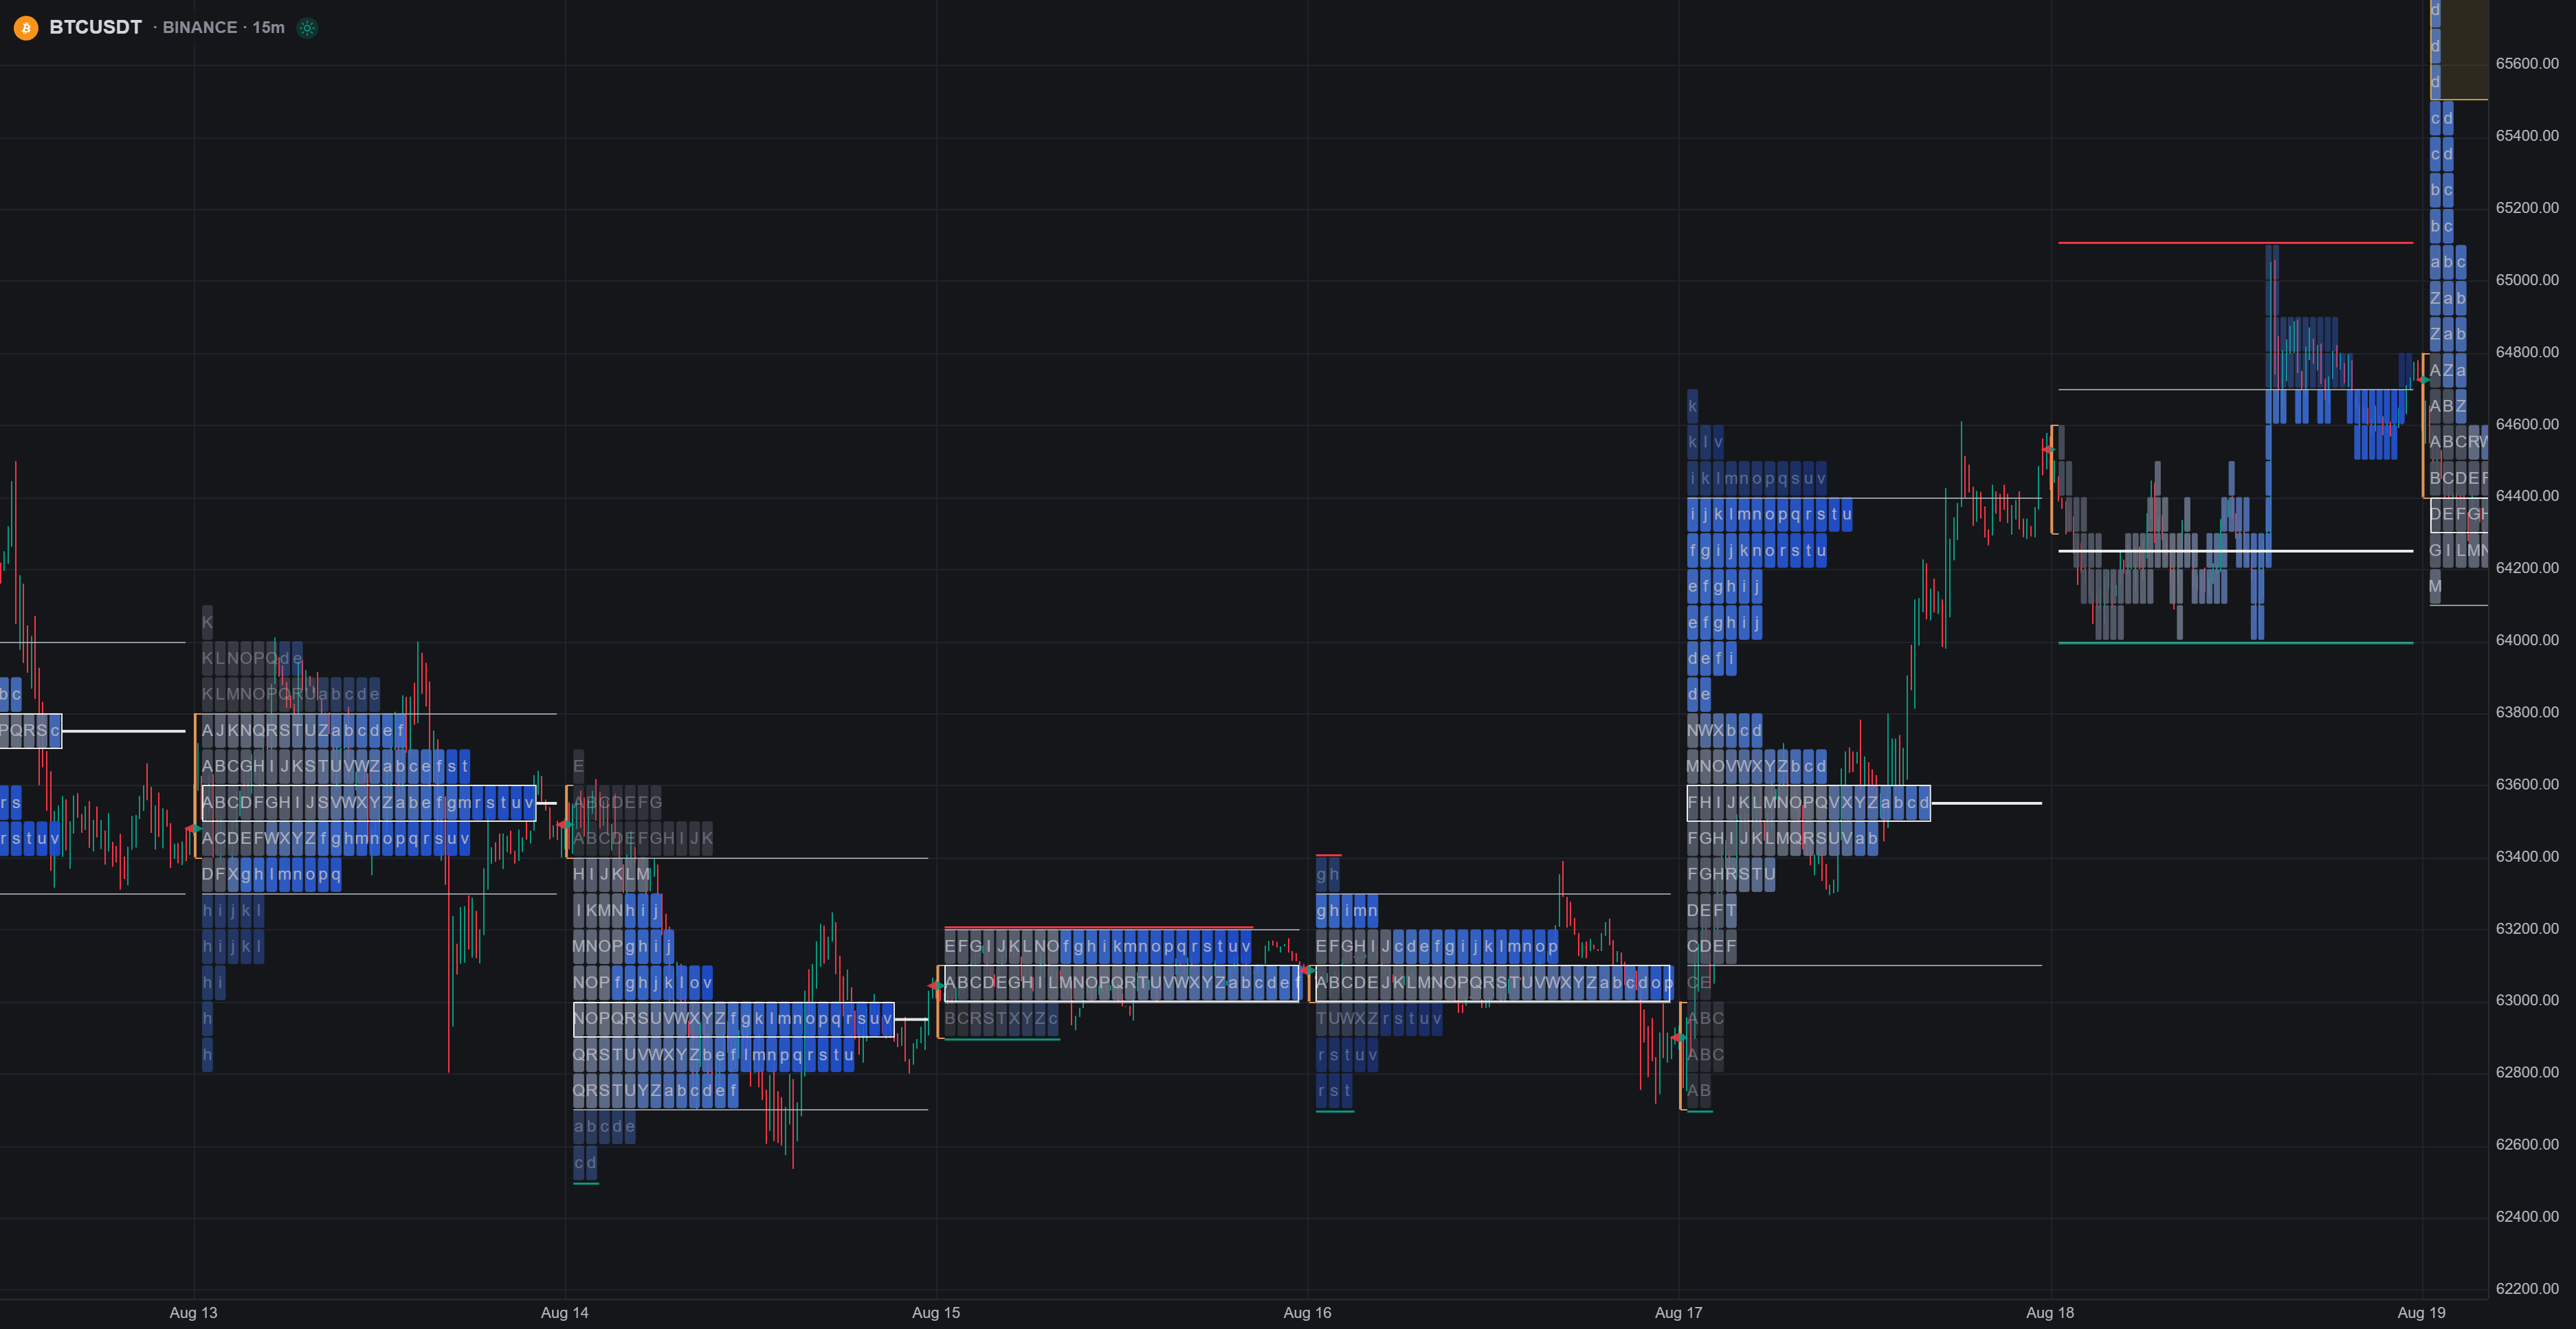
TPO uses ordinary OHLCV, so it runs on every market: including forex and commodities. Coloring the profile by volume, trades, or delta is extra and needs footprint data; on candles-only markets those options fall back to time coloring.
Like the footprint, TPO exists as a chart type (switch the chart style to TPO) with the full feature set including session merging, and as an overlay (Time Price Opportunity in Indicators → Orderflow) that draws the same profiles over the candles.
Sessions
| Setting | Options | Default |
|---|---|---|
| Session | Day, Week, Month | Day |
| Trading hours (Day only) | Full day, Regular hours (RTH), Extended hours (ETH), Pre-market, Market, Post-market, London, New York, Asian, Custom | Full day |
| Block interval | 5m, 15m, 30m, 1h, 4h | 30m |
| Row size | Auto, or Manual with Ticks per row | Auto |
Each block interval is one letter/block period: with 30m blocks, A is the first half hour of the session, B the second, and so on through A–Z, then a–z, then 0–9.
Regular hours and Extended hours follow the venue's real trading calendar (holidays and DST included) where the data provides one. The named windows (Pre-market, Market, Post-market, London, New York, Asian) are fixed UTC approximations, and Custom takes a start and end in UTC HHMM (an end at or before the start wraps past midnight, for overnight sessions). Weeks anchor on Monday, months on the 1st, and trading-hours filtering applies to day sessions only.
With Trading hours on Full day, the profile follows whatever the chart itself shows. An RTH chart produces RTH profiles. Picking an explicit window overrides the chart.
Display
- Show blocks and Show letters toggle independently: letters-only is the classic market-profile reading, blocks-only reads like a heat profile.
- Color row by selects what the color encodes: Time (position within the session, the default), Volume, Trades count, or Delta: the latter three from footprint data.
- Theme picks the color ramp per mode (e.g. Simple, Thermal, Spectrum for time/volume/trades; Classic, Neon, Arctic for delta), with a Custom option exposing the individual colors.
- Outside VA opacity (%) dims cells outside the value area (default 45), making the value area pop without hiding the tails.
Hovering a block shows its letter, the row's price interval, the block's time window, and, when metric coloring is on, the row's volume, trades, or delta value.
Structure
- Value area % (default 70) draws VAH and VAL lines; VA fill adds a soft band between them. Optional POC / VAH / VAL labels print the prices at the session's left edge.
- Point of control marks the row with the most TPOs. Extend POC until reached projects each session's POC rightward until price trades through it. An untested (naked) POC runs to the newest bar.
- Initial balance brackets the price range of the session's opening period (IB minutes, default 60), the reference range day-type traders build on.
- Single prints shade mid-profile price runs that only ever printed one TPO, fast moves that price may revisit. Runs touching a session extreme are tails, not singles, and are excluded.
- Poor high / low caps a session extreme where two or more TPOs printed at the extreme row, an "unfinished" extreme that often gets repaired later.
Volume profile ladder
An optional per-session volume profile draws beside the letters (position Left or Right), built from the chart's bars. It carries its own Rows, Width (%), Volume POC, Value area (%), and price labels, so you can read time-based and volume-based structure side by side and spot where they disagree.
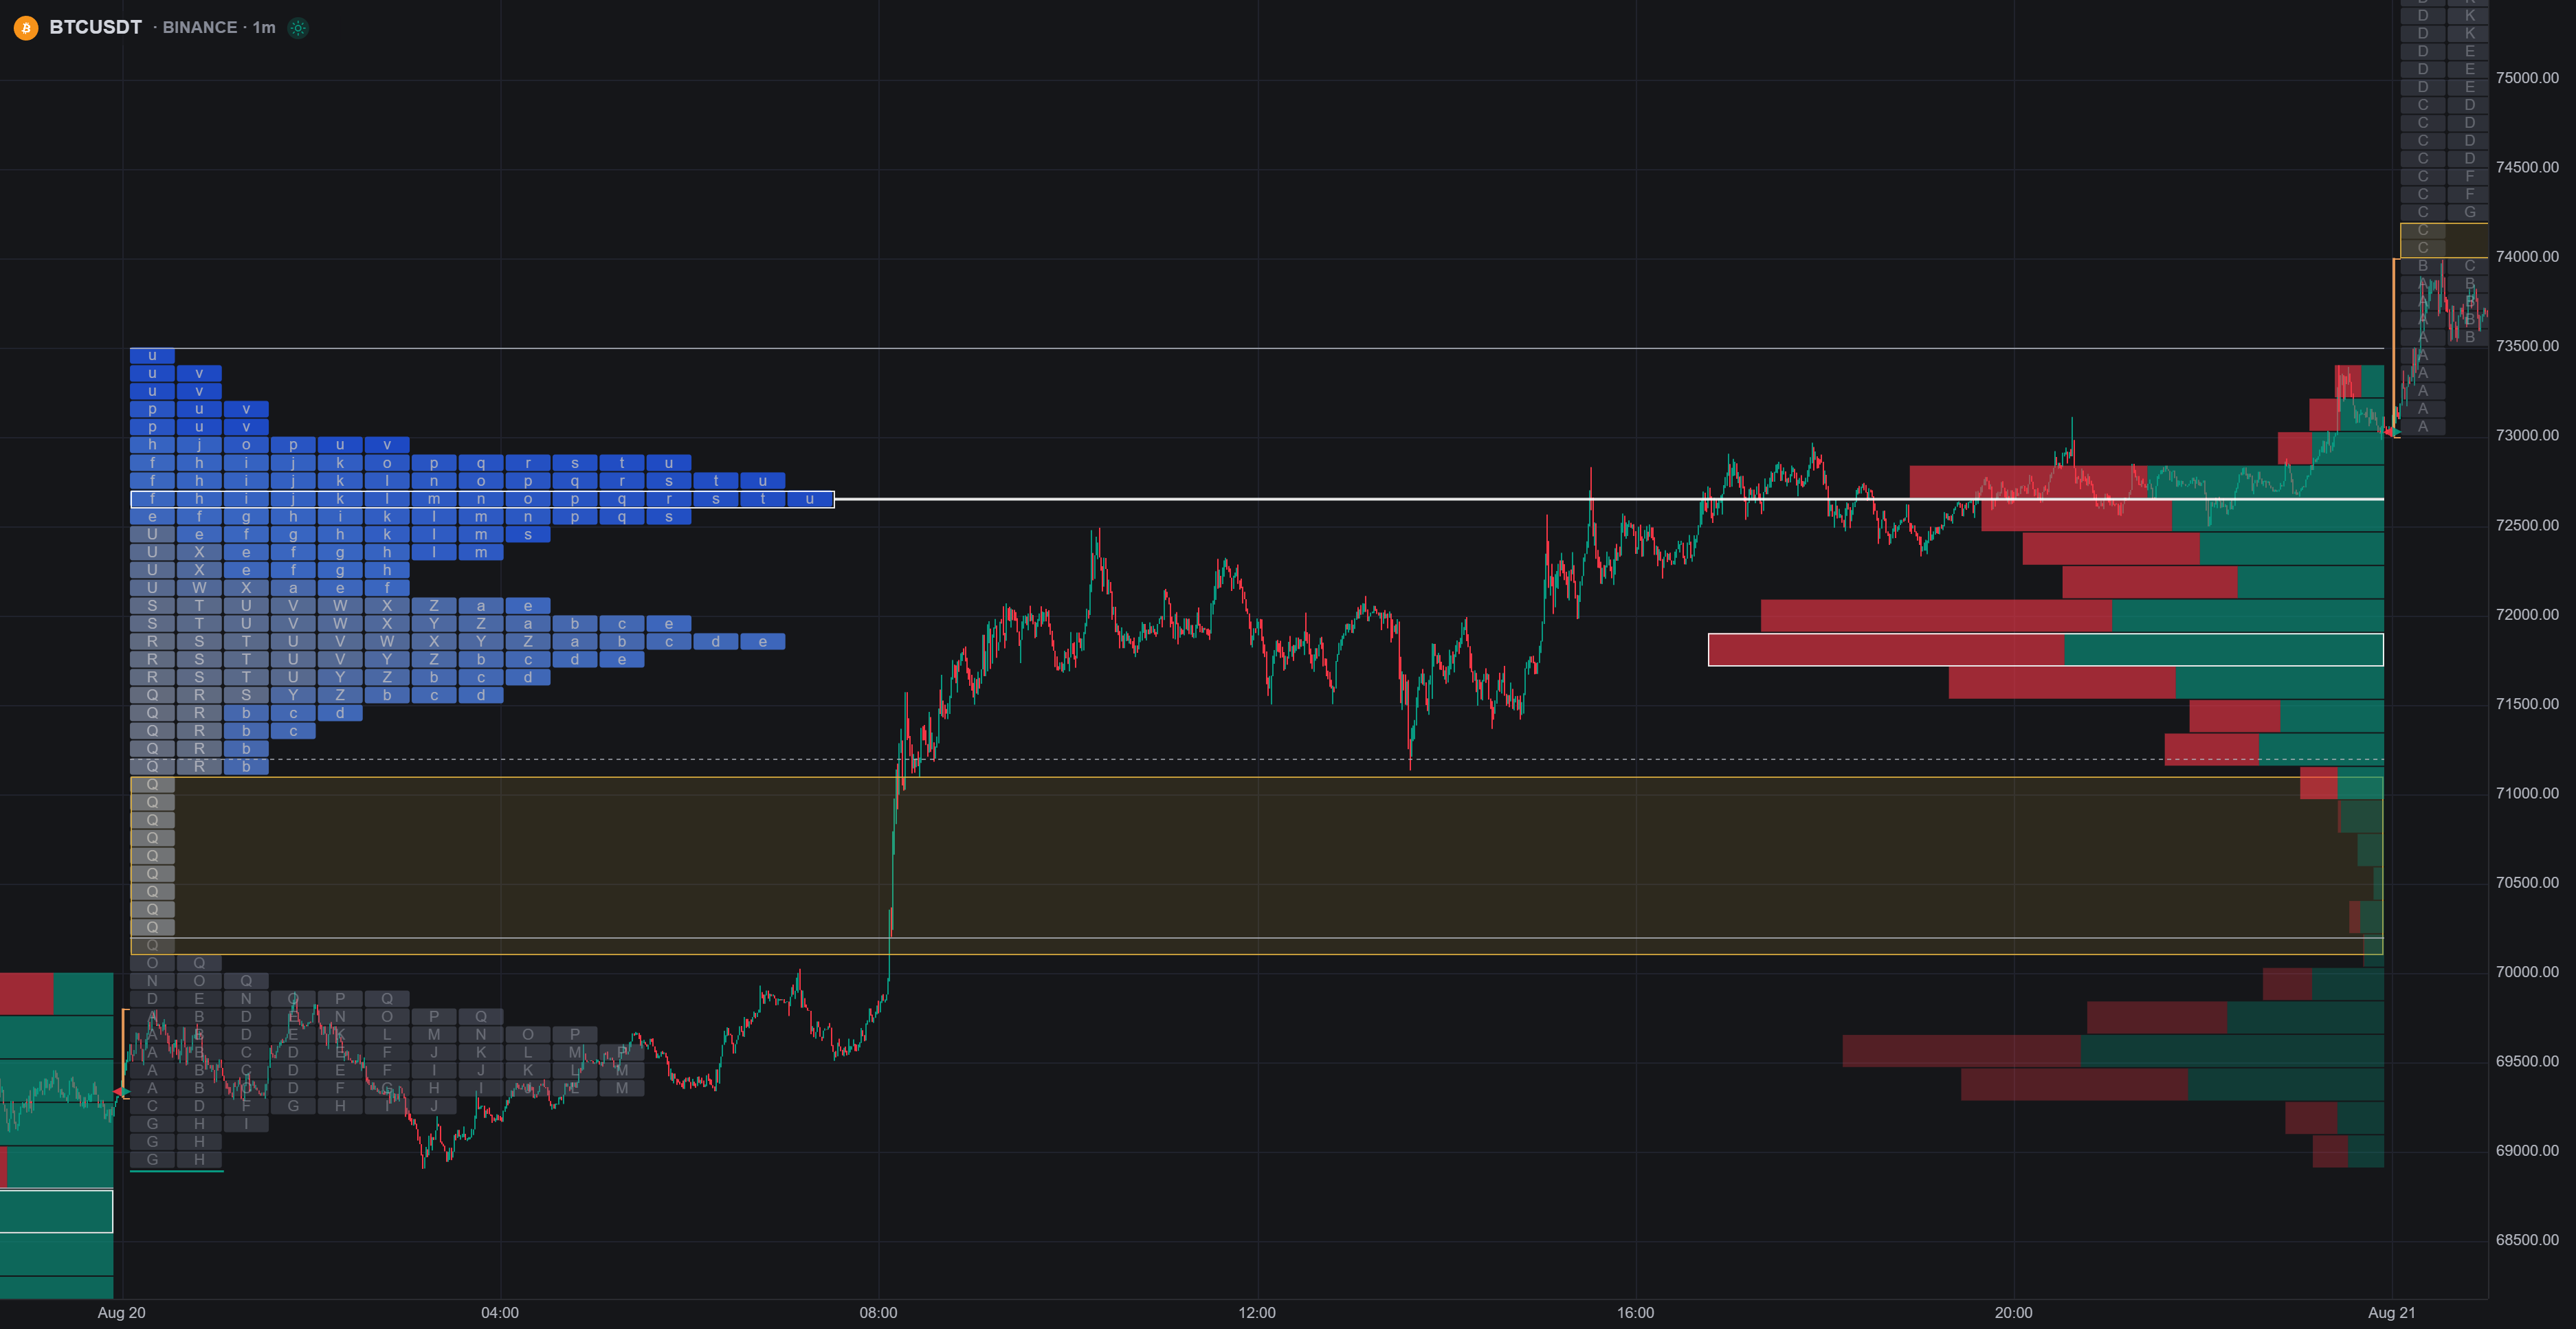
Markers
- Open / close markers: small arrows at the session's first and last traded price.
- Midpoint: the middle of the session's range.
Working with sessions
Right-click a profile (chart type only) for session operations:
- Expand TPO re-paints each block in its own real time column above the candles that produced it, the classic split-profile view for reading how the session developed. Collapse TPO packs it back.
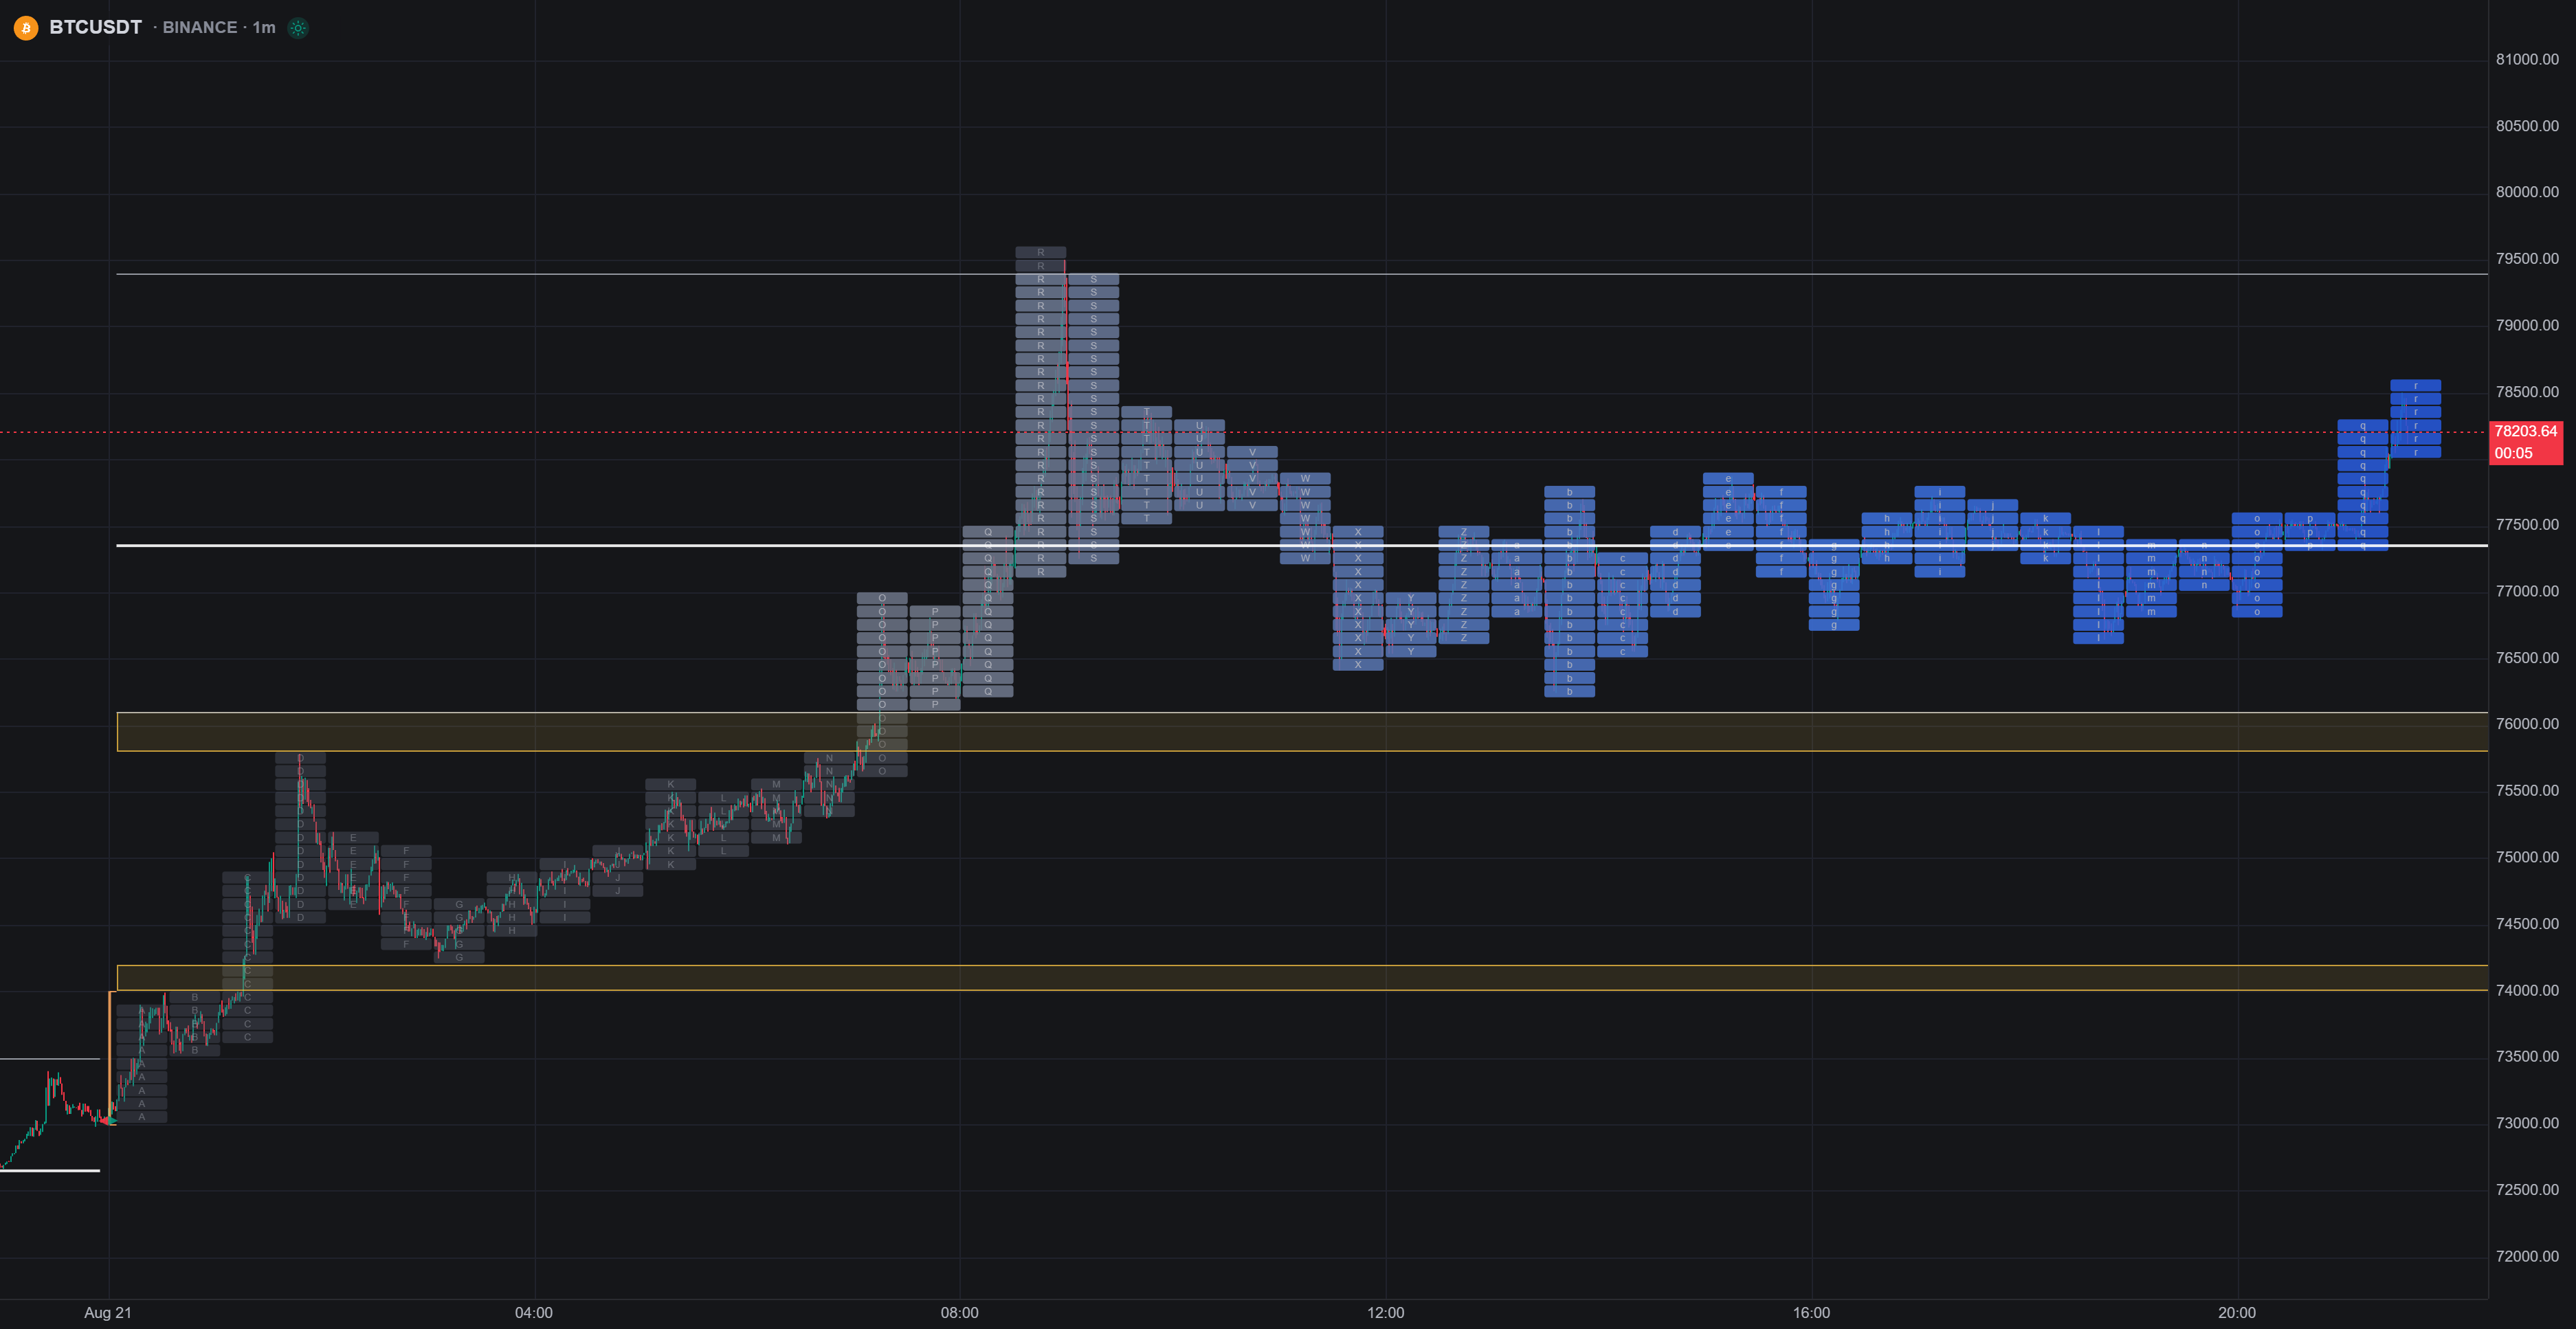
- Merge to previous / following TPO folds adjacent sessions into one profile with structure recomputed over the whole span. Merge a quiet overnight session into its day, or build a multi-day composite. Merges chain, and Unmerge TPO / Unmerge all TPOs takes them apart again.
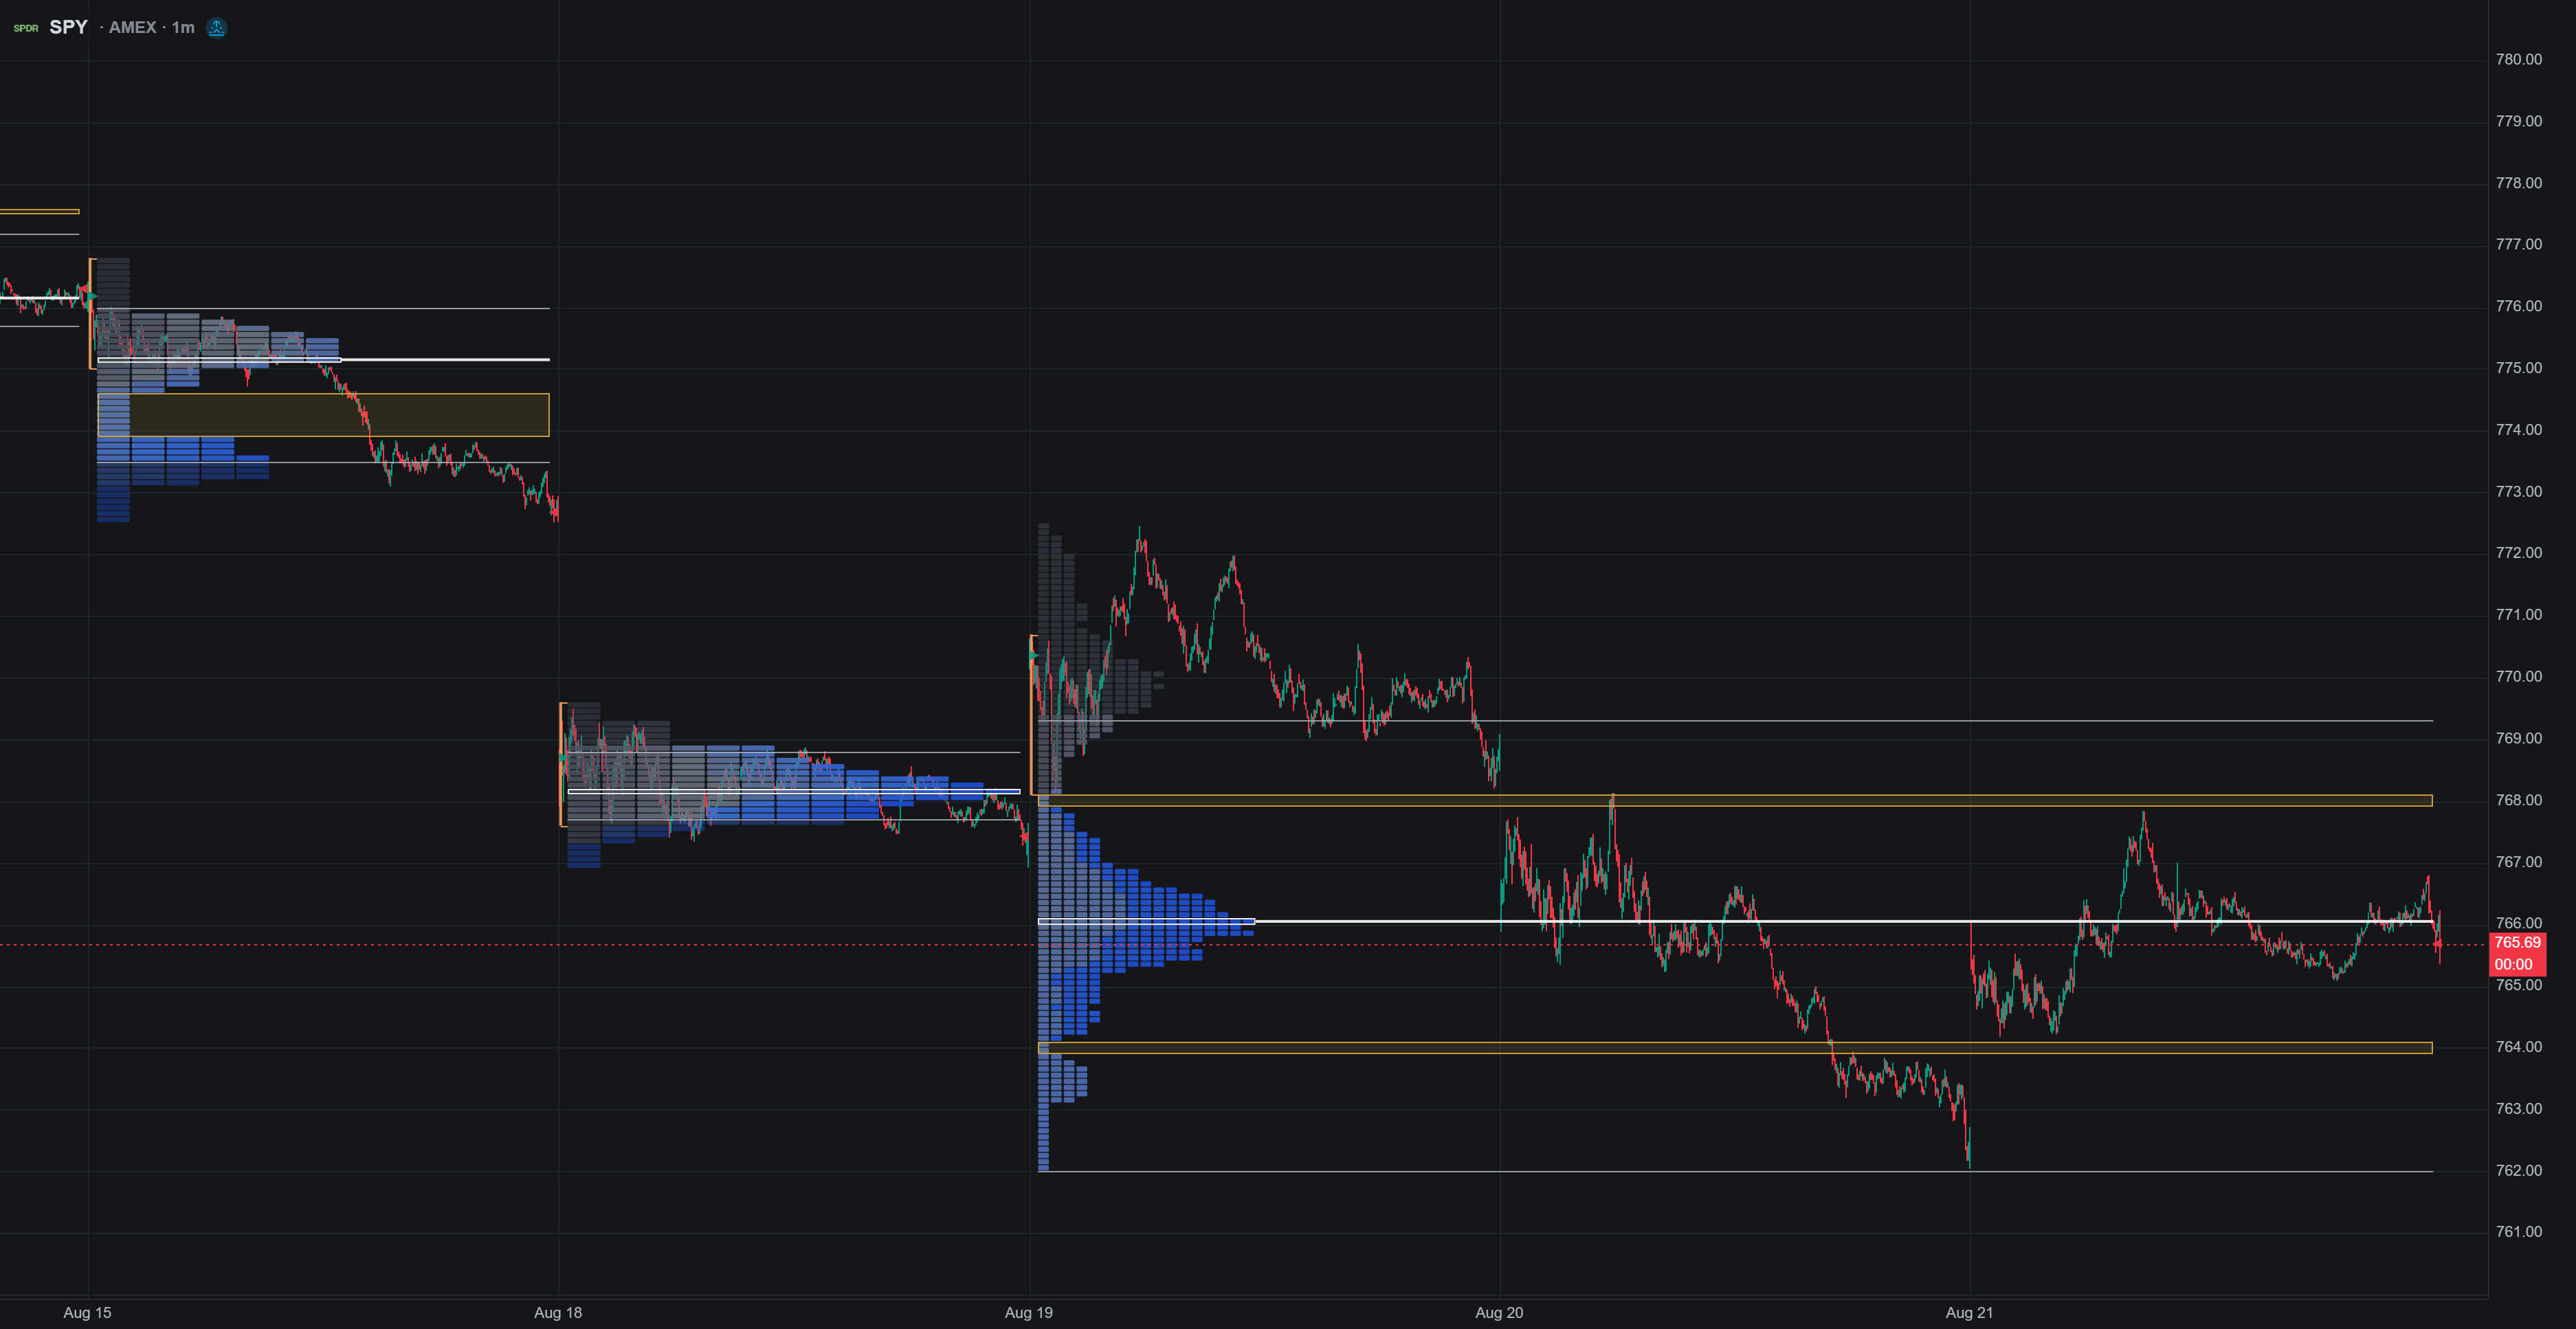
- TPO Settings jumps straight to the TPO tab.
The forming session updates live, so its POC, value area, and initial balance are developing values until the session completes.
Overlay
Time Price Opportunity in Indicators → Orderflow draws the same profiles on top of candles instead of replacing them, with the same session, display, structure, ladder, and marker options. The right-click session operations (expand, merge) are exclusive to the chart type. Because it needs only candles, the overlay is available on every symbol. It's one of the Orderflow-group indicators that never hide on candles-only markets, alongside VWAP and the Visible Range Volume Profile.