
Footprint
Footprint chart type and footprint overlays: modes, imbalances, unfinished auctions, and the stat table.
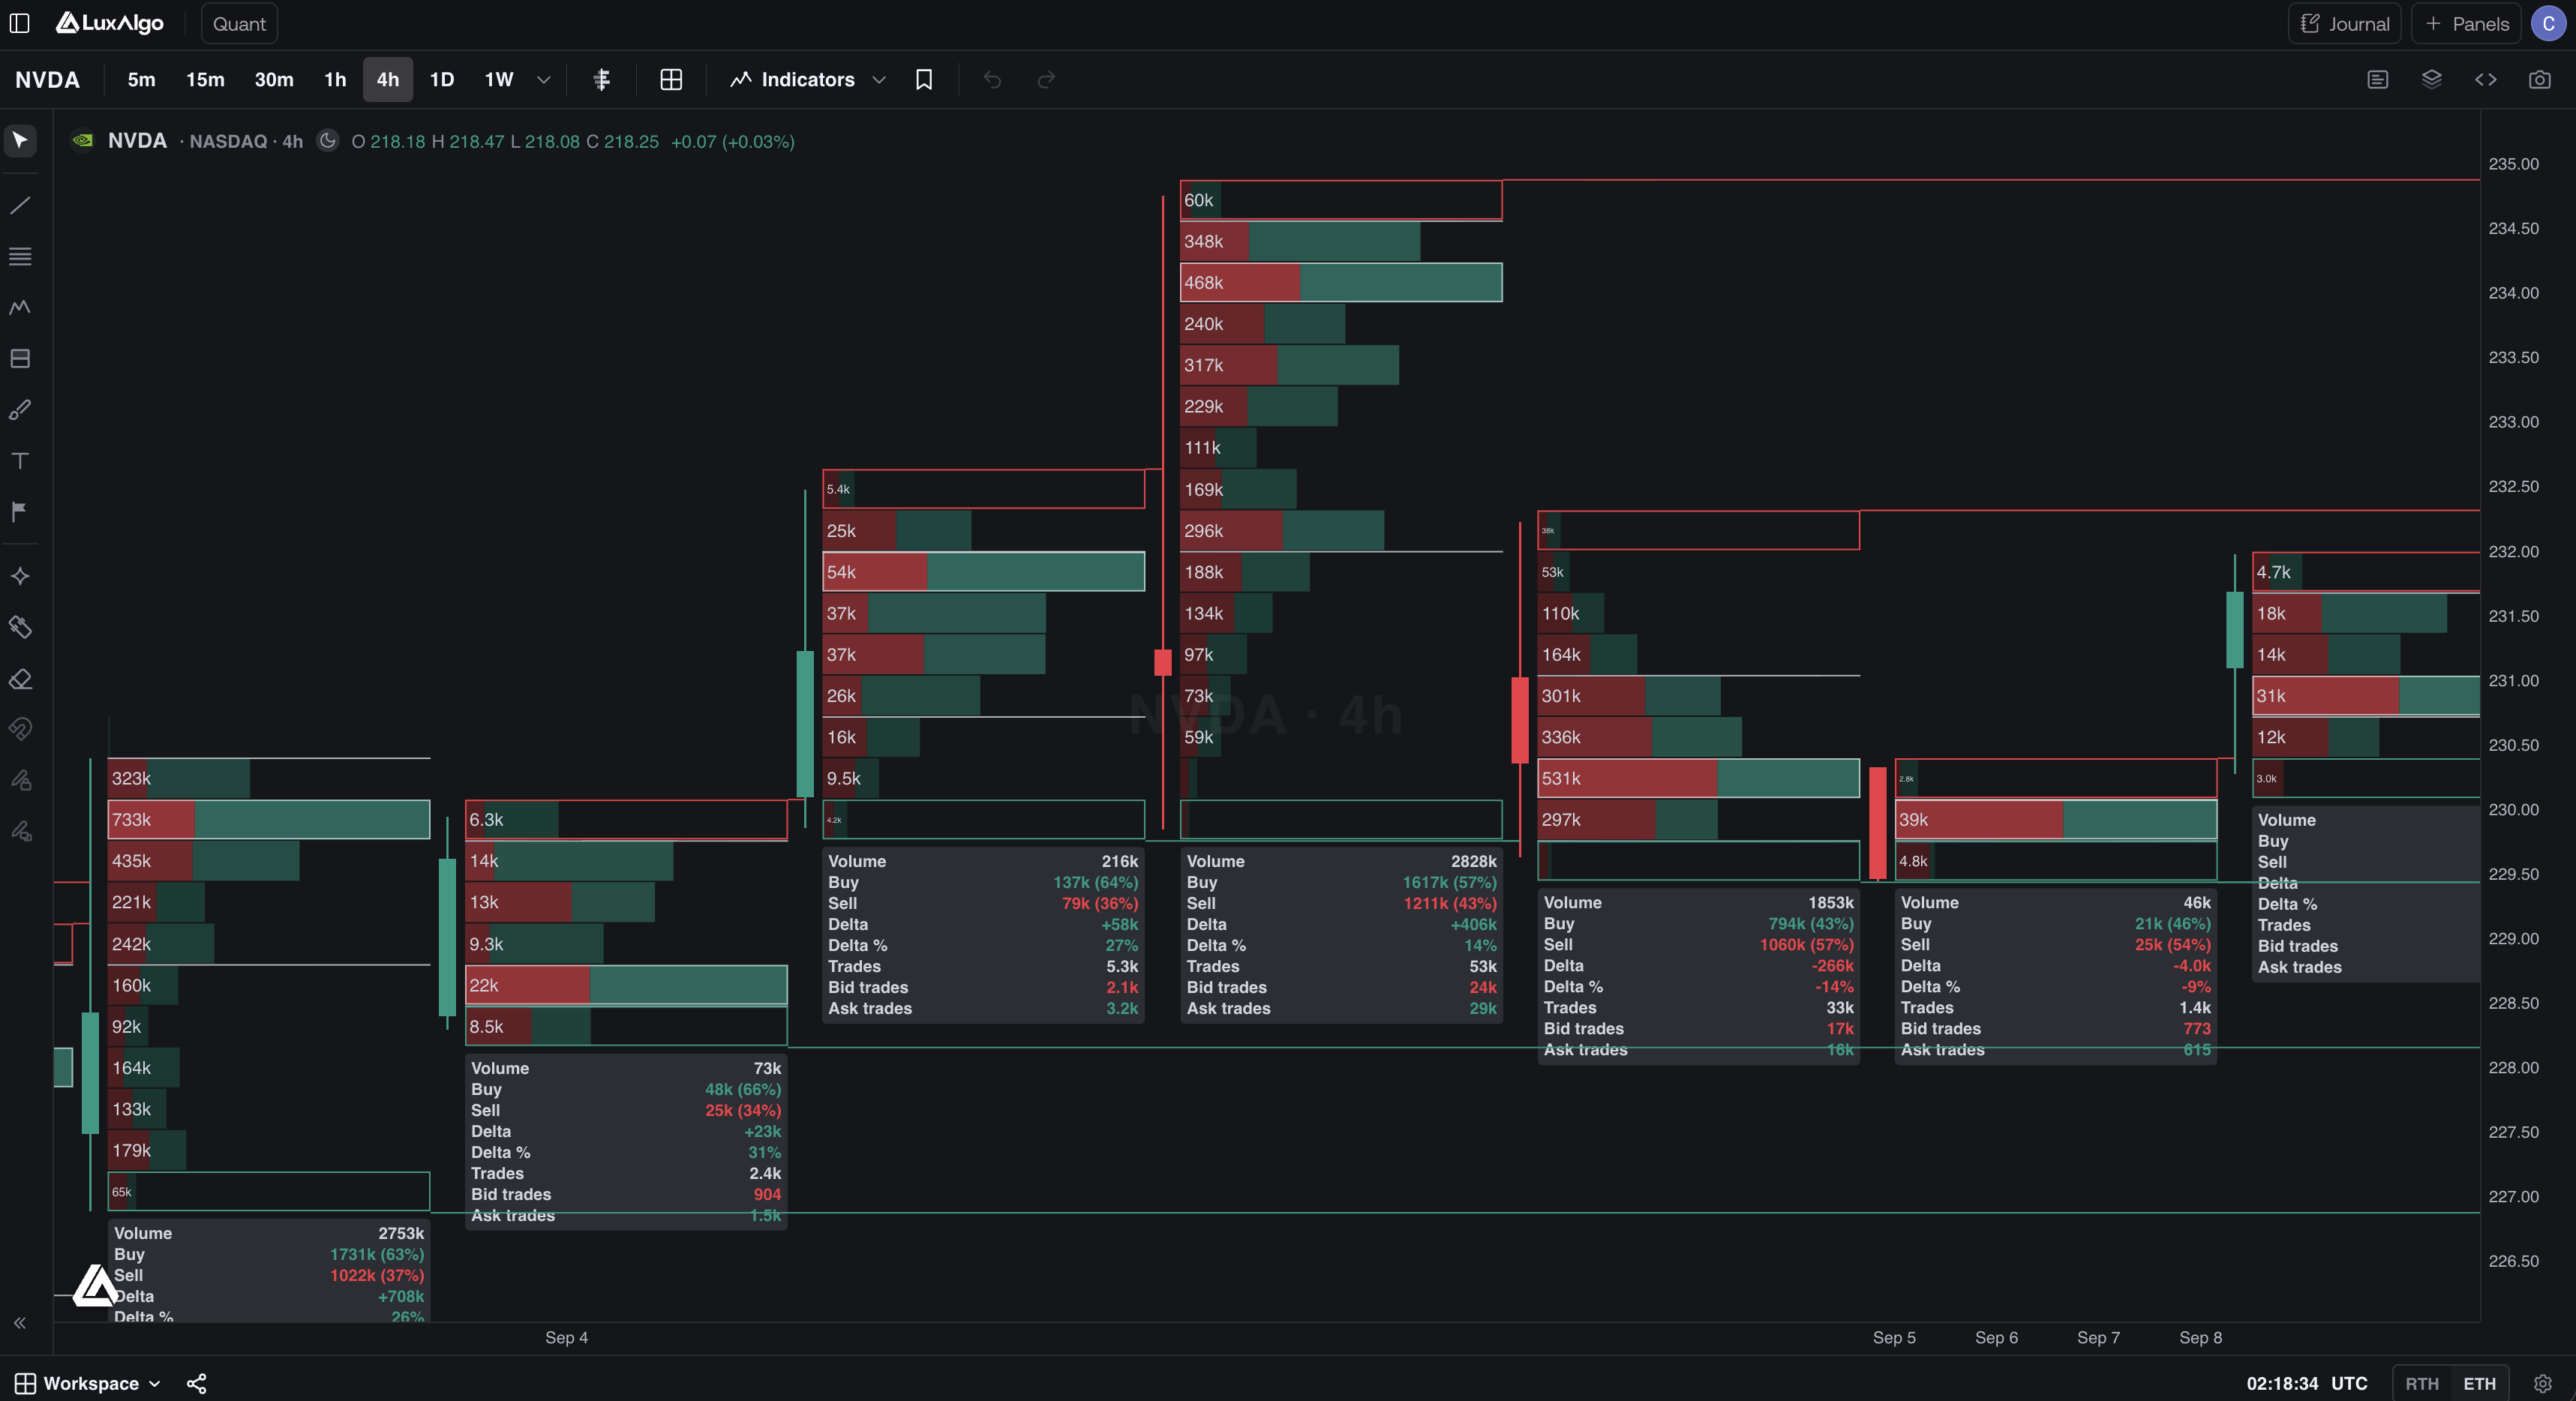
A footprint shows volume at each price inside a bar, split by aggressor side. Use it when you want to see where buying and selling actually traded, not only the candle.
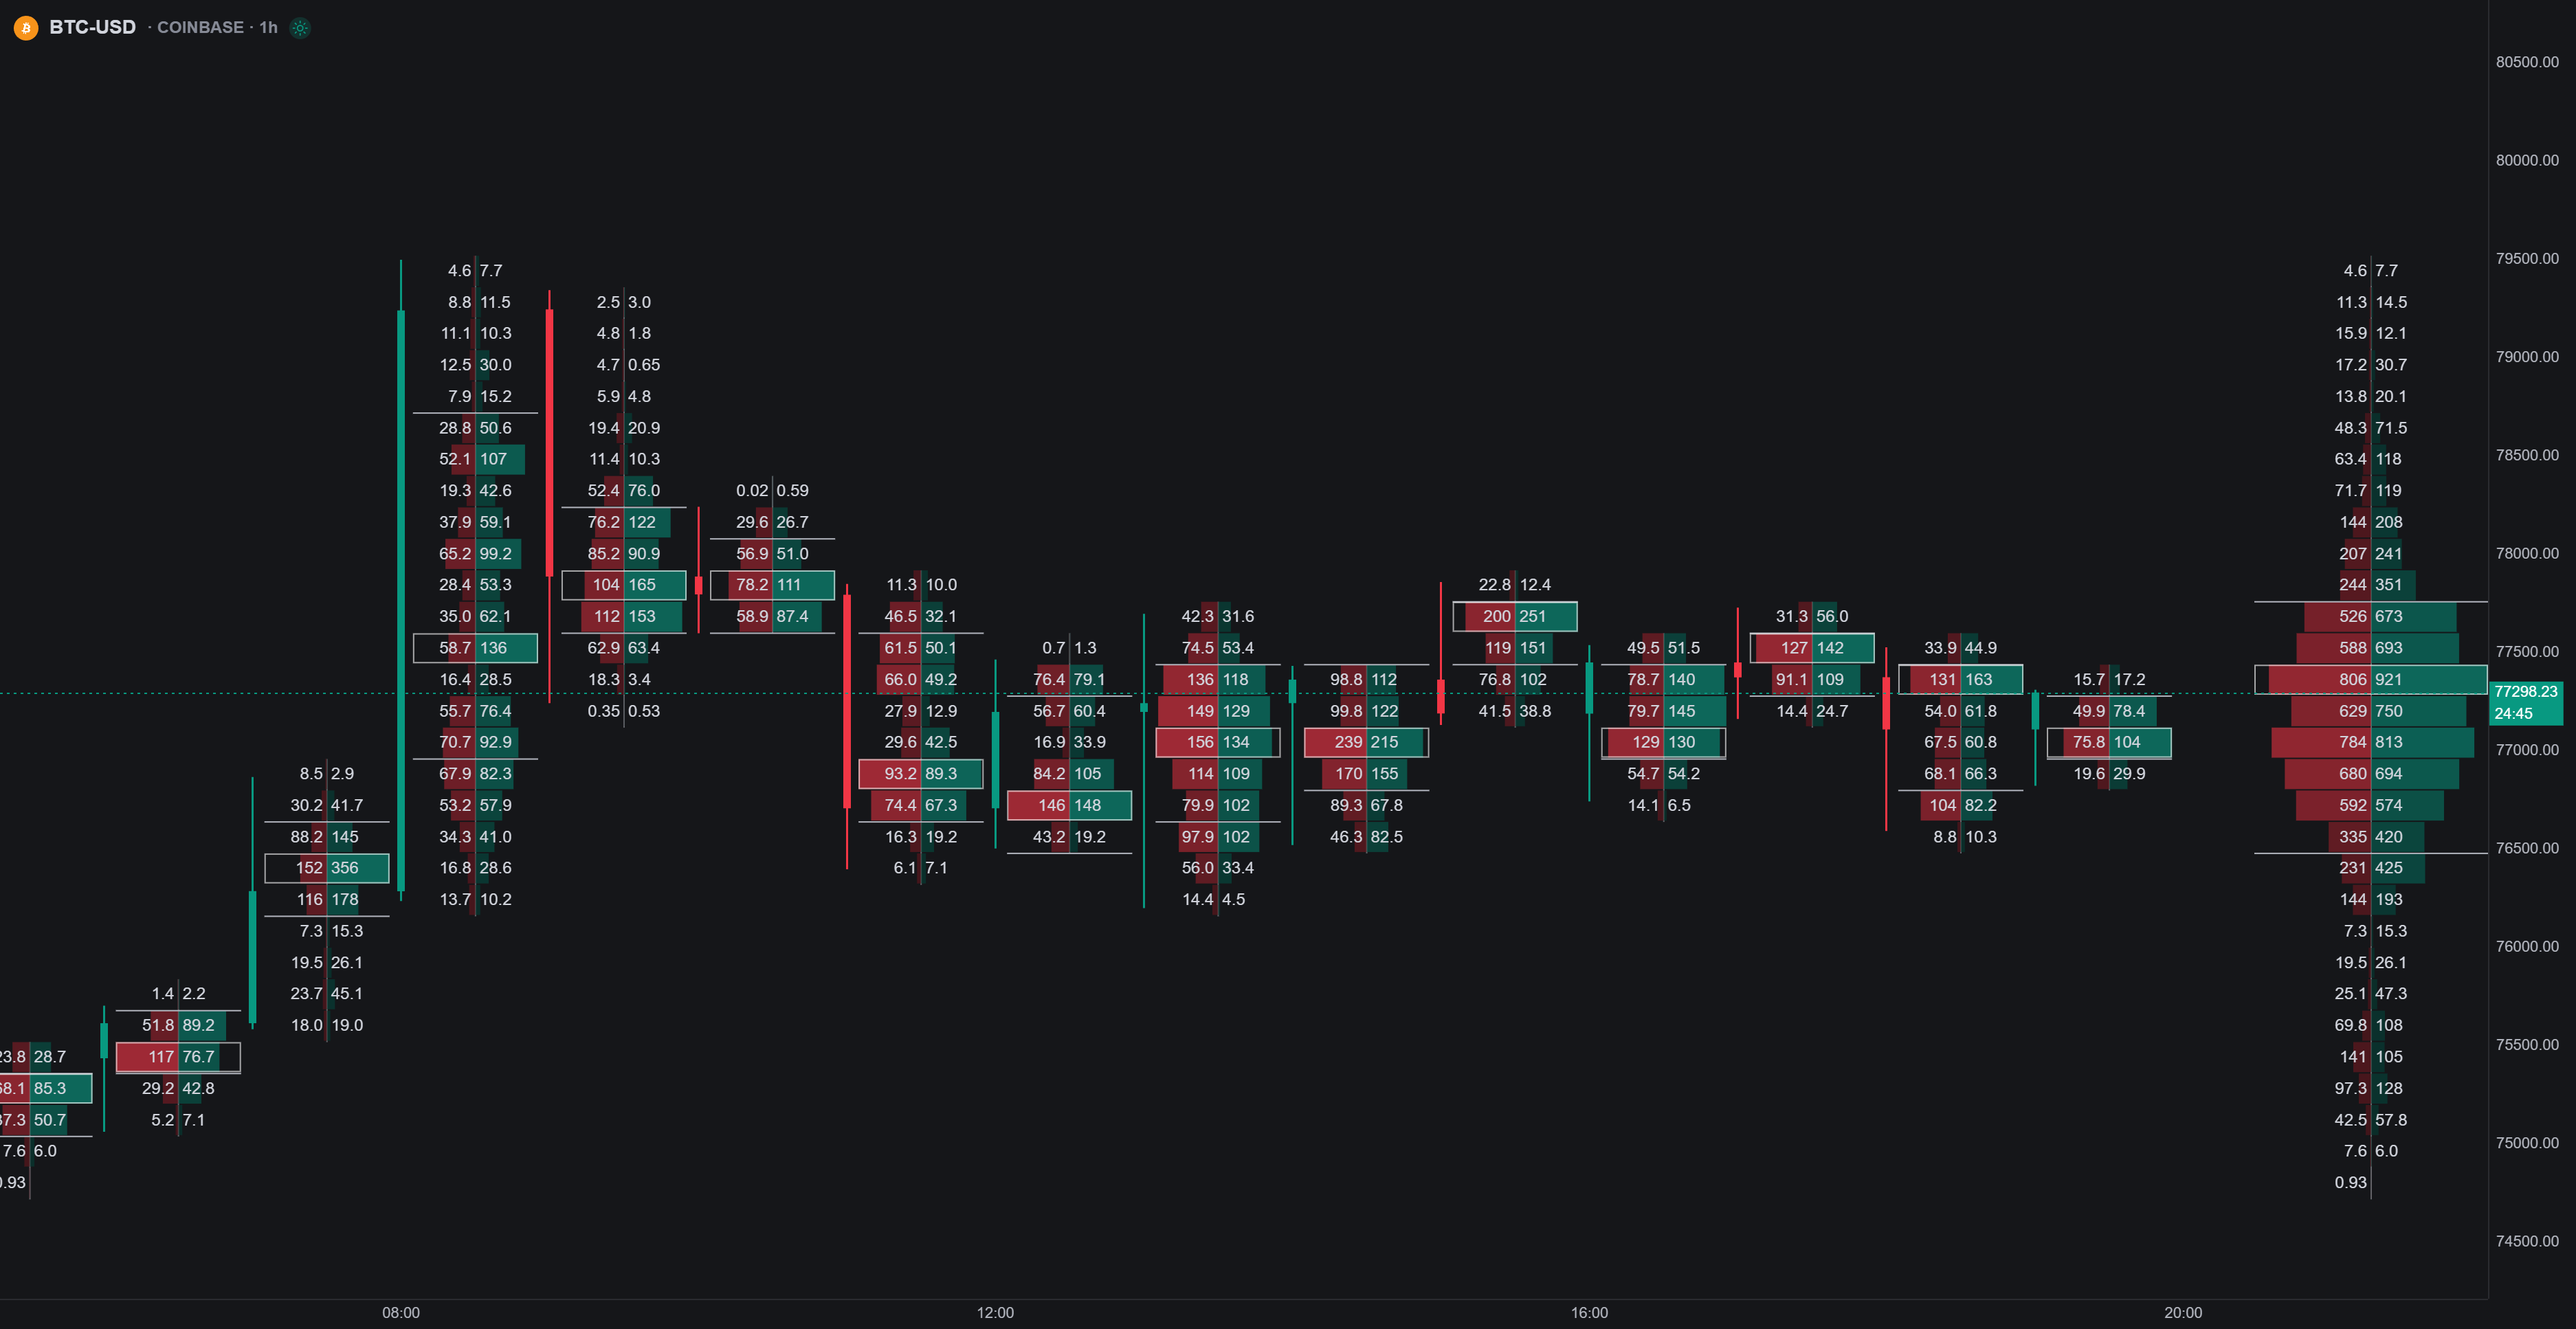
Footprints are built from pre-aggregated one-minute buy/sell volume-at-price slices and re-bucketed to whatever timeframe the chart shows, so every timeframe gets true per-price data. Needs a footprint-capable symbol; see Order Flow for plan lookback.
There are two ways to get a footprint on the chart:
- Chart type: switch the chart style to Footprint. The footprint is the chart, and you get the full feature set below, including up to five footprints per bar.
- Overlays: add Footprint or Visible Range Footprint from Indicators → Orderflow to keep candles and draw flow on top. Covered below.
Chart type
Switch the chart style to Footprint and open Chart settings for the Footprint tab (it appears while this style is active).
Multiple footprints per bar
The chart type can draw up to five independent footprints around each candle (Footprint 1 through Footprint 5), each with its own mode, position, and full set of options. Position places each one Right, Left, or Within the candle (one instance at most can sit Within). A typical setup: a Bid × Ask Profile on the right, a Delta Profile on the left.
On top of the per-bar instances, a Visible range section adds a single aggregate profile pinned to the right edge of the chart, summing every bar currently on screen. It has its own copy of the settings and is always drawn at full opacity regardless of zoom.
Display modes
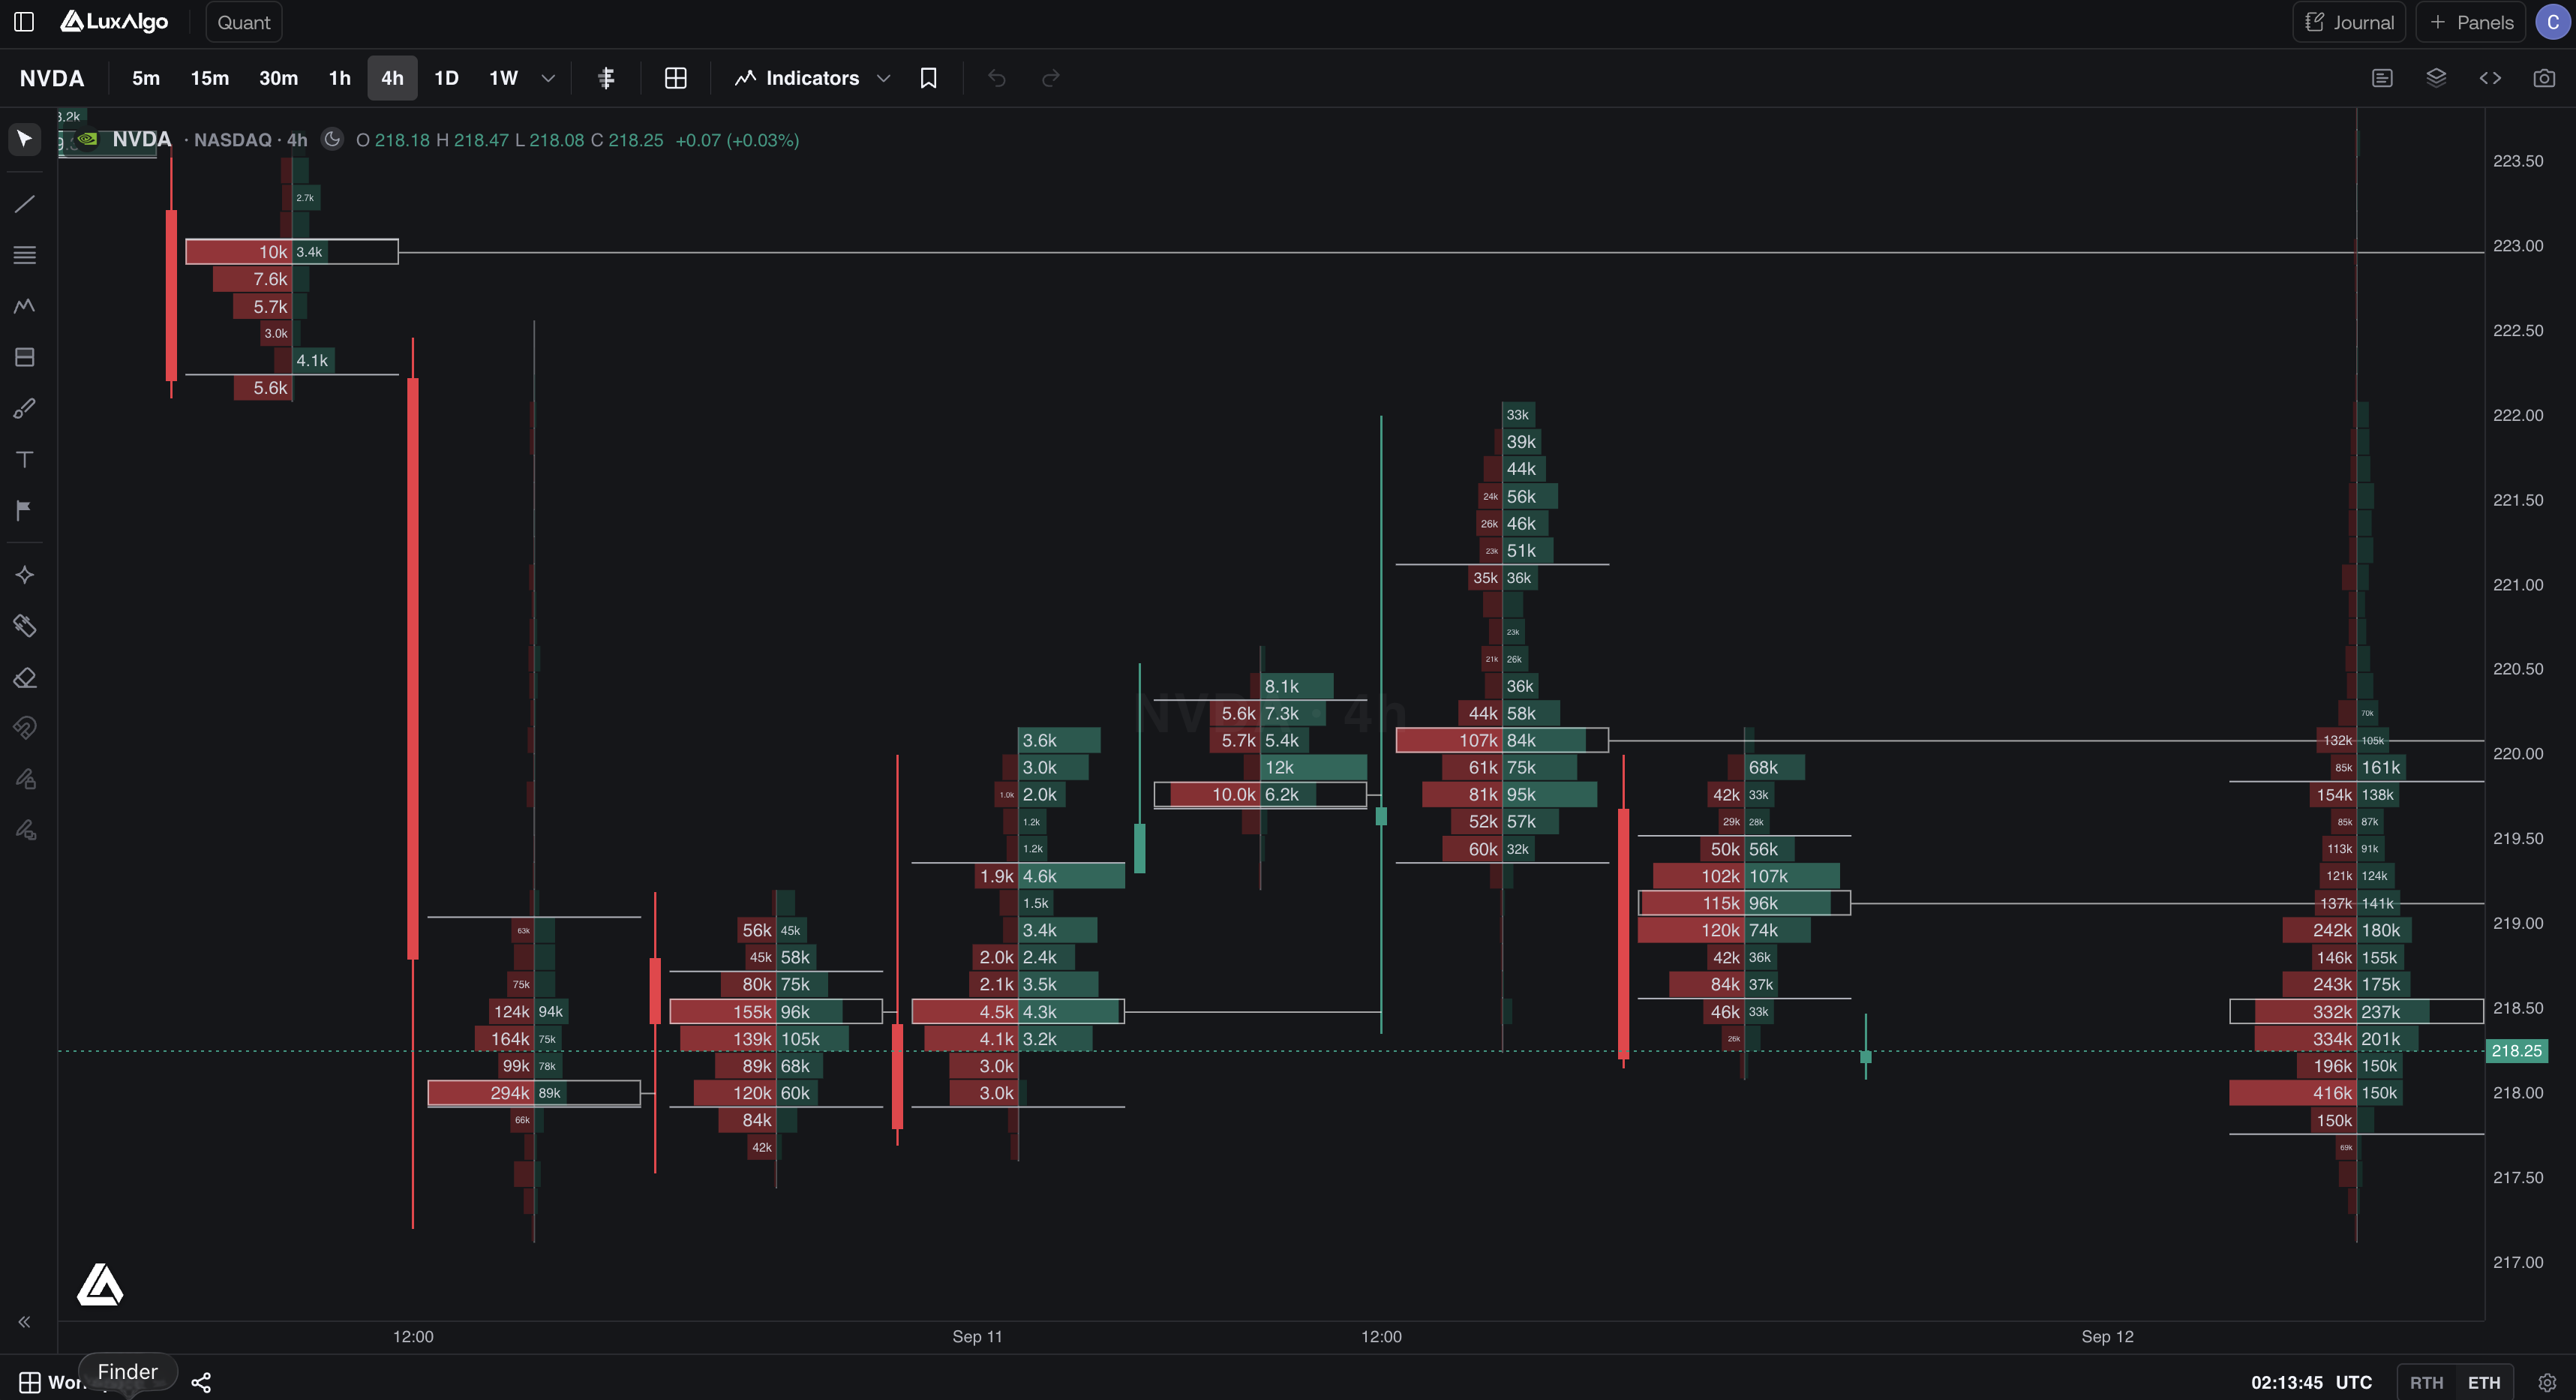
Bid × Ask Profile. Sell (bid) bars grow left of a central axis, buy (ask) bars grow right: the classic two-sided profile.
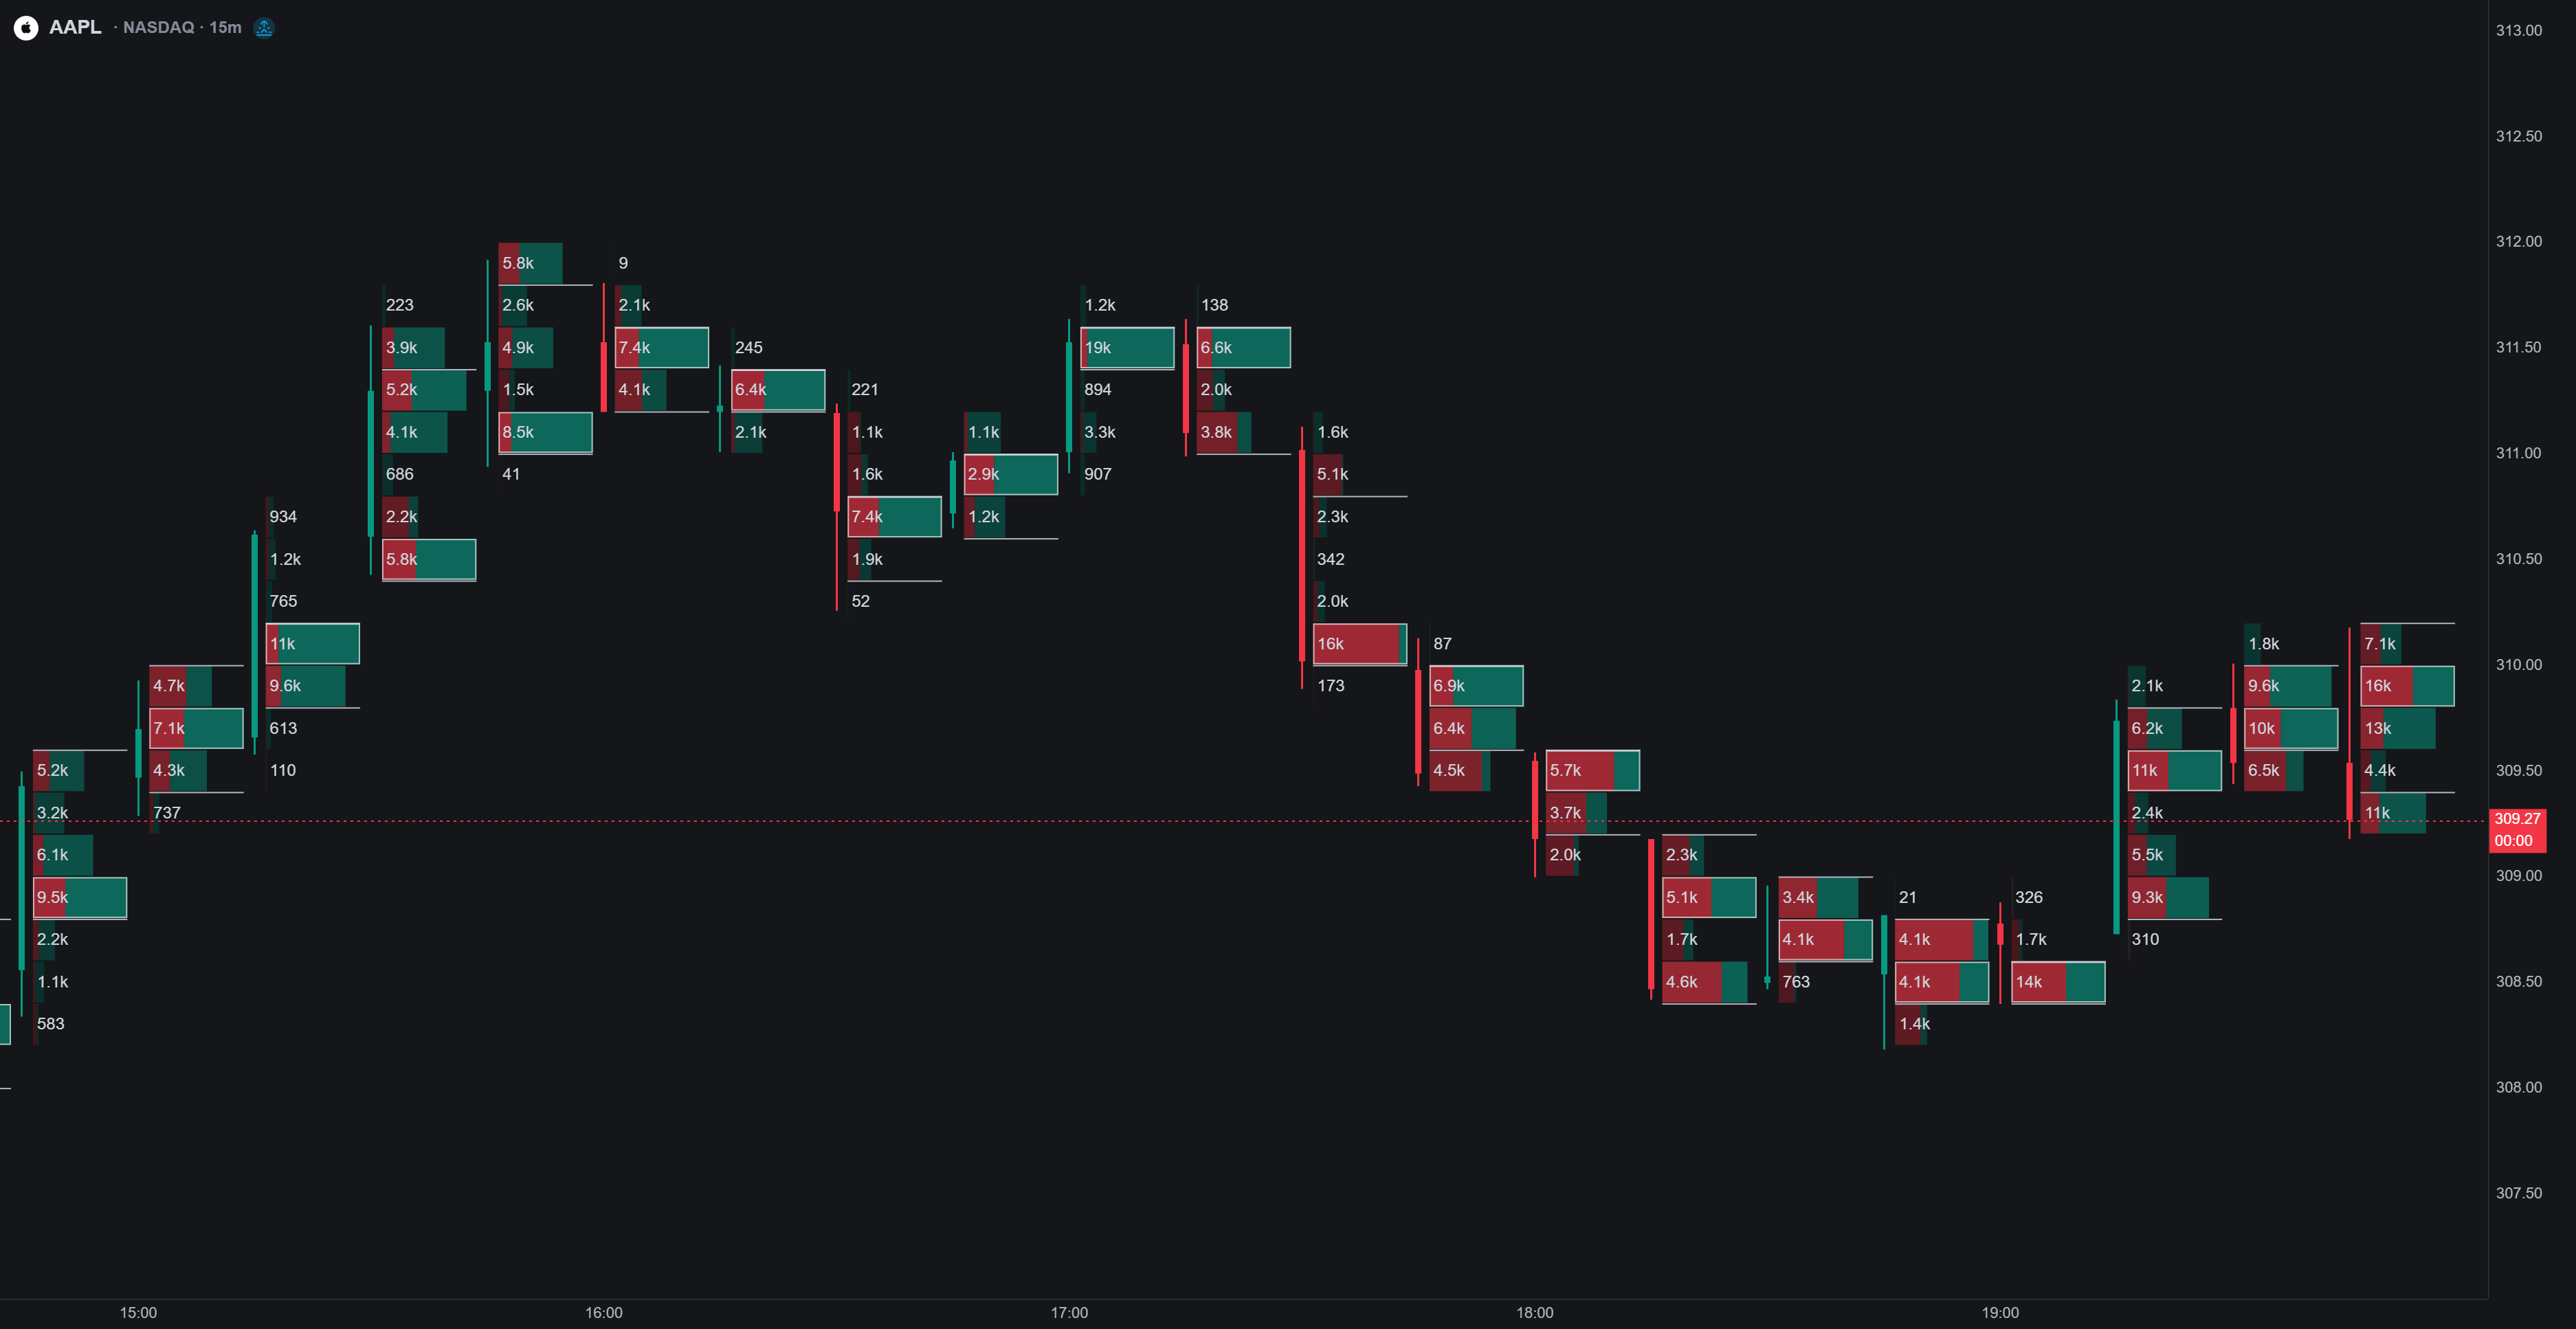
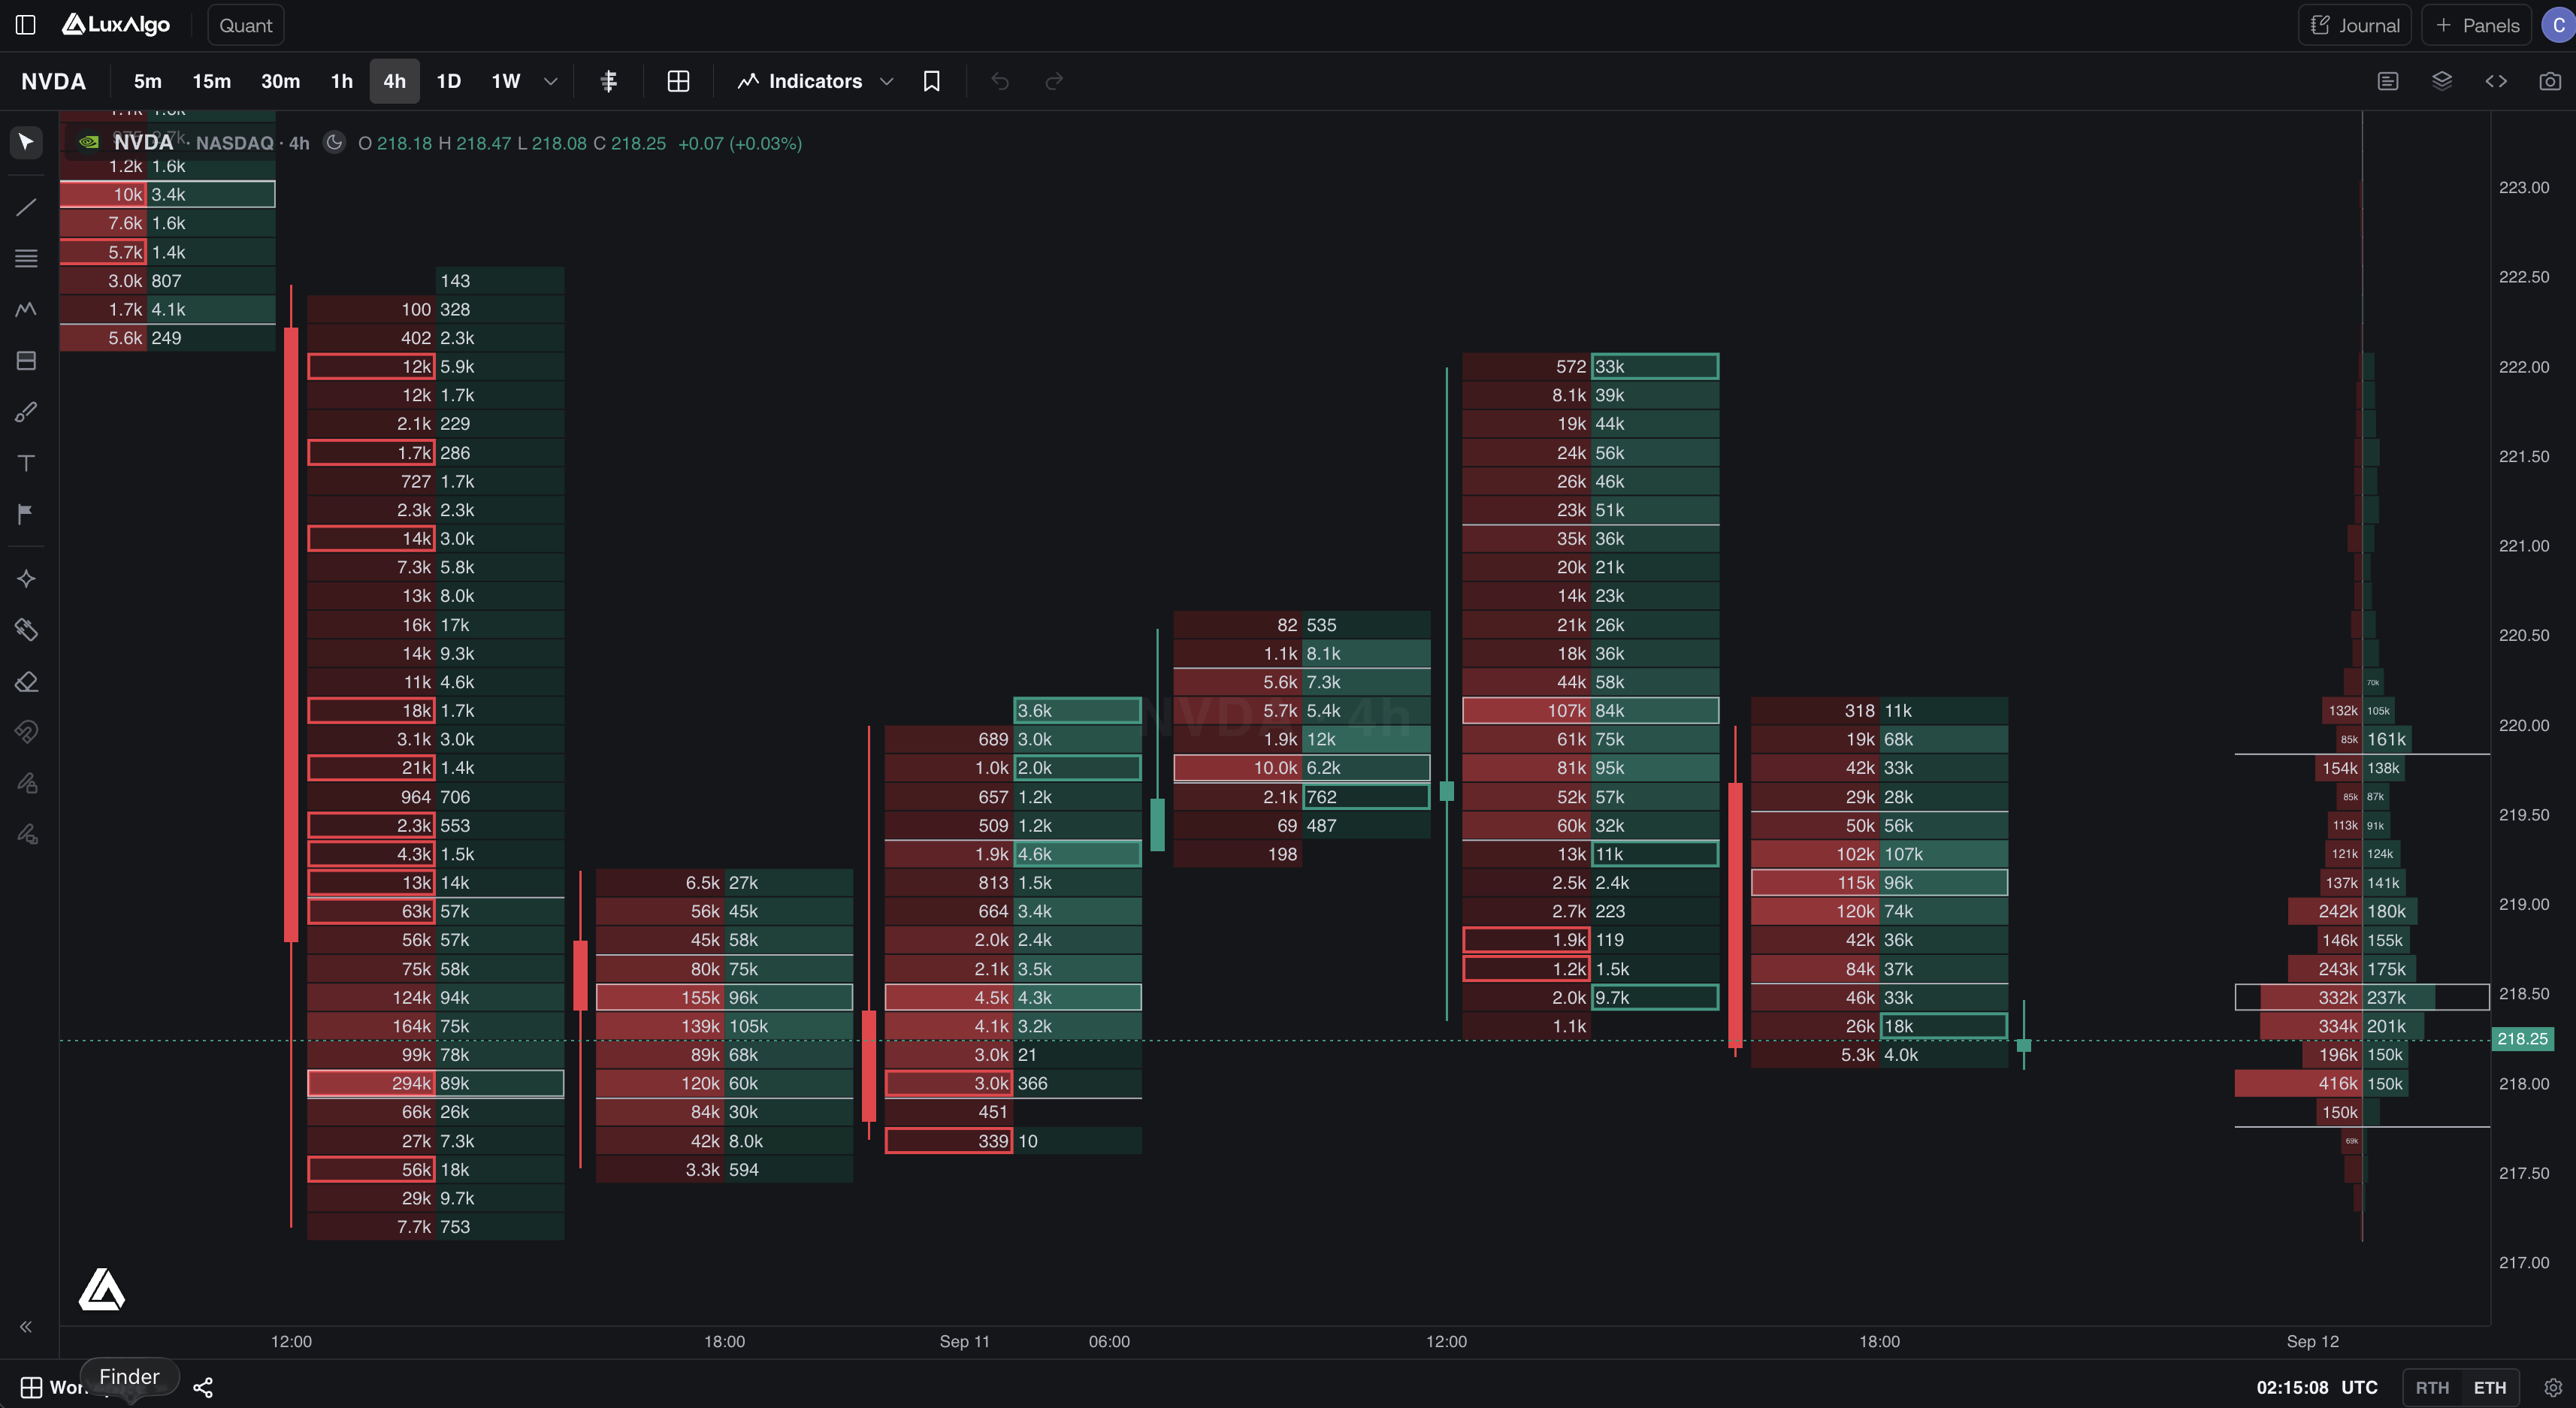
Bid × Ask Ladder. Two adjacent columns of cells, one per side, with background intensity showing size: a spreadsheet-style ladder.
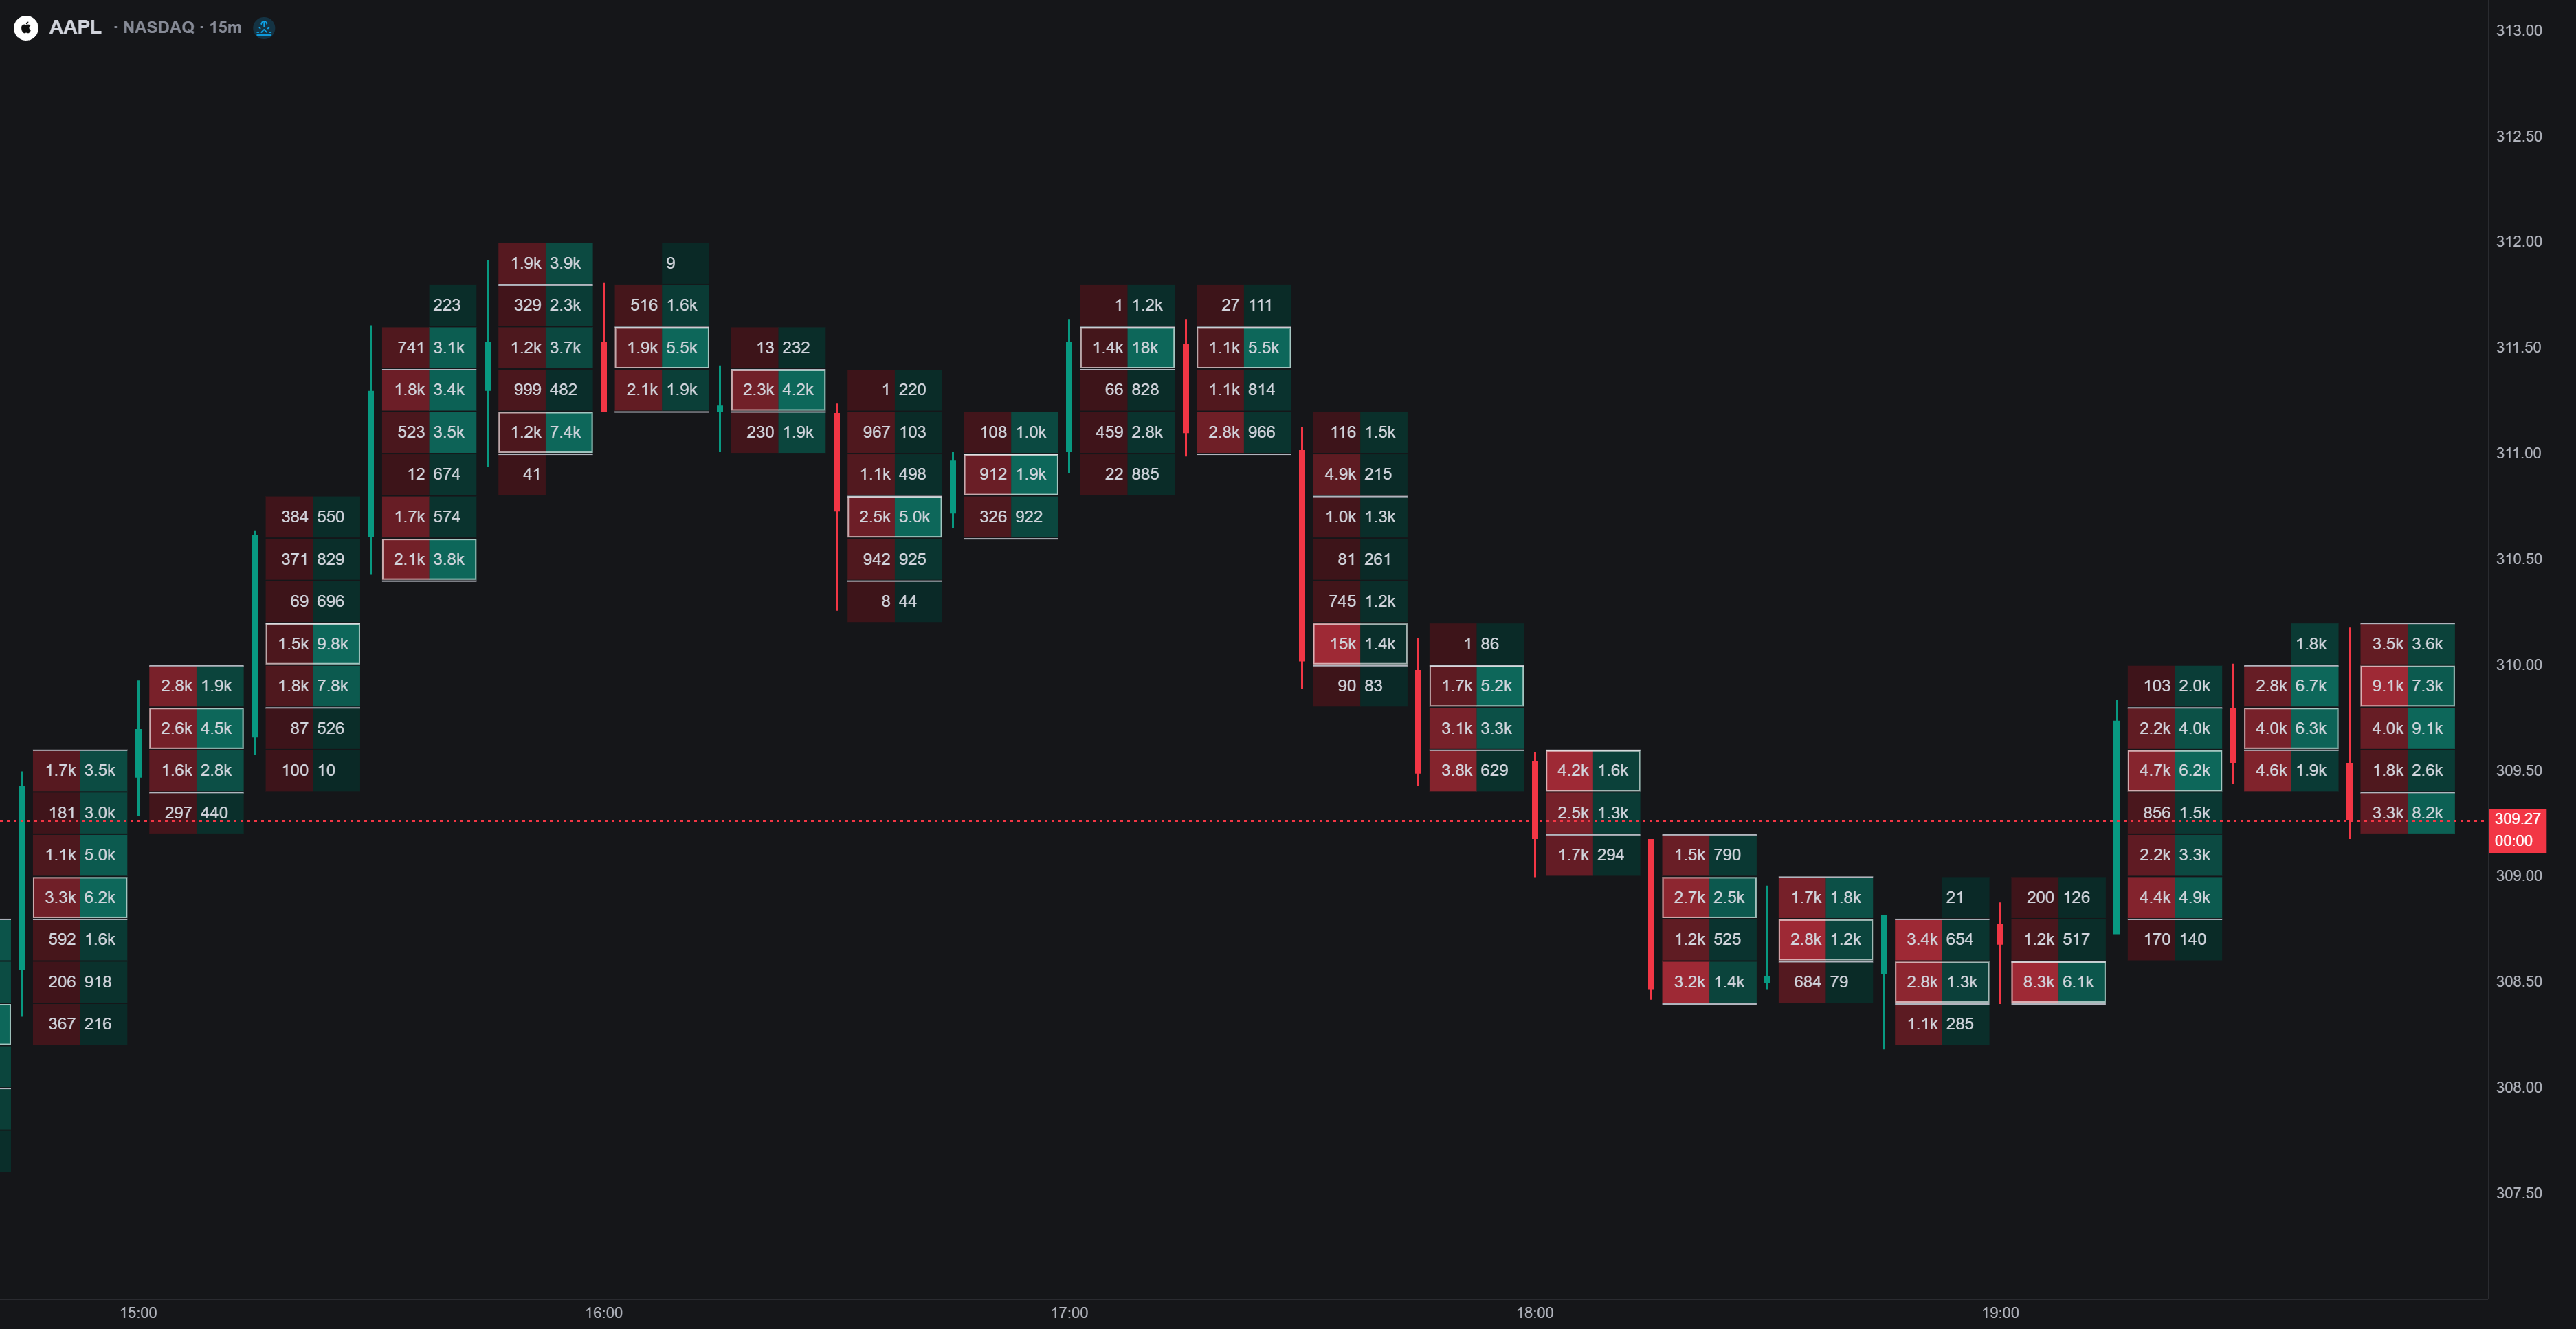
Volume Profile. Total volume per price row, either split into buy/sell segments or as a single mono ramp.
Delta Profile. Rows grow from a centered zero line: net selling extends left, net buying extends right.
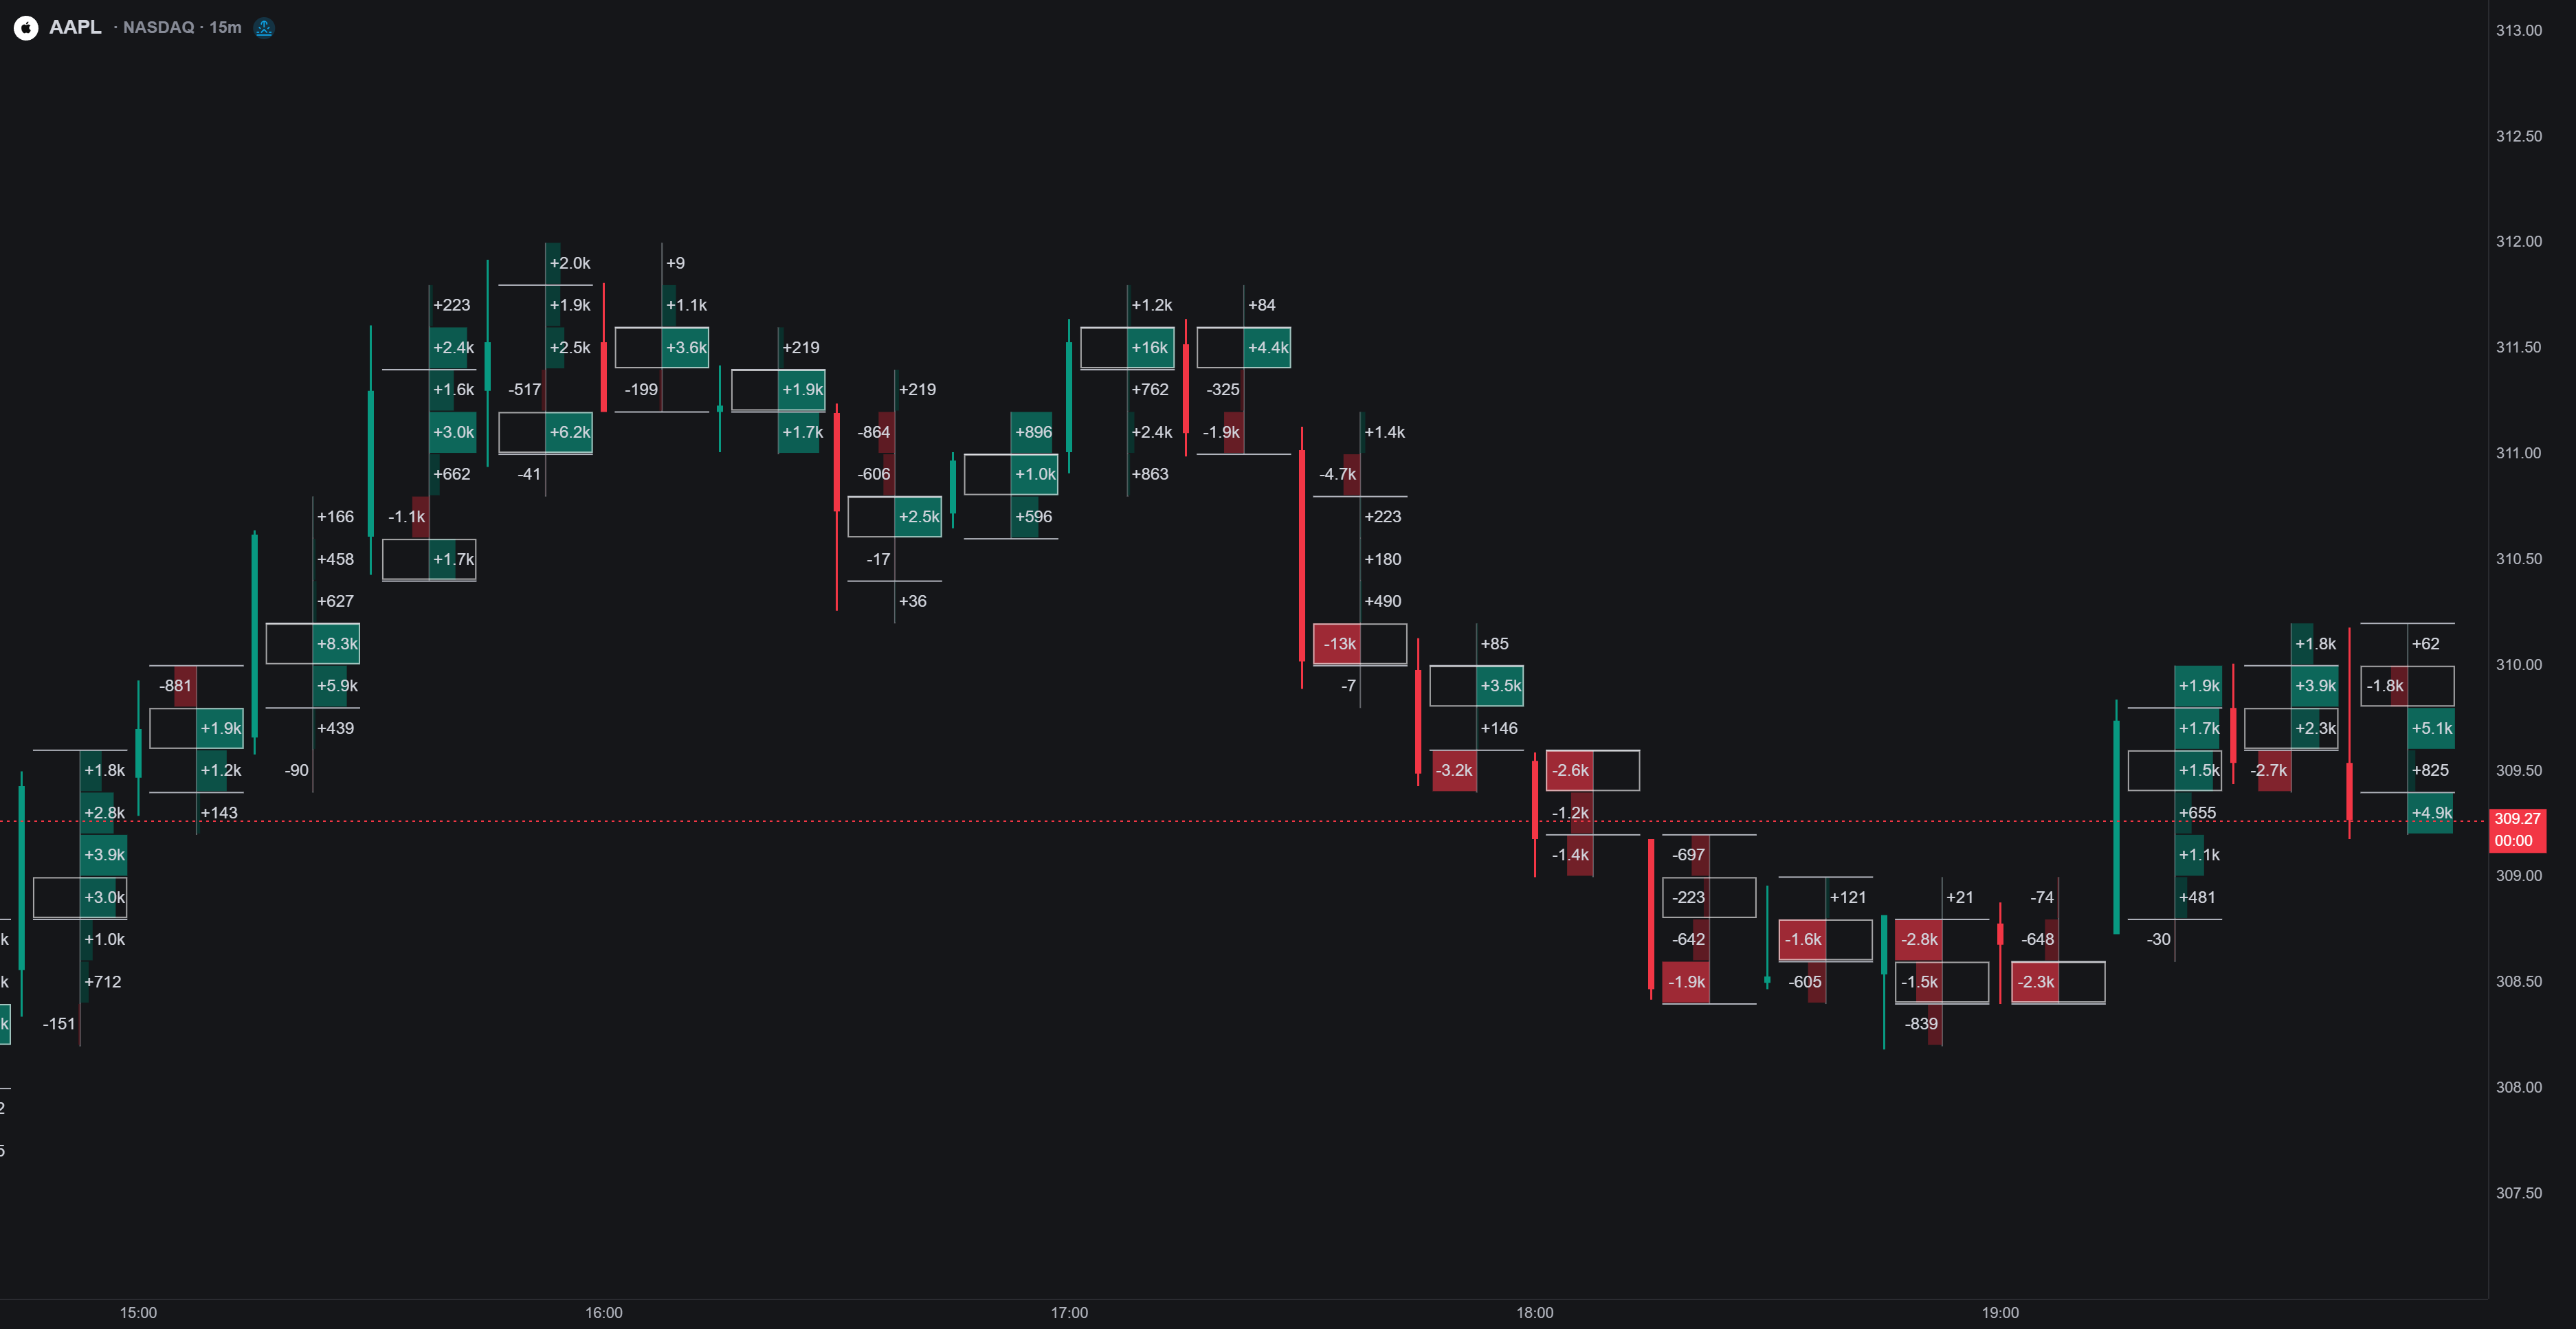
Absolute Delta. The magnitude of each row's delta as a bar from the left, colored by delta sign.
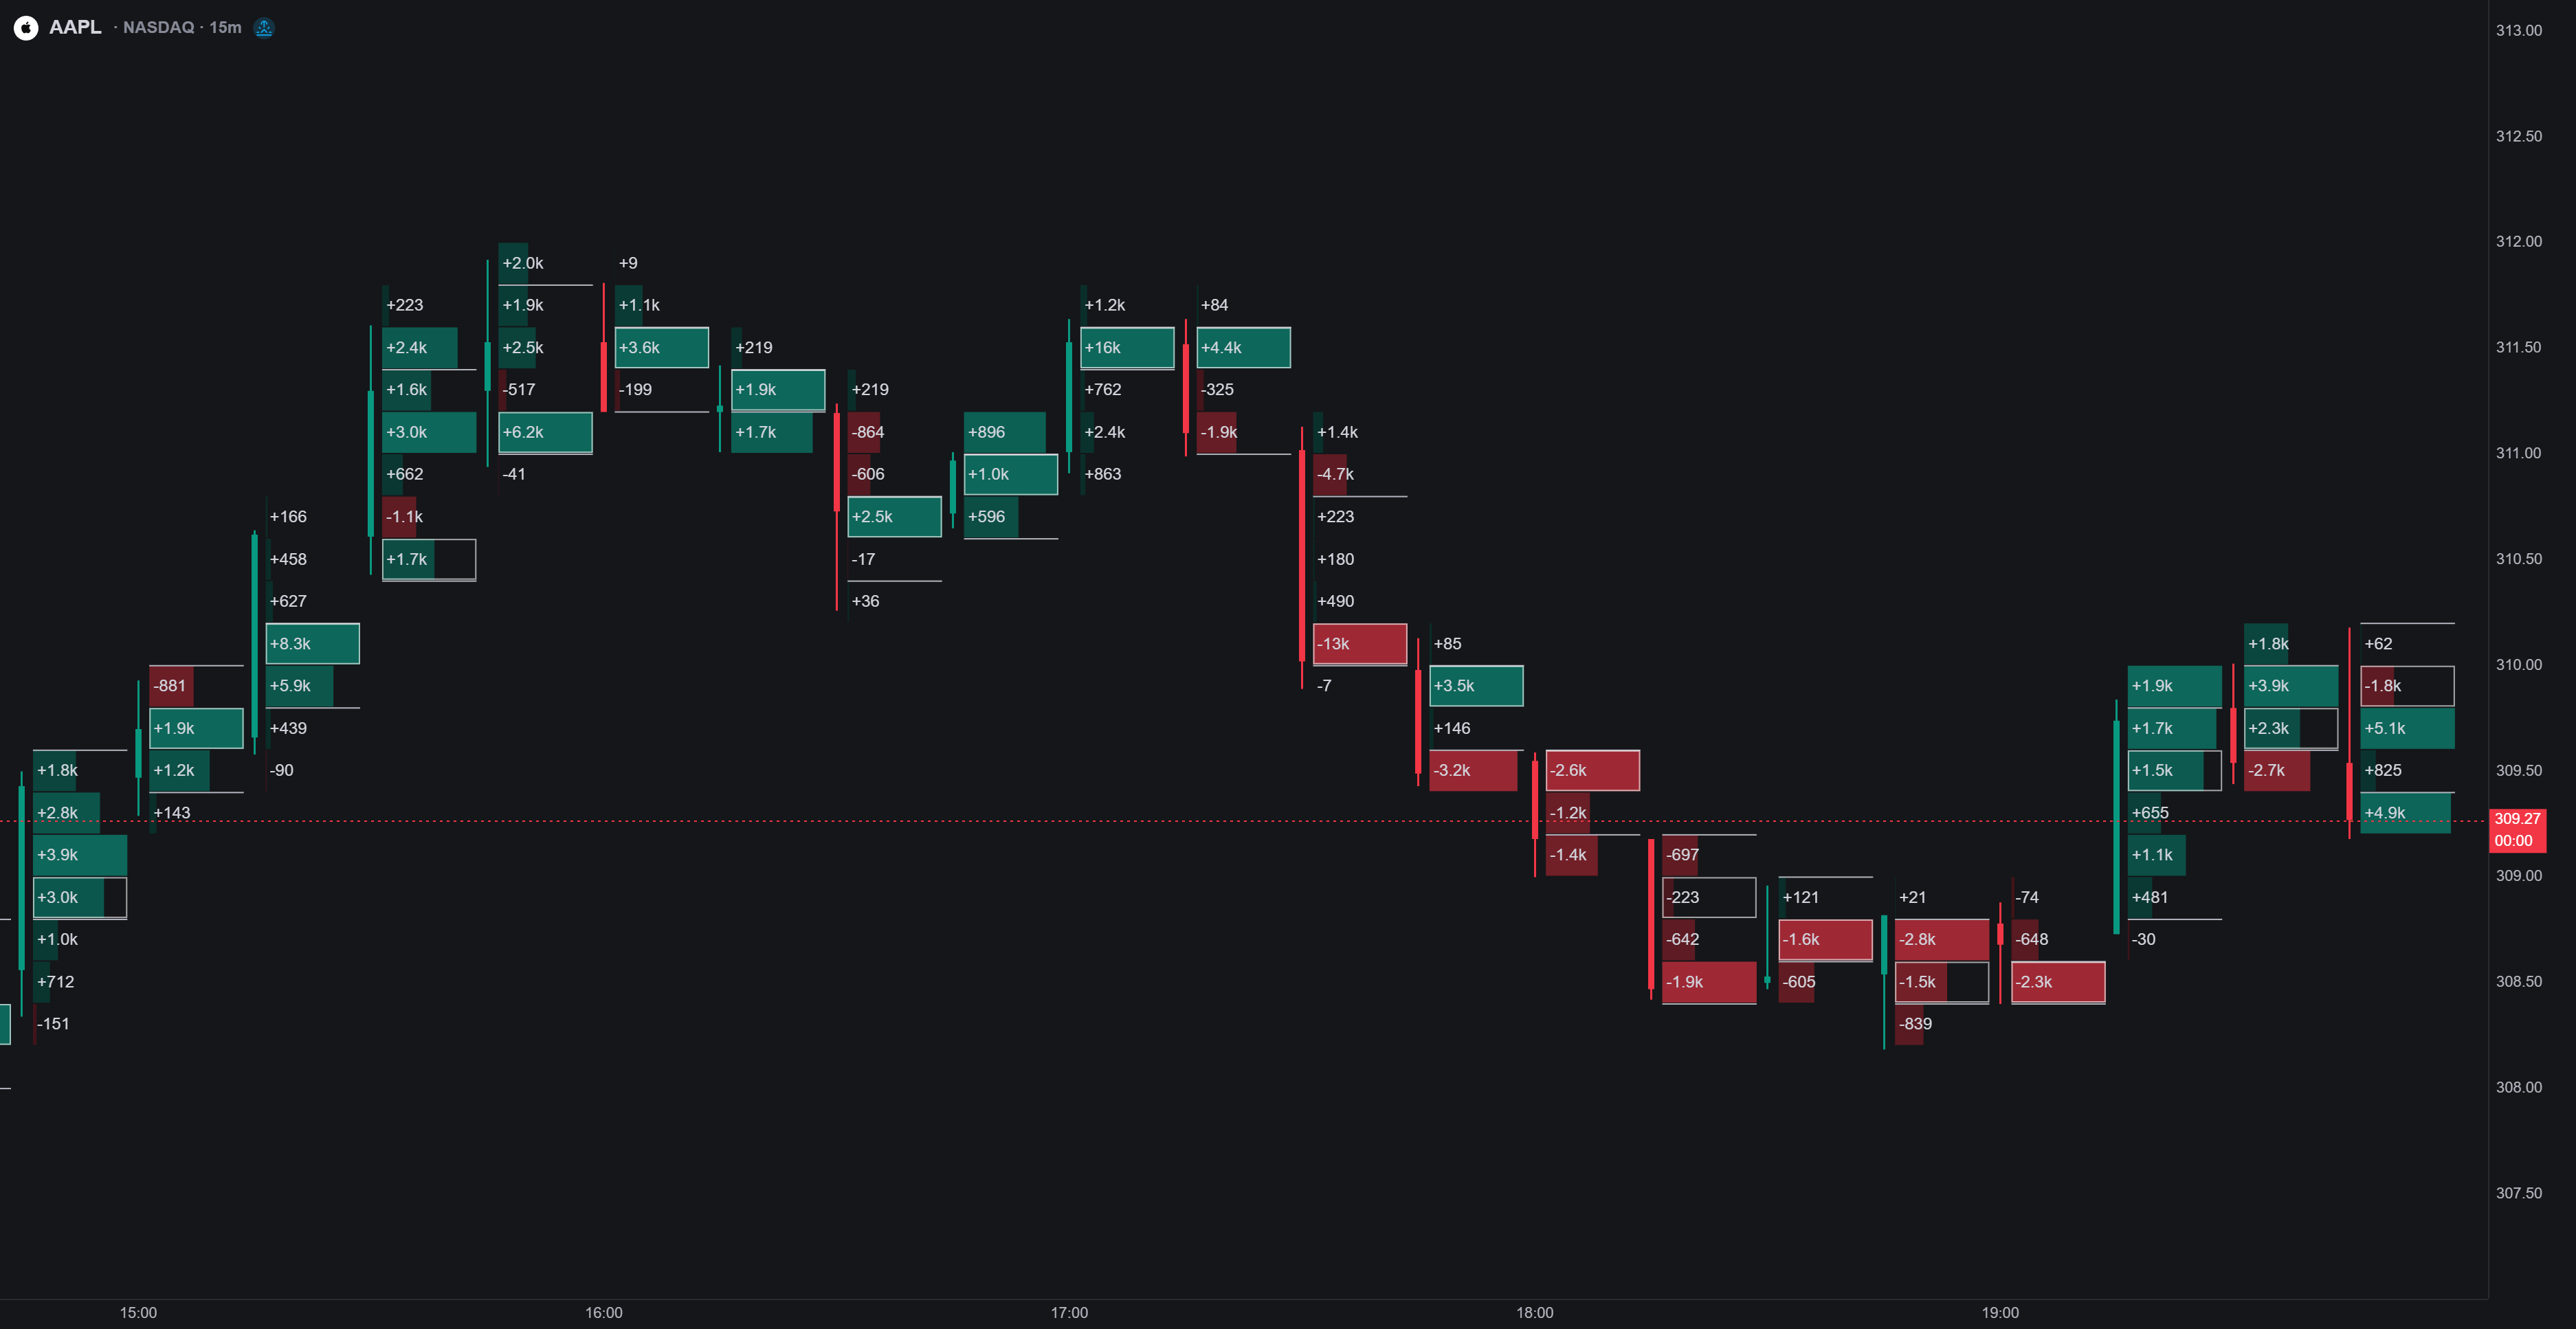
Cell values controls the numbers printed in the rows: Auto (matches the mode), Bid × Ask, Total, Delta, Trades, or Bid × Ask Trades. The trade-count values need count-carrying data; where a bar predates it, counts show as a dash rather than a fake zero.
Average trade size rebuilds every cell as volume ÷ trade count per side, showing who traded larger rather than who traded more. Number readouts still show raw volume; only the bar shapes change.
Row size is Auto by default: rows merge as you zoom out so each stays readable, and imbalance/auction flags are recomputed on the merged rows so highlights always agree with the numbers on screen. Manual pins a fixed Ticks per row (1–64).
Zoom behavior
The footprint fades with zoom: fully drawn when bars are wide enough, cross-fading down to plain candles as you zoom out, so the chart stays readable at every scale. While the footprint is visible, candle bodies slim down (or fade, for a Within instance) to keep the cells legible. The visible-range profile is exempt: it stays drawn at any zoom.
Value area and POC
- Value area outlines the price band holding a set share of the bar's volume. Value area (%) defaults to 70, expanded outward from the POC.
- Point of control outlines the single highest-volume row of each bar.
- Extend POC until broken projects a ray from each bar's POC to the right, until a later bar trades through that level. A POC that never gets revisited (a naked POC) runs all the way to the newest bar, marking untested acceptance levels.
Imbalances
An imbalance flags one side dominating the other diagonally, the way order-flow traders read it: buying at a price is compared against selling one tick below; selling at a price against buying one tick above.
- Imbalance highlight outlines imbalanced cells; Ratio (%) sets the threshold (default 300%, i.e. one side at least 3× the diagonal other).
- Recolor values tints the numbers of imbalanced cells instead of (or in addition to) outlining them.
- Stacked imbalances upgrades runs of consecutive same-side imbalances (Min stacked rows, default 3) into a filled zone that extends right until price trades back into it, turning single prints of aggression into standing support/resistance zones.
Unfinished auctions
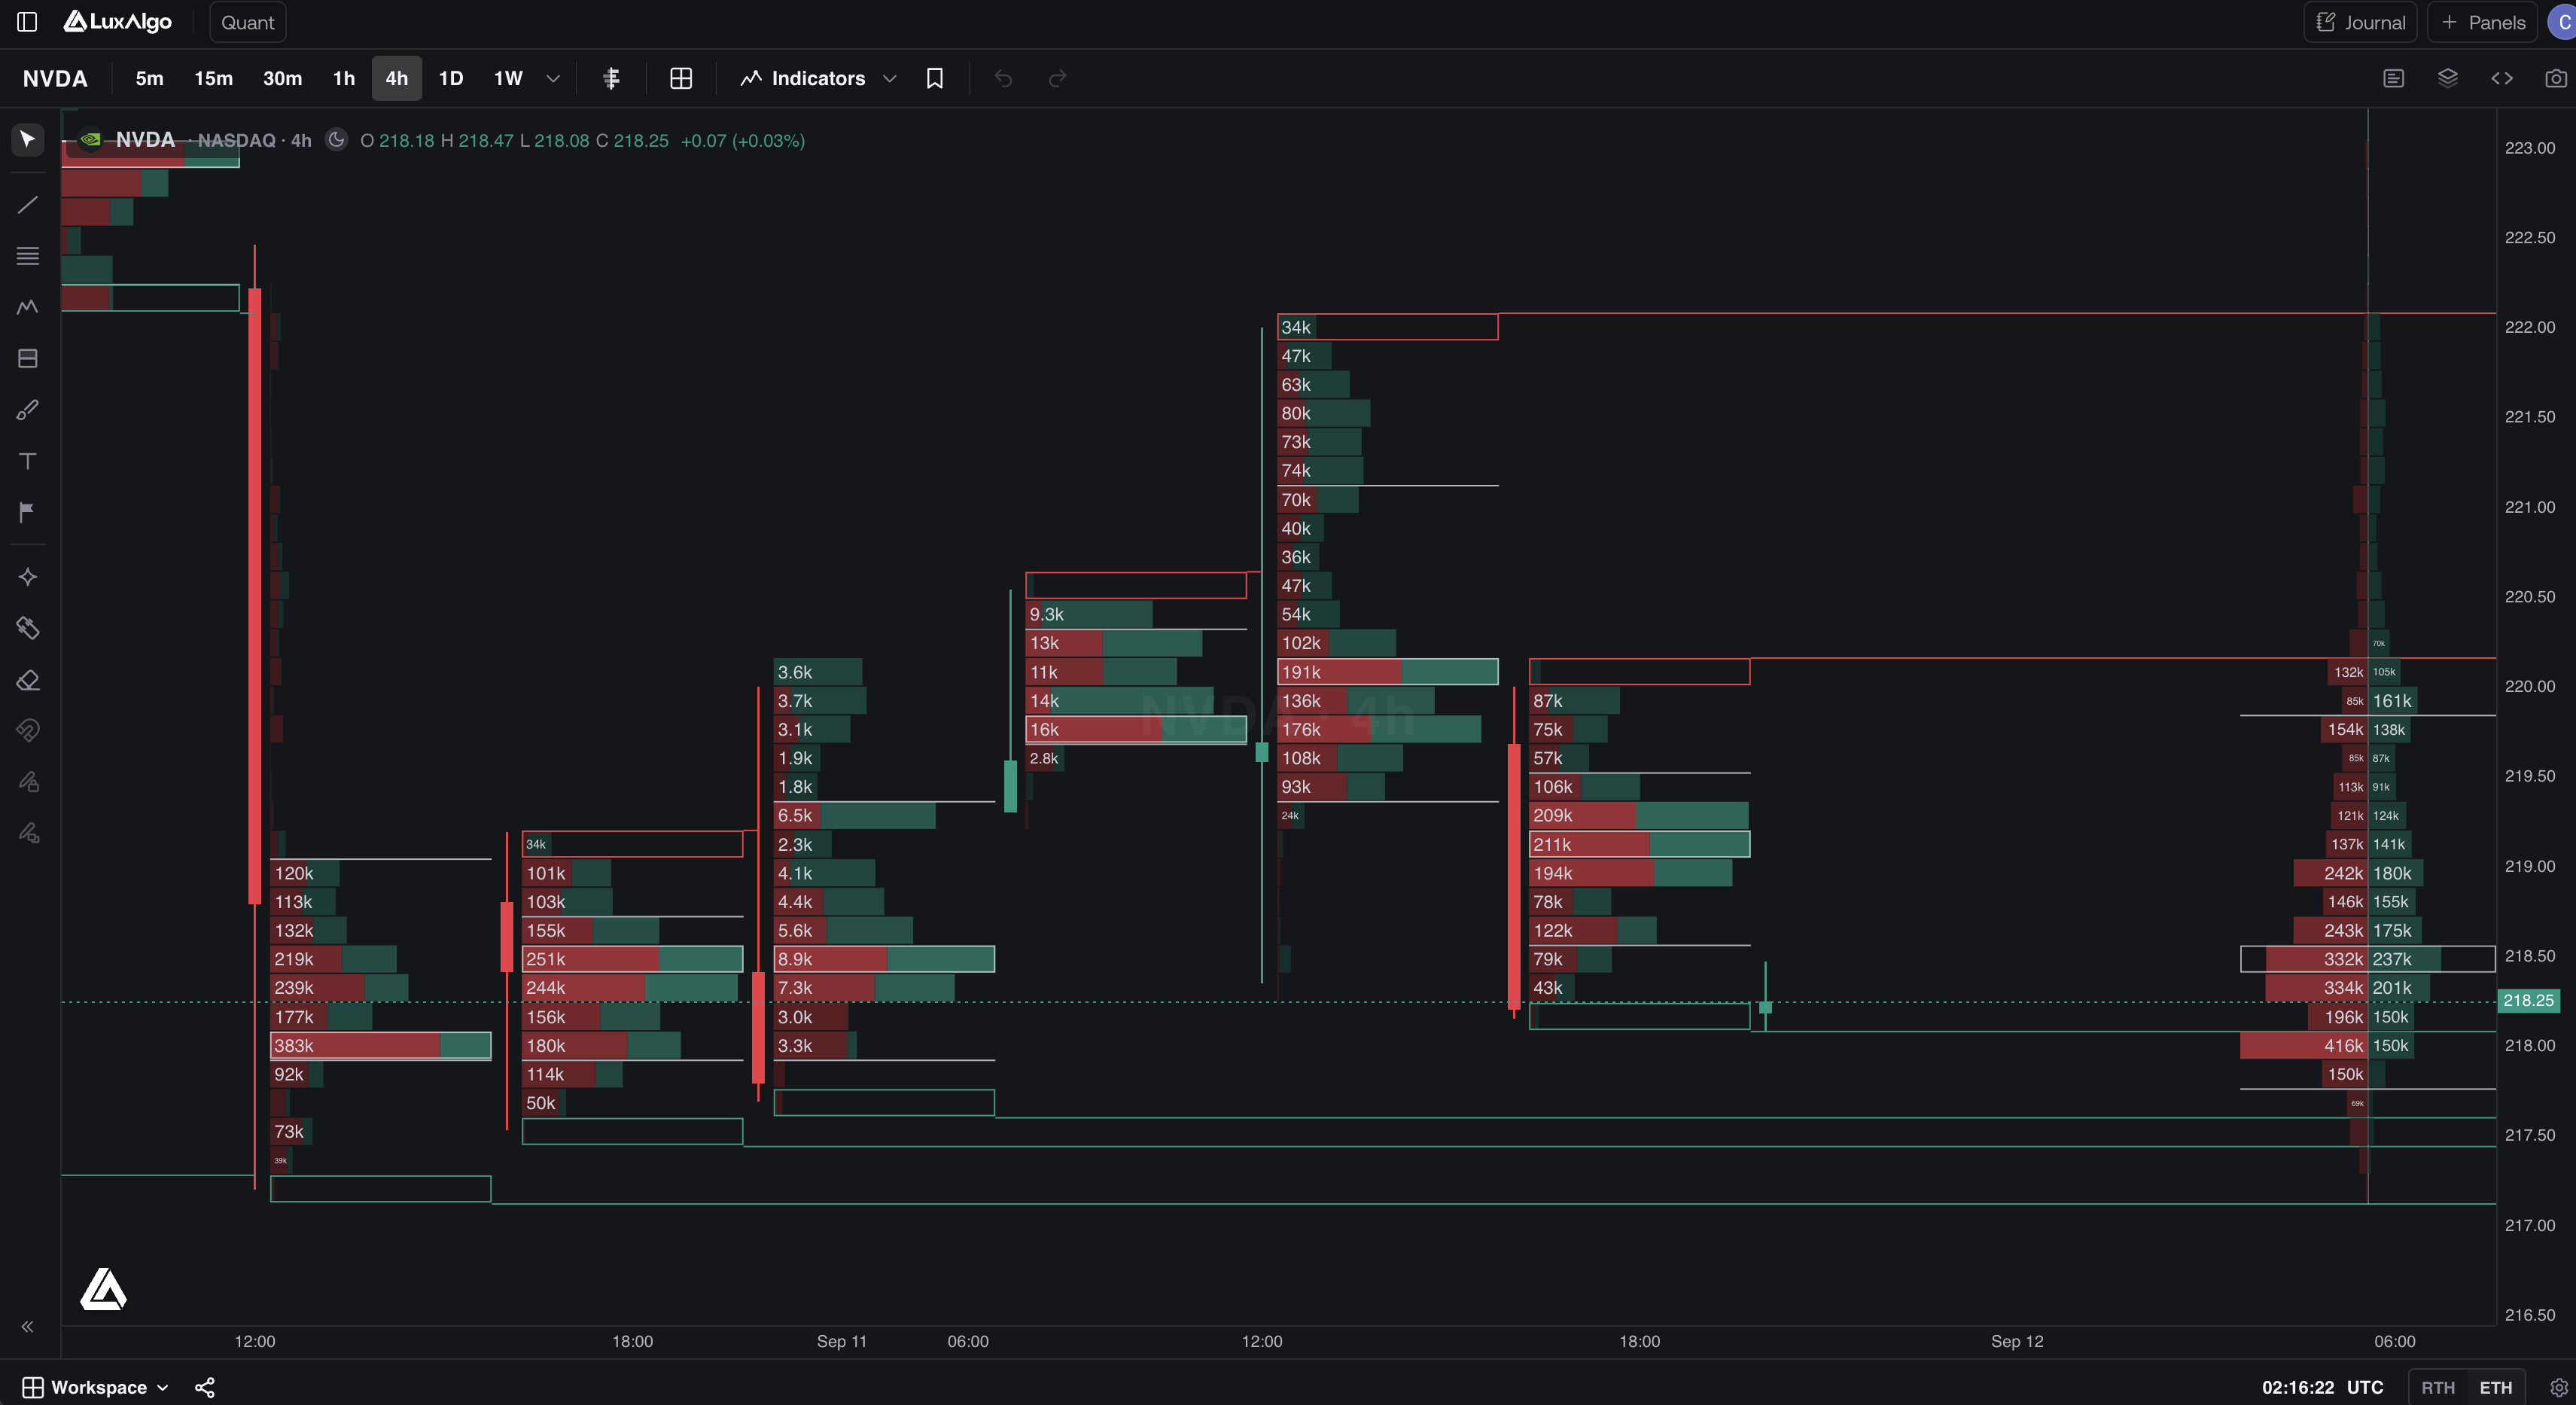
A bar's high or low where both sides still printed at the outermost level is an unfinished auction: the auction didn't terminate cleanly, and price is often expected to revisit the level. Enable Unfinished auctions to outline those extremes, with Min volume per side to ignore dust and Extend until revisited to project a ray rightward until a later bar returns to the level.
Stat table
The Stat table prints a per-bar summary strip Below or Above the chart. Toggle exactly the rows you want:
Total volume, Buy volume, Sell volume, Buy %, Sell %, Delta, Delta %, Trade count, Bid count, Ask count.
Defaults show total volume, delta, and delta %, enough to scan pressure bar by bar without opening a single footprint. For the same totals across history, use Bar Stats.
Filters
Three min/max filters (Volume, Bid volume, Ask volume) blank out rows outside the range while keeping their slot in the profile, isolating only the size you care about (0 = off).
Reading tools
- Hover a row for a readout of its price range, bid × ask split, total volume, and delta.
- Hold Shift while hovering to open a magnifier that re-renders the hovered cells and their neighbors at enlarged scale, the fast way to read a dense footprint without zooming the whole chart.
- Right-click the footprint for quick toggles: Stat table, Average trade size, Visible range profile, and Footprint Settings.
Overlays
From Indicators → Orderflow:
- Footprint: one per-bar footprint drawn over the candles. Same modes and options as a chart-type instance, but a single instance (no Footprint 2–5).
- Visible Range Footprint: only the edge-pinned aggregate strip. Because it sums a range rather than tracking single bars, it drops the per-bar projections: no POC extension, no stacked-imbalance zones, no unfinished auctions. Alignment picks the edge (Right or Left).
Use an overlay when you want candles plus flow; use the chart type when the footprint is the chart.
Sessions
Footprints follow the chart's session setting: on an RTH chart they cover regular hours only, on an ETH chart the full extended tape (see Data). There is no separate footprint session control.