
Volume Profiles
Volume-at-price profiles for a session, a rolling window, or the visible range.
A volume profile is volume at price over a chosen window, drawn as a ladder on the price pane with POC and value-area levels. Three variants cover the three windows you usually want; they differ in data source too:
- Session and Rolling profiles are built from real footprint levels, keep the buy/sell split per row, and need footprint data.
- Visible Range profile is built from candle volume, so it works on every market, but it colors rows by up/down bar direction, not by buy/sell aggressor.
Add them from Indicators → Orderflow.
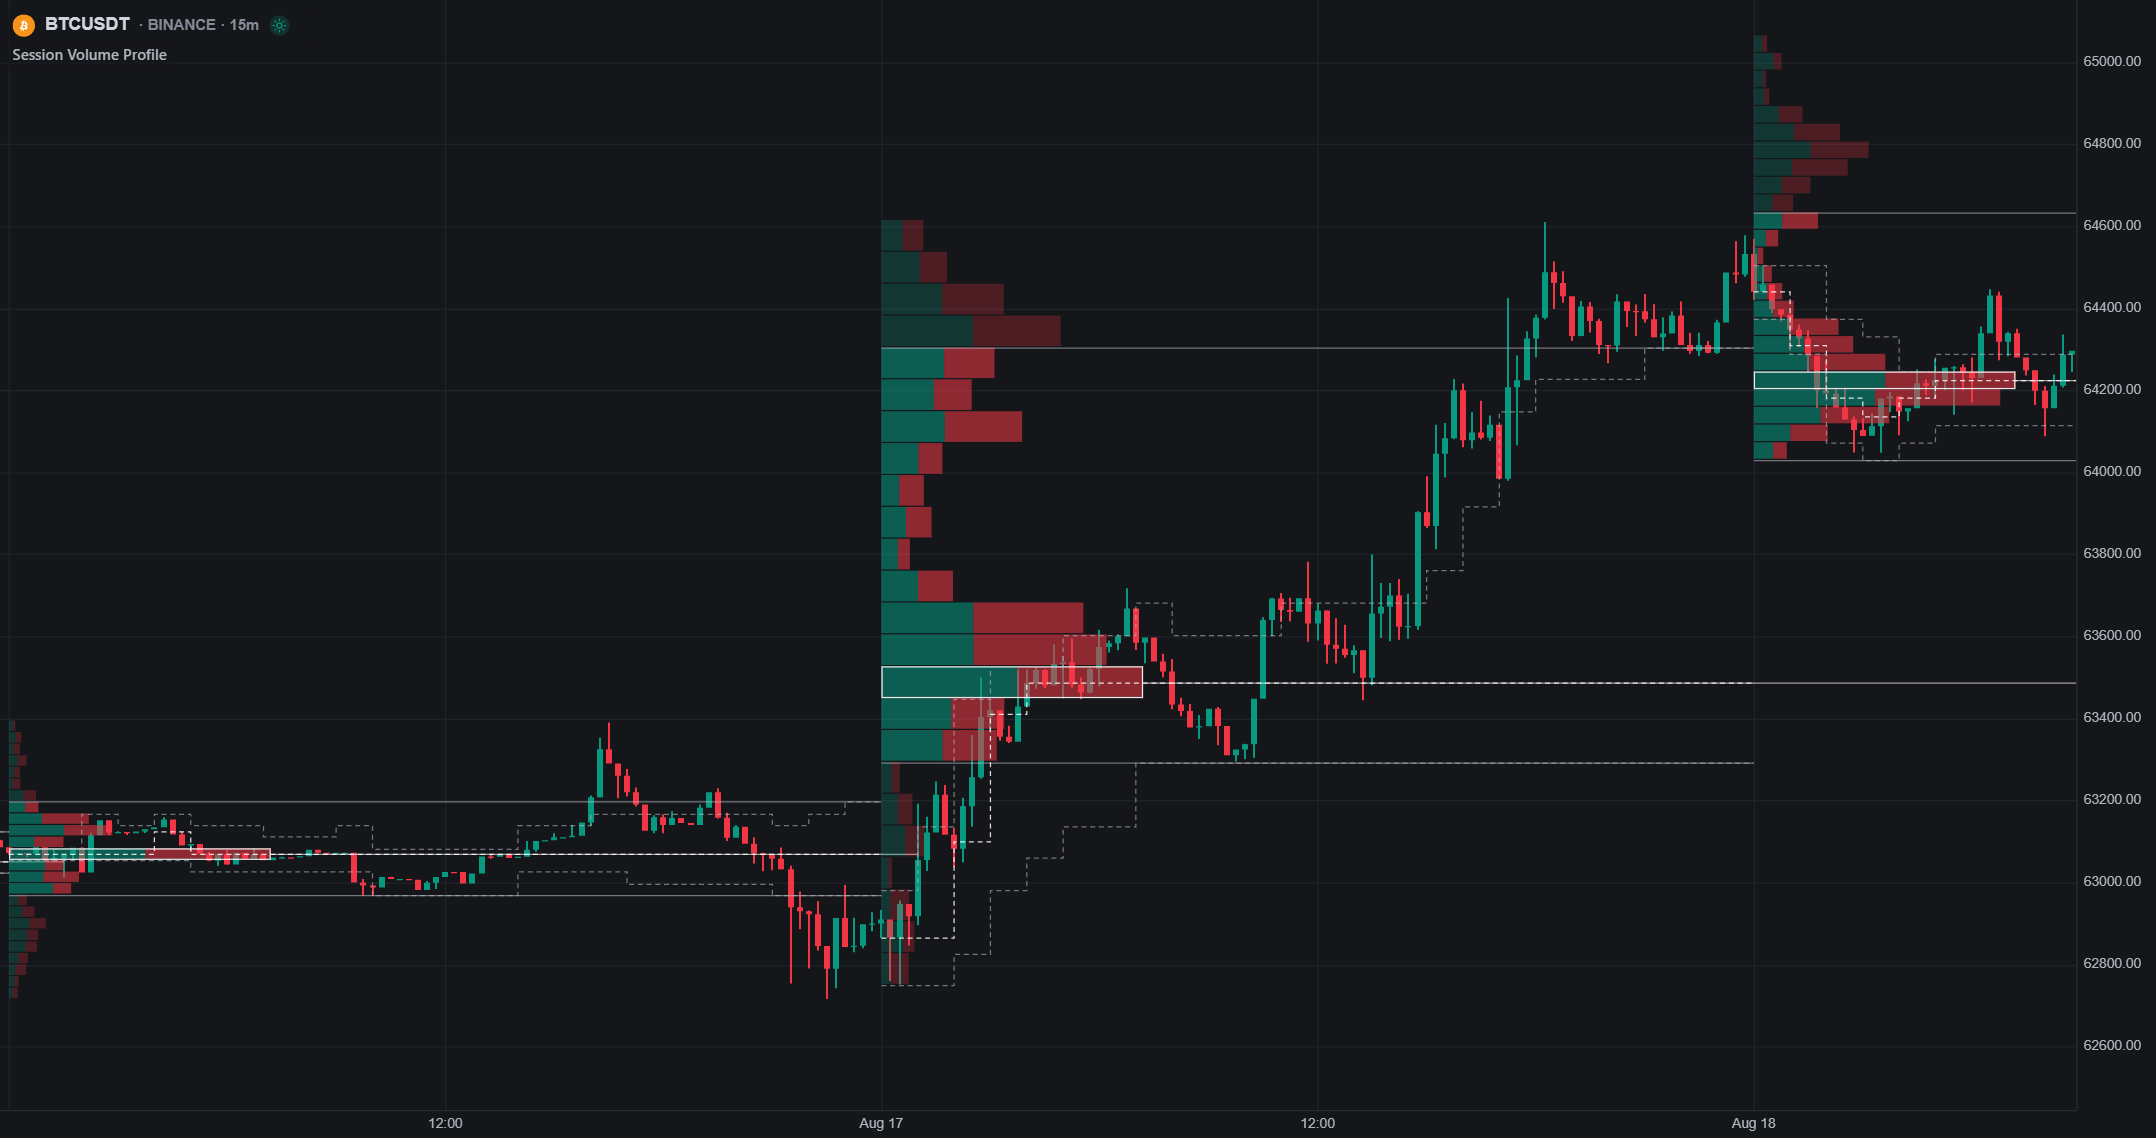
Session Volume Profile
One profile per session. The session window uses the same controls as TPO: Session (Day / Week / Month) and, for day sessions, Trading hours: venue-calendar RTH/ETH, named UTC windows (US pre-market/market/post-market, London, New York, Asia), or a custom UTC HHMM range.
Profile options: Rows (default 24), Width % (how much of the session the largest row spans, default 30), Value area % (default 70), and buy/sell colors.
Levels:
- Point of control and VAH / VAL levels mark the completed structure per session.
- Extend POC until reached projects each session's POC rightward until a later bar trades through it. Untested (naked) POCs run to the newest bar.
- Developing POC and Developing VA plot how the POC and value area migrated during each session as dashed traces. Where the final levels only tell you the outcome, the developing lines show the auction's path.
Rolling Volume Profile
One profile over the newest N bars (Bars, default 100), sliding forward as new bars close. Same rows / width / value area / POC / VAH-VAL options as the session variant; no POC extension or developing lines, since the window always ends at the newest bar.
Use it when you care about recent acceptance regardless of session boundaries.
Visible Range Volume Profile
A profile of whatever bars are on screen, recomputed as you pan and zoom. Options: Rows, Width %, Up / Down colors, Point of control, Value area %.
Because it reads candle volume it runs on every market: the trade-off is no buy/sell split. For a visible-range profile with the real aggressor split (plus imbalances and cell values), use the Visible Range Footprint on footprint-capable symbols instead.