
Order Flow
Volume Bubbles
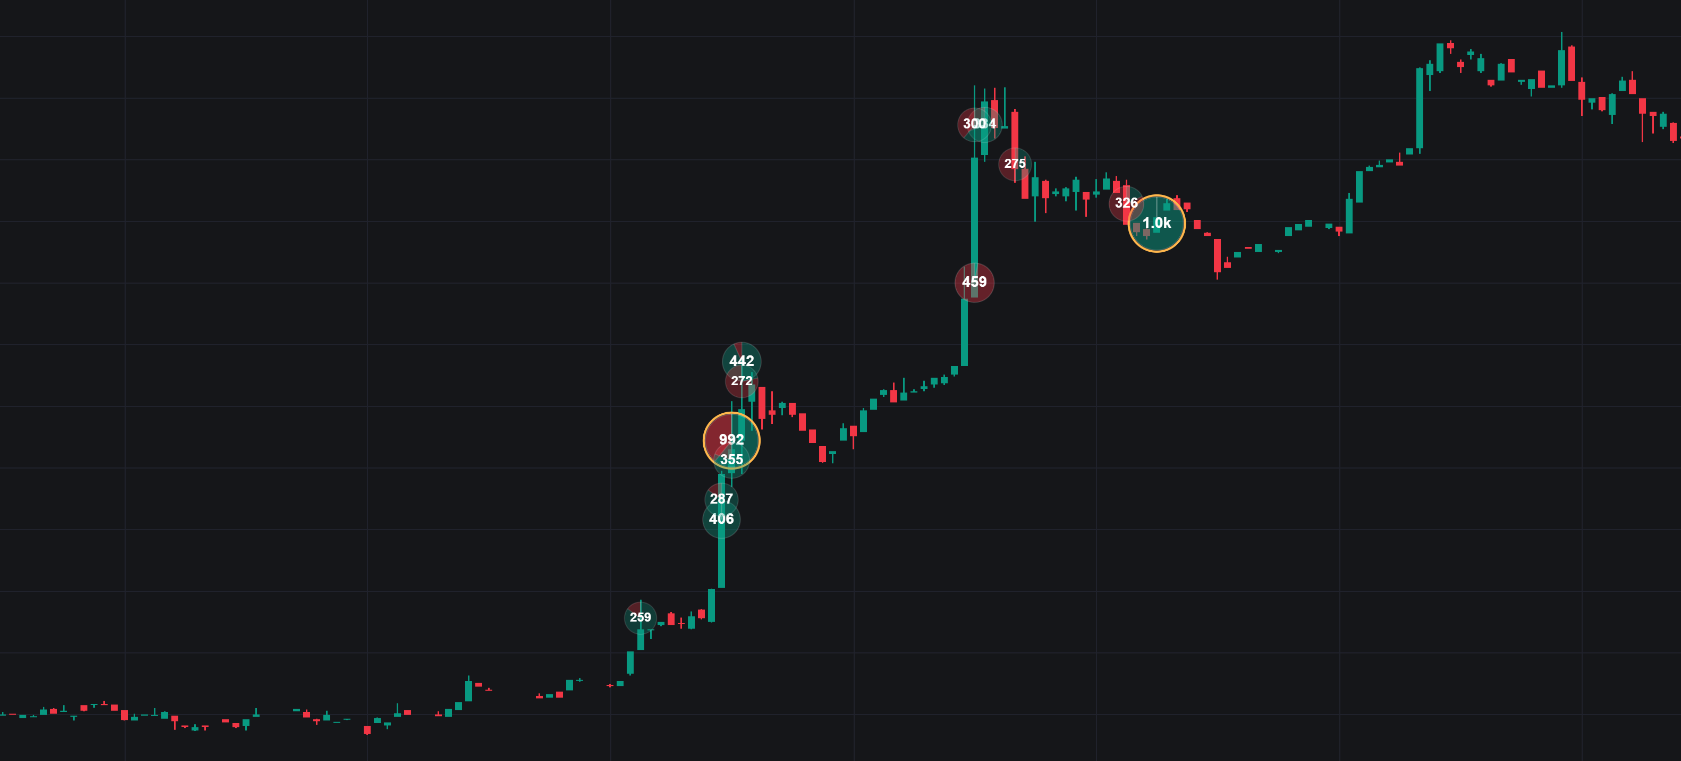
Volume Bubbles mark size at price; Delta mode splits each cluster by side.
Volume Bubbles plots a dot on the price pane for each bar × price bucket, sized by the volume that traded there. It answers where size traded at a glance, without switching to a full Footprint.
Needs footprint data. Add it from Indicators → Orderflow.
Filters
The point of the tool is isolating the clusters that matter, so the filters do the heavy lifting:
- Volume Min / Max: absolute volume bounds (0 = off).
- Hide below (%) (default 50): drop bubbles smaller than this share of the largest visible one, keeping the display relative to current conditions.
- Min delta (%): only show clusters with at least this much buy/sell imbalance, filtering for one-sided size.
- Max visible: keep only the top N bubbles on screen (up to 500).
Display
- Mode: Total sizes a single dot per cluster; Delta paints each cluster as a buy/sell pie, so you see the split inside every bubble.
- Rows: Auto, or Manual with Ticks per row (default 8) to control the price bucketing.
- Size (px): minimum and maximum bubble radius (defaults 5–25); Opacity (%) and Gradient fade smaller bubbles so the big ones dominate.
- Hover tooltip: per-bubble readout on hover.
Style
- Color by dominant side (Total mode) tints each bubble by whichever side traded more, with a Neutral color when disabled.
- Highlight largest rings bubbles at or above a share of the visible maximum (≥ %, default 80). The standouts get a literal ring around them.
- Volume labels print the volume on the bubbles.