
Order Flow
Volume Tails
Volume tails accumulate buy volume from the low and sell volume from the high of a range.
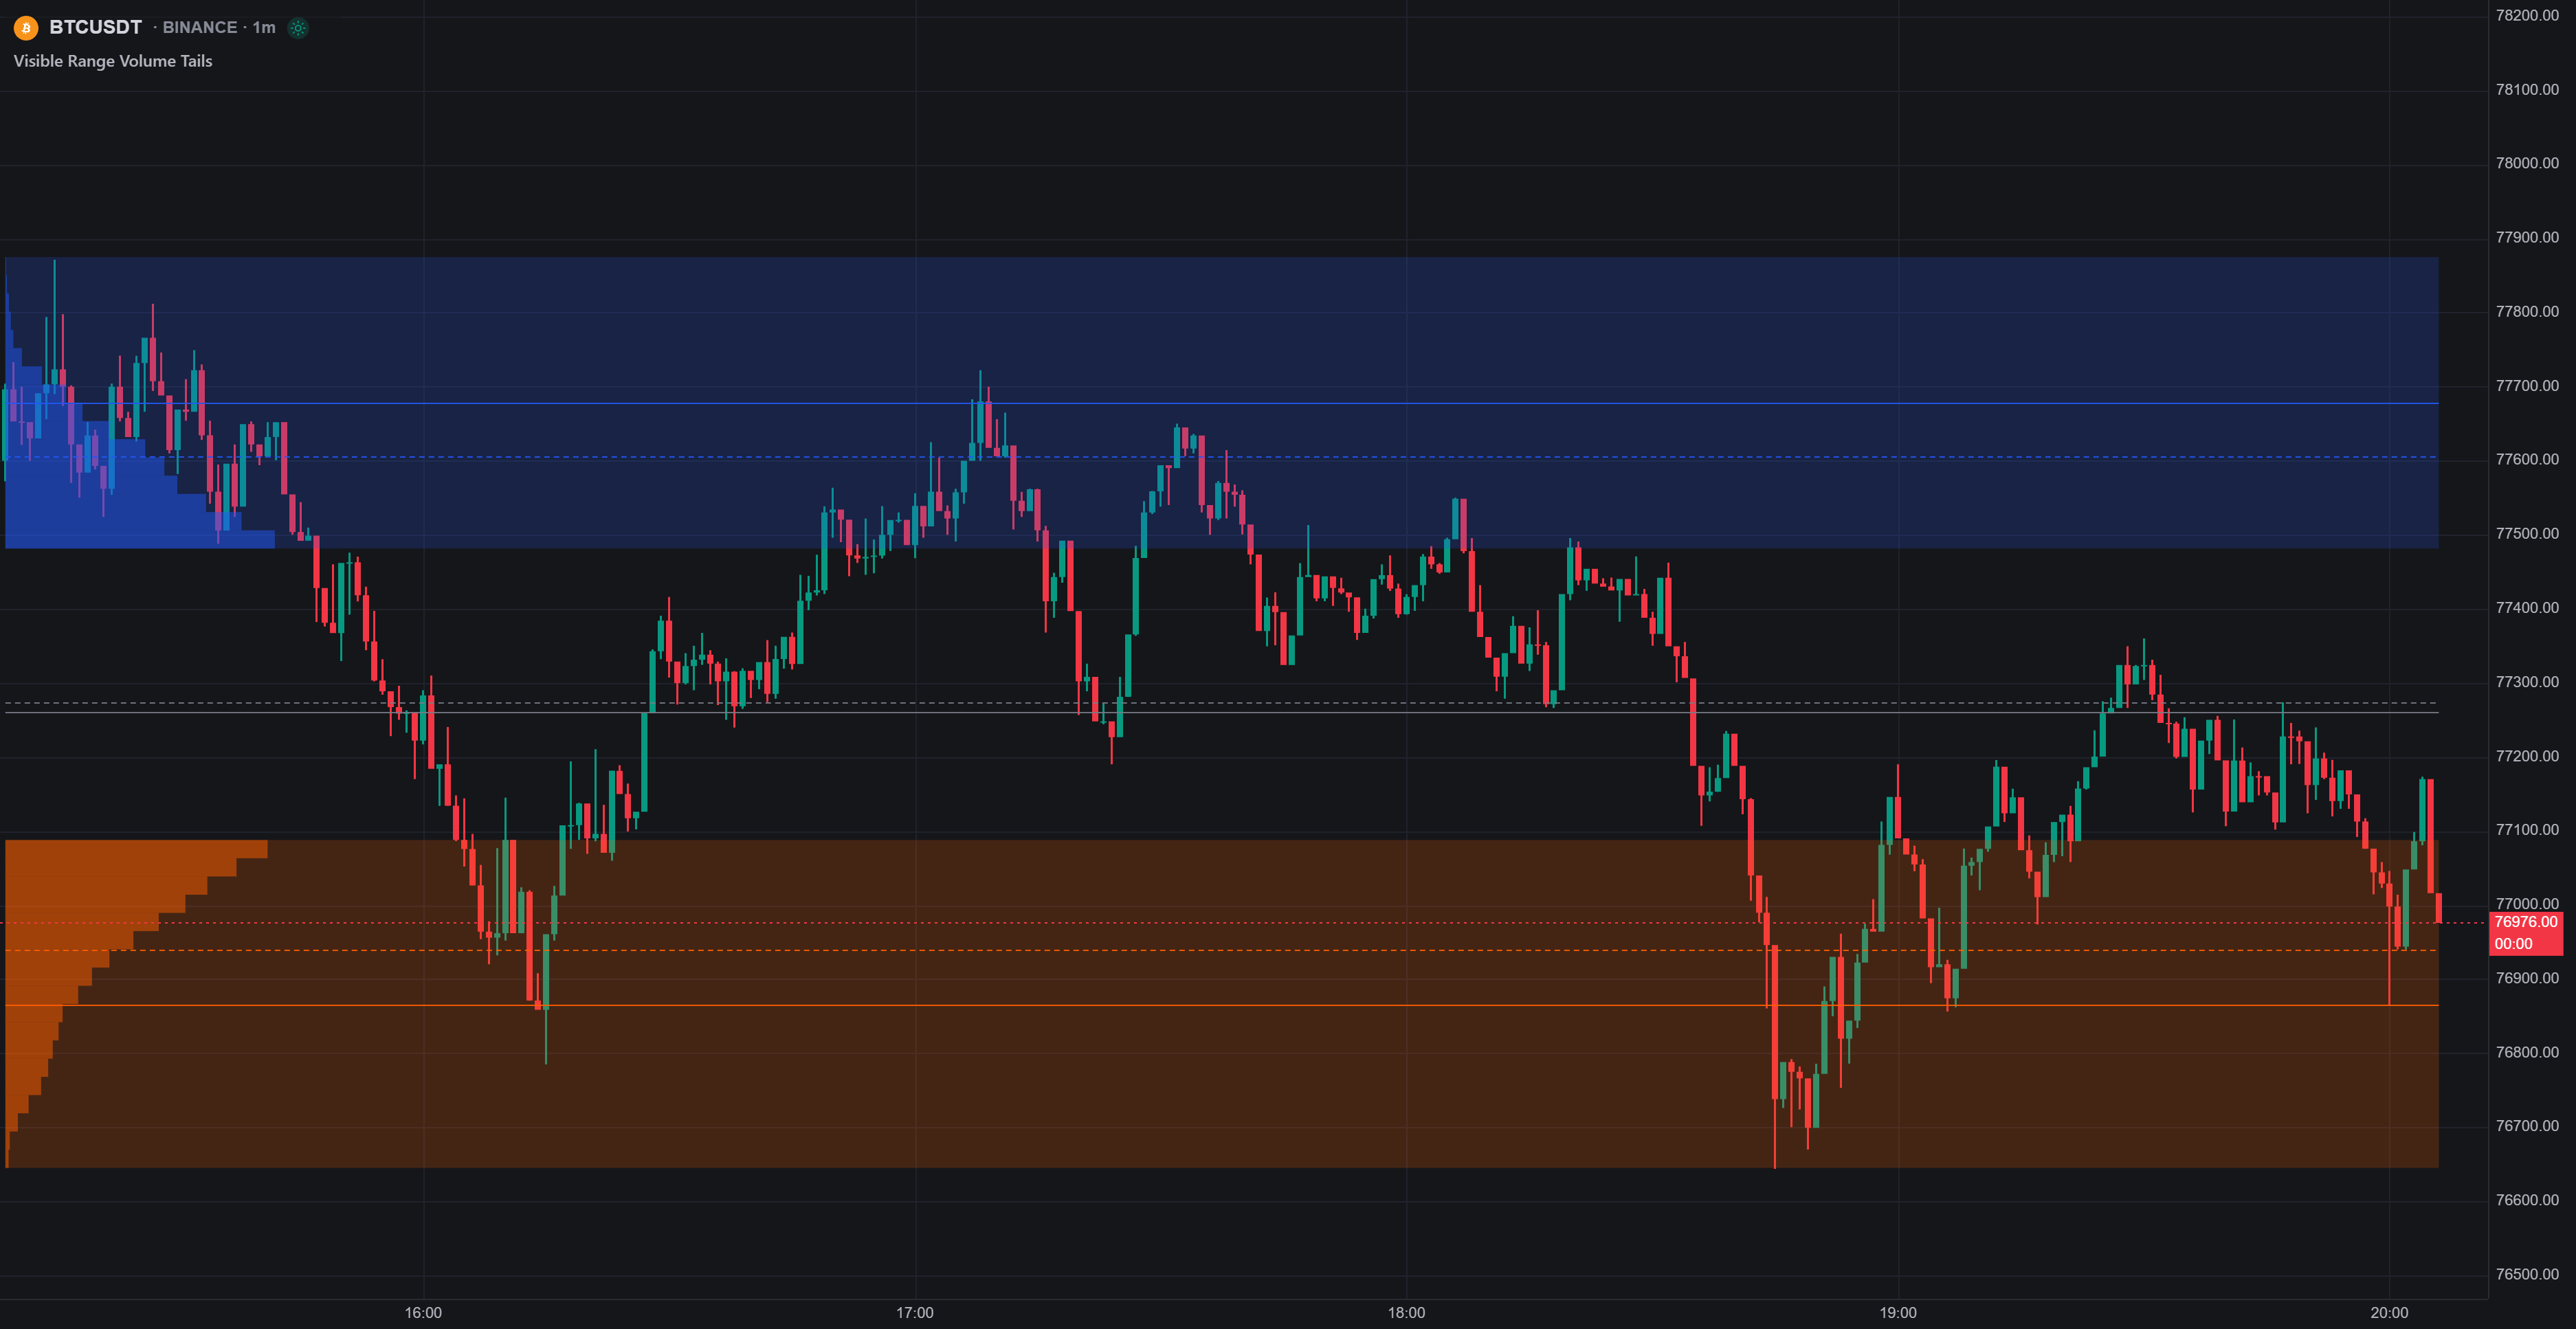
Volume tails read a range from its extremes inward: sell volume accumulates down from the range high (supply) and buy volume accumulates up from the range low (demand), each side stopping once it holds a set share of the range's total volume. The result marks where selling stacked against the highs and buying stacked against the lows, without the noise of the full histogram in between (that's Volume Profiles).
They need footprint data. Add them from Indicators → Orderflow.
Settings
- Threshold % (default 10): the share of the range's total volume each tail accumulates before it stops. Lower = tighter extreme zones; higher = deeper tails.
- Resolution (default 50): how many price bins the range is split into.
- Supply and Demand each have a color plus toggles for the Area fill, an Average line, and a Weighted average line (volume-weighted, so it leans toward where the size actually sat).
- Equilibrium adds the midpoint between the two tails, also with average and weighted-average variants.
Variants
The four variants share the same drawing; only the range differs:
| Variant | Range |
|---|---|
| Fixed Range Volume Tails | A window you pick. Adding the indicator starts an interactive two-click range selection on the chart, and the anchor lines stay draggable afterwards. Leaving the end open makes it follow the newest bar |
| Visible Range Volume Tails | The bars currently on screen, recomputed as you pan and zoom |
| Rolling Volume Tails | The newest N bars (Bars, default 100), sliding as bars close |
| Session Volume Tails | One drawing per session, with the same session controls as Session Volume Profile: day/week/month and trading-hours windows |